

International Tourism Receipts by Country: Latest Tourism Revenue Ranking
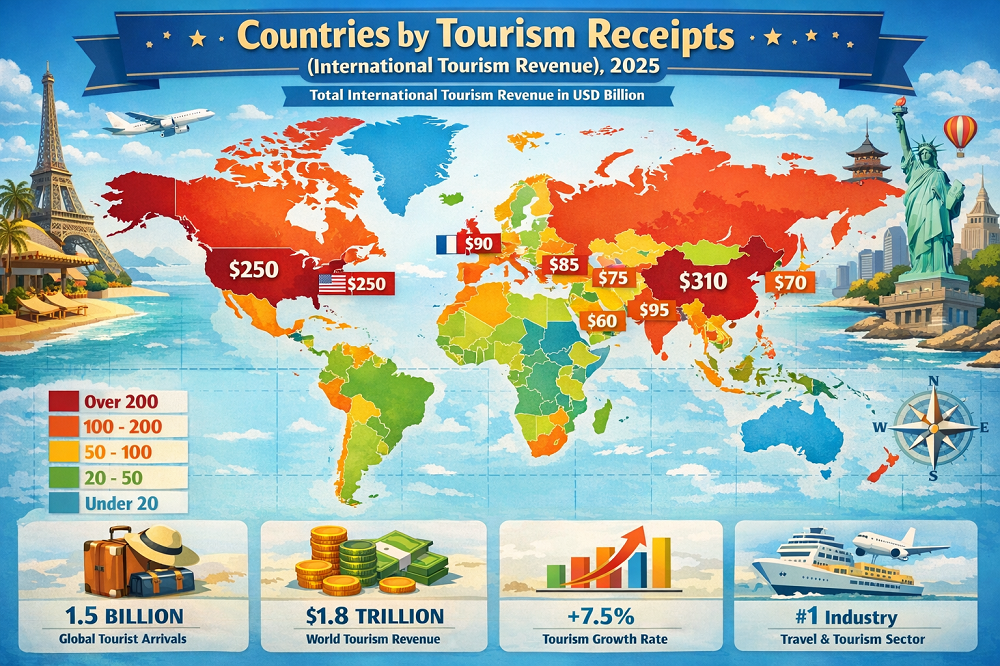
International tourism receipts show who turns visitor flows into revenue, not just headlines
International tourism receipts capture the money a destination earns from foreign visitors. Compared with arrivals alone, this indicator says more about spending power, trip mix, air connectivity, premium positioning, and the ability to convert demand into export revenue. The latest broad cross-country snapshot comes from the 2024 reporting year, which serves as the basis for this ranking.
The global picture is not only about who attracts the biggest crowds. The United States remains the clear leader in total receipts, while Spain, the United Kingdom, France, Italy, Japan, Australia, Canada, Türkiye, and the United Arab Emirates show how different tourism models can all generate very large revenue streams.
Receipts are not arrivals
The top 10 receipts ranking should be read through spending per visitor, trip mix, premium, business, and long-haul demand, and overall monetization efficiency. That is why some countries with enormous arrival volumes do not lead on revenue, while premium urban hubs and long-haul destinations can outperform larger visitor markets.
Top 10 countries by international tourism receipts
The United States sits far above every other country in total tourism revenue. A large domestic aviation system, high-spend long-haul visitors, business travel, premium urban markets, and very high trip budgets all reinforce its lead.
Spain pairs huge arrival volumes with a very broad accommodation, transport, leisure, and food ecosystem. Its strength is not only beaches or cities, but the ability to monetize repeat demand across many regions and seasons.
The United Kingdom converts fewer visitors than France or Spain into a very large revenue stream because trip spend is high, London is a premium city destination, and business, education, events, and culture all lift visitor budgets.
France remains one of the most visited countries in the world, but its receipts ranking shows that sheer visitor volume does not automatically produce the highest spending per trip. It still earns at an elite scale through diversified demand.
Italy combines iconic cities, heritage routes, food tourism, coastlines, and luxury travel. Its monetization profile is strong, but it remains more mid-spend per visitor than the most premium long-haul markets.
The UAE shows how a hub model can outperform many much larger arrival markets. Aviation connectivity, retail, luxury hospitality, events, and premium city branding turn a relatively concentrated visitor base into very high receipts.
Türkiye sits in the top global group because it sells a very wide range of tourism products: city breaks, beach holidays, transit, health travel, and regional short-haul trips. It performs strongly on both volume and spend capture.
Japan climbed back into the top tier as international demand returned. Currency effects, high interest in multi-city trips, shopping, and premium culture-led itineraries all helped receipts recover quickly.
Australia shows the economics of a long-haul market: fewer visitors than European mass destinations, but much higher spend intensity once people arrive. Distance, trip length, and premium travel patterns all matter.
Canada benefits from a mix of cross-border movement, nature and city tourism, education-linked travel, and long-haul demand. Its receipts performance is stronger than simple arrival counts would suggest.
Table 1. Top 10 receipts snapshot
| Rank | Country | International tourism receipts |
|---|---|---|
| 1 | United States | US$ 215.0 bn |
| 2 | Spain | US$ 106.5 bn |
| 3 | United Kingdom | US$ 84.5 bn |
| 4 | France | US$ 77.1 bn |
| 5 | Italy | US$ 58.7 bn |
| 6 | United Arab Emirates | US$ 57.0 bn |
| 7 | Türkiye | US$ 56.3 bn |
| 8 | Japan | US$ 54.7 bn |
| 9 | Australia | US$ 52.0 bn |
| 10 | Canada | US$ 49.9 bn |
Chart 1. Revenue leaders among the top 10
Values are shown in current US$ billions. This indicator is about money earned from foreign visitors, not the raw number of international arrivals.
Methodology
This article uses international tourism receipts as the central ranking metric. In the UN Tourism framework, receipts measure money received by the destination from foreign visitors, including spending on accommodation, food, local transport, entertainment, shopping, and fares paid to the destination country’s own airlines. The indicator is expressed in current US dollars, so it is not inflation-adjusted and it is not PPP-adjusted.
The latest broad cross-country snapshot available in open international series is the 2024 reporting year. That is why 2024 is used here as the practical base for the ranking. Top-line ranking values are harmonized from the latest cross-country tourism receipts releases, while the extended country table in Part 2 adds country-level change markers and filterable rows for a selected set of major markets.
There are important limitations. First, receipts can move because of real tourism performance, but also because of exchange rates and price levels, since the series is expressed in current US$. Second, countries differ in trip structure: some depend on long-haul, premium, business, or education-linked travel, while others depend more on short-haul, mass leisure, or same-day visitors. Third, a receipts ranking should never be confused with value added, profitability, or resident welfare. It is an export-revenue indicator, not a full tourism development score.
Receipts are not arrivals
The top 10 makes sense only when the ranking is read as a measure of monetization efficiency, not crowd size. The United States leads because it captures very high spending per visitor through long-haul demand, premium city stays, business travel, education-linked trips, and large event-driven flows. That mix produces far more revenue than a simple headcount comparison would suggest.
Spain shows what happens when a destination combines very large scale with strong commercialization across many regions and seasons. France, by contrast, reminds readers that elite arrival totals do not automatically create the highest receipts. The gap reflects differences in average trip budget, length of stay, visitor composition, and how much of the travel basket is captured locally.
The United Kingdom, the United Arab Emirates, Australia, and Japan all illustrate the role of premium, business, and long-haul demand. These markets are not defined only by how many people cross the border. They perform well because each traveler tends to spend more on accommodation, aviation, retail, dining, events, or multi-stop itineraries. In practice, that means high receipts often signal stronger pricing power and deeper value capture per trip.
What this means for the reader
For readers tracking investment or business opportunities, a receipts ranking is often more useful than an arrivals ranking. Hotels, aviation, luxury retail, destination services, and food and beverage operators care about monetization. A country with slightly fewer visitors can still be the stronger revenue market if trip spending is higher.
For relocation, property, or hospitality readers, tourism receipts help explain why some destinations support stronger room rates, stronger seasonal pricing, and more premium urban demand. For students of the global economy, the ranking also shows tourism as a major services-export engine. The most successful destinations are not simply busy. They are good at converting visitor flows into spend.
FAQ
Why is the United States number one by receipts?
The United States combines scale with unusually high visitor spending. Long-haul travel, premium cities, education, business, events, and large domestic airline networks all push receipts much higher than simple arrival counts would suggest.
Why does France rank below the United States even with huge arrival numbers?
Because arrivals count people, while receipts count money. France is one of the largest destination markets by visitors, but average spend per trip is lower than in the United States and some other premium long-haul markets.
Why is Spain so strong on tourism revenue?
Spain combines very large visitor numbers with a deep tourism economy: hotels, transport, restaurants, beach destinations, city travel, island travel, and long-established repeat demand across many regions.
Does high tourism receipts always mean a country is “better” for tourists?
No. High receipts can mean premium pricing, long-haul trip structure, strong business travel, or expensive urban stays. It is a revenue metric, not a quality, affordability, or sustainability score.
Why use 2024 data for a 2025 article?
Because 2024 is the latest broad internationally comparable reporting year currently available in the open cross-country tourism receipts series. That makes it the most defensible base for this ranking.
Are tourism receipts the same as total tourism impact on GDP?
No. Receipts measure money earned from foreign visitors. They do not capture the entire domestic tourism economy, multiplier effects, resident welfare, or profitability across tourism businesses.
Receipts are not arrivals: compare revenue capture across major tourism markets
This section compares money earned, not just visitor volume. The table helps show where tourism demand is monetized most effectively across major destination markets. The default view starts at Top 20, while the scope control can expand the visible set for wider comparison.
A country can rank lower on arrivals yet still rank much higher on receipts if spending per visitor, trip mix, premium and business demand, or average stay length are stronger.
Compare tourism revenue with tourist arrivals by country
| Rank | Country | Value | Change vs previous comparable year |
|---|---|---|---|
| 1 | United States | US$ 213.78 bn18.14% | +7.40% |
| 2 | Spain | US$ 106.66 bn9.05% | +34.04% |
| 3 | United Kingdom | US$ 84.55 bn7.18% | +44.70% |
| 4 | France | US$ 77.06 bn6.54% | +21.49% |
| 5 | Italy | US$ 58.81 bn4.99% | +18.76% |
| 6 | Türkiye | US$ 56.31 bn4.78% | +64.15% |
| 7 | Japan | US$ 54.62 bn4.64% | +18.61% |
| 8 | Australia | US$ 51.98 bn4.41% | +13.67% |
| 9 | Canada | US$ 49.89 bn4.23% | +67.28% |
| 10 | Thailand | US$ 42.69 bn3.62% | −28.62% |
| 11 | Saudi Arabia | US$ 40.96 bn3.48% | +149.30% |
| 12 | Germany | US$ 40.13 bn3.41% | −3.90% |
| 13 | China | US$ 39.75 bn3.37% | +10.92% |
| 14 | India | US$ 35.02 bn2.97% | +13.99% |
| 15 | Mexico | US$ 32.96 bn2.80% | +34.12% |
| 16 | Portugal | US$ 30.00 bn2.55% | +46.75% |
| 17 | Austria | US$ 26.32 bn2.23% | +14.52% |
| 18 | Singapore | US$ 23.85 bn2.02% | +17.48% |
| 19 | Greece | US$ 23.48 bn1.99% | +15.81% |
| 20 | Netherlands | US$ 22.56 bn1.91% | +21.43% |
| 21 | South Korea | US$ 16.72 bn1.42% | −19.89% |
| 22 | Indonesia | US$ 16.71 bn1.42% | −1.20% |
| 23 | Poland | US$ 14.27 bn1.21% | +1.90% |
| 24 | Philippines | US$ 9.71 bn0.82% | −0.74% |
| 25 | New Zealand | US$ 9.57 bn0.81% | −9.60% |
Source base: latest cross-country tourism receipts snapshot for 2024, used here as the latest comparable base for this ranking. The share toggle shows each country’s share of this listed set, not of world tourism receipts. Change values are harmonized from the latest public country tourism profiles and should be read as directional markers rather than as official national releases.
Receipts are not arrivals: arrivals and receipts do not move in lockstep
The scatter plot compares international arrivals with tourism receipts for a selected group of major markets. Destinations high on the chart but further left generate comparatively more revenue from a smaller visitor base. Destinations further right with modest vertical positioning are often volume leaders with lower revenue intensity per visit.
Read this as a practical view of spending per visitor, trip mix, and monetization efficiency. The gap between arrivals and receipts is where premium, long-haul, urban, aviation-linked, and business-heavy demand becomes visible.
Horizontal axis: international arrivals in millions. Vertical axis: tourism receipts in current US$ billions. The chart is designed to show monetization patterns, not to replace country-level tourism accounts.
How to interpret the ranking without confusing popularity with revenue strength
International tourism receipts are one of the clearest ways to see tourism as a cross-border export industry. They tell us where foreign visitors leave the most money, which makes the ranking especially useful for analyzing monetization, service export strength, and travel-sector commercial depth. But the ranking becomes much more valuable when it is read together with arrivals, revenue intensity, trip mix, and seasonality.
Receipts are not arrivals. A destination can dominate headlines by visitor count and still trail a rival on revenue if average spend per trip is lower, stays are shorter, or a larger share of demand comes from lower-yield segments.
The core lesson is that there are at least three recurring models in global tourism. The first is the scale model, where huge visitor numbers power receipts even if average spend per trip is moderate. Spain and France are classic examples. The second is the premium-yield model, where fewer visitors generate much larger budgets per trip. The United Kingdom, Australia, and premium hub destinations fit this logic well. The third is the hub-and-connectivity model, where aviation, stopovers, events, retail, and premium urban services allow a destination to outperform its size.
That is why it is risky to treat arrivals as the only main indicator. A destination can grow arrivals but lose pricing power, shorten average stays, or attract lower-spend demand. In those cases the headline can still look strong while the export-value story is weaker. Receipts help correct that blind spot.
Compare tourism revenue with tourist arrivals by country
Policy takeaways
What the strongest tourism earners tend to do well:
- They convert access into spending, not just arrivals.
- They keep a broad product mix: cities, leisure, events, food, culture, and premium accommodation.
- They connect air access, branding, hospitality quality, and local transport instead of treating tourism as a single-sector story.
- They diversify source markets so receipts are not overly dependent on one geography or one season.
- They protect yield through pricing power, visitor experience, and repeat demand.
For policymakers, the ranking argues for moving beyond simple “more tourists” targets. A destination that keeps pushing headcount without lifting quality, spend, stay length, or local value capture can end up with congestion and weaker monetization. The more useful strategic question is not only how many visitors arrive, but what kind of demand the destination is building.
For business readers, the implication is similar. Hotels, airlines, attractions, travel-tech firms, food-service operators, and retail brands should watch receipts because they indicate where foreign demand is translating into real purchasing power on the ground. That matters more commercially than a popularity ranking by arrivals alone.
Final interpretation
The tourism receipts hierarchy is really a map of who monetizes international mobility best. The United States leads because it captures exceptional spending from a very large and diverse visitor base. Spain and France show how broad destination ecosystems support enormous tourism exports. The United Kingdom, Australia, Japan, and premium hub markets show that high-value positioning can rival much larger arrival markets. Türkiye and other fast-improving destinations show how price competitiveness, scale, and diversified source demand can move a country into the top group.
This indicator helps separate busy destinations from high-earning destinations. That makes it especially useful for tourism strategy, hospitality analysis, and readers who want a more economic view of travel than simple crowd statistics.
Readers who want the full picture should always compare the two lenses side by side: who gets the most visitors, and who earns the most from them.
Sources
-
UN Tourism Statistics DatabasePrimary international source for tourism receipts, arrivals, expenditure, tourism industries, and employment data.
https://www.untourism.int/tourism-statistics/tourism-statistics-database -
Our World in Data — Spending by international visitors while visiting a countryPublic data page built from UN Tourism data, with metadata, processing notes, update timing, and downloadable series.
https://ourworldindata.org/grapher/spending-by-international-visitors-while-visiting-a-country -
UN Tourism — International tourism recovers pre-pandemic levels in 2024Official global context on recovery, receipts, and tourism exports in the latest annual rebound phase.
https://www.untourism.int/news/international-tourism-recovers-pre-pandemic-levels-in-2024 -
Our World in Data — Tourism topic pageBroader analytical context for tourism indicators and long-run cross-country comparisons.
https://ourworldindata.org/tourism
The ranking uses 2024 because it is the latest broad internationally comparable receipts year currently available in open international data for this comparison.
