

Rent Growth vs. Household Income by U.S. State (2019–2025)
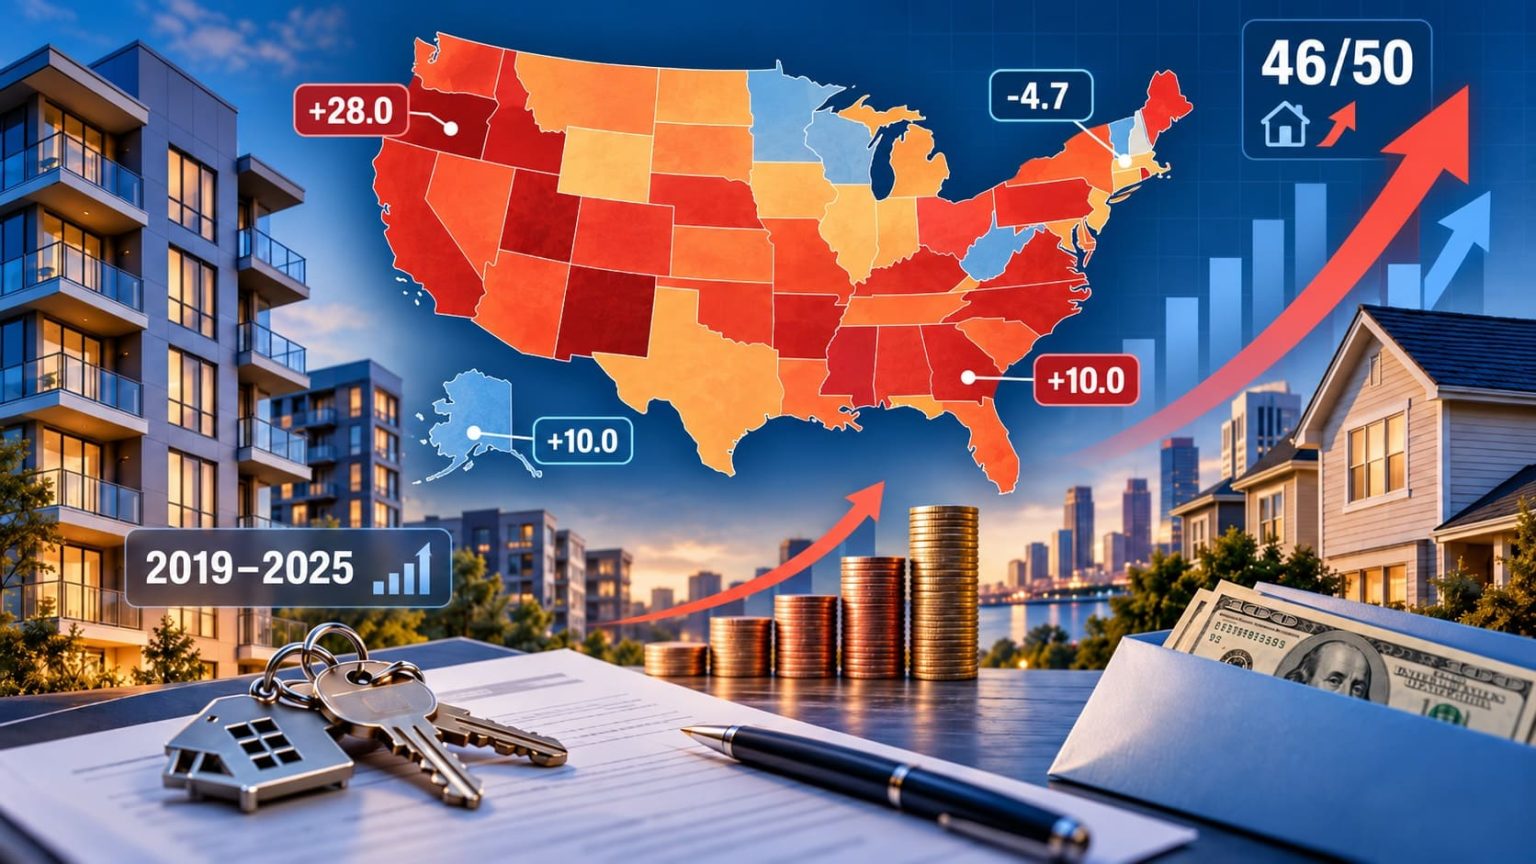
Where Did Rent Grow Faster Than Household Income? 50-State Comparison
From 2019 to 2025, median gross rent increased faster than median household income in 46 of the 50 U.S. states. Idaho led with a +28.0 percentage-point gap, followed by Arizona (+20.6 pp) and South Carolina (+20.3 pp). Using Census ACS 1-year estimates, the ranking sorts states by rent growth minus household-income growth, from the largest gap to the smallest.
Source: U.S. Census Bureau, American Community Survey (ACS) 1-year estimates, B25064 and B19013. Coverage: 50 states (excluding Washington, D.C. and Puerto Rico). Unit: percentage points (pp). Period: 2019–2025, displayed as an October 31, 2026 data snapshot. Status: 50 calculated_value rankings from official published inputs; 0 forecasts or projections. Source review: October 31, 2026. The 2025 ACS 1-year estimates were released October 29, 2026.
The ranking compares two different survey populations: gross rent for occupied cash-rent homes, and income for all households, including homeowners. It is a difference in growth rates, not a direct measurement of renters' housing-cost burden.
Idaho: gross rent +66.1%; household income +38.1%.
Hawaii: gross rent +21.7%; household income +26.4%.
92% of included states have a positive point-estimate gap.
StatRanker-calculated median across 50 state gaps; Census ACS 2019 and 2025.
Overview: the rent-income growth gap
In Idaho, median gross rent climbed from $880 to $1,462 per month (+66.1%), while median household income increased from $60,999 to $84,234 per year (+38.1%). Hawaii sits at the opposite end of the ranking: its household-income growth exceeded rent growth by 4.7 percentage points.
The U.S.-level benchmark is different from the median of state results. National median gross rent rose from $1,097 to $1,557 (+41.9%), while national median household income rose from $65,712 to $84,780 (+29.0%), a national gap of +12.9 pp. The median of the 50 state gaps is +10.0 pp. One figure comes from national ACS medians; the other is the midpoint of 50 separate state gaps.
The national gap is 2.9 pp above the median state gap. That difference reflects how the two summary statistics are constructed; it is not a measure of how much more rent a typical U.S. household pays.
Top 10 states where rent growth most exceeded income growth
The Top 10 are sorted by the unrounded percentage-point gap. Their growth rates are based on the same ACS 1-year series and the same two endpoints.
| Rank | State | Gap | Rent growth / income growth, 2019–2025 |
|---|---|---|---|
| 1 | Idaho | +28.0 pp | Rent +66.1%; income +38.1% · ACS 2019 / 2025 · calculated_value |
| 2 | Arizona | +20.6 pp | Rent +54.2%; income +33.7% · ACS 2019 / 2025 · calculated_value |
| 3 | South Carolina | +20.3 pp | Rent +51.3%; income +31.0% · ACS 2019 / 2025 · calculated_value |
| 4 | Massachusetts | +20.2 pp | Rent +44.3%; income +24.1% · ACS 2019 / 2025 · calculated_value |
| 5 | Rhode Island | +18.9 pp | Rent +46.8%; income +27.9% · ACS 2019 / 2025 · calculated_value |
| 6 | Utah | +18.9 pp | Rent +49.9%; income +31.1% · ACS 2019 / 2025 · calculated_value |
| 7 | Georgia | +18.1 pp | Rent +50.1%; income +32.1% · ACS 2019 / 2025 · calculated_value |
| 8 | North Carolina | +16.3 pp | Rent +51.7%; income +35.4% · ACS 2019 / 2025 · calculated_value |
| 9 | Connecticut | +15.7 pp | Rent +42.7%; income +26.9% · ACS 2019 / 2025 · calculated_value |
| 10 | Wisconsin | +15.6 pp | Rent +40.6%; income +25.0% · ACS 2019 / 2025 · calculated_value |
Values rounded to one decimal place after ranking. Gap = rent growth (%) minus all-household income growth (%), measured in percentage points.
Chart: 20 largest rent-over-income growth gaps
The bars show the first 20 ranked state gaps, on a shared percentage-point scale. Each bar uses the same underlying unrounded gap as the full ranking table; bar length is relative to Idaho's +28.0 pp.
Idaho leads at +28.0 pp, 7.5 pp above second-place Arizona (+20.6 pp). Pennsylvania is 20th with +11.4 pp. All 20 shown gaps are positive.
Methodology and source limitations
Official inputs
Census ACS 1-year B25064_001E: median gross monthly rent in dollars for occupied renter homes paying cash rent, including utilities. B19013_001E: median annual household income before tax for all households. Both use the 2019 and 2025 survey years.
Calculated ranking metric
Rent growth = (gross rent 2025 / gross rent 2019 - 1) × 100. Income growth = (household income 2025 / household income 2019 - 1) × 100. Gap (pp) = rent growth - income growth. The raw gap determines descending rank.
Coverage and status
Exactly 50 states; Washington, D.C., Puerto Rico, cities and metros are excluded. All 50 gap values are StatRanker calculated_value derived from observed official ACS estimates, not Census-published rent-income gaps. No interpolation, modeled projection or forecast.
Year basis and rounding
Both measures are sourced from ACS 1-year releases, not overlapping ACS 5-year periods. Values use each survey year's dollars, with no CPI adjustment or constant-dollar conversion. Input dollar figures are unrounded as published; growth and gap are calculated first and displayed mostly to 0.1 pp.
Source roles and review
The Census Bureau is the sole independent numeric publishing organization. Hawaii DBEDT's 2019 rent table and Understand Idaho's reproduced 2025 state series are validation or distribution references, not additional independent surveys. Source review: October 31, 2026.
Uncertainty and interpretation
ACS values are sample estimates with margins of error. This ranking is descriptive; it does not test whether each growth difference is statistically significant. Very small gaps, especially Vermont (-0.004 pp), are practically indistinguishable at the displayed precision. Changes in the surveyed housing and household mix can alter medians.
Example (Idaho): rent growth = (1,462 / 880 - 1) × 100 = 66.1%; income growth = (84,234 / 60,999 - 1) × 100 = 38.1%; gap = 28.0 pp (rounded). The calculation compares rates of change, not rent dollars with income dollars; monthly and annual units are not divided against one another.
Data inclusion requires both ACS metrics in both endpoint years. No values were carried over from 2024 or substituted with CPS ASEC median income, which is collected using a different survey design. There are no missing state observations in this 50-state sample. Apparent order among near-equal gaps should not be read as statistically established.
Main ranking: all 50 U.S. states, 2019–2025
Search a state, filter by Census region or value status, and sort the original 50 ranked rows. The source notes show the four observed dollar inputs and both calculated growth rates for each result.
50 of 50 state rows shown.
| Rank | State | Gap (pp) | Source / method note |
|---|---|---|---|
| 1 | Idaho | +28.0 pp | calculated_value · Census ACS B25064/B19013 (2019, 2025) · rent $880→$1,462/mo (+66.1%) · income $60,999→$84,234/yr (+38.1%). Gap = rent growth − income growth. |
| 2 | Arizona | +20.6 pp | calculated_value · Census ACS B25064/B19013 (2019, 2025) · rent $1,101→$1,698/mo (+54.2%) · income $62,055→$82,940/yr (+33.7%). Gap = rent growth − income growth. |
| 3 | South Carolina | +20.3 pp | calculated_value · Census ACS B25064/B19013 (2019, 2025) · rent $922→$1,395/mo (+51.3%) · income $56,227→$73,672/yr (+31.0%). Gap = rent growth − income growth. |
| 4 | Massachusetts | +20.2 pp | calculated_value · Census ACS B25064/B19013 (2019, 2025) · rent $1,360→$1,962/mo (+44.3%) · income $85,843→$106,539/yr (+24.1%). Gap = rent growth − income growth. |
| 5 | Rhode Island | +18.9 pp | calculated_value · Census ACS B25064/B19013 (2019, 2025) · rent $1,043→$1,531/mo (+46.8%) · income $71,169→$91,039/yr (+27.9%). Gap = rent growth − income growth. |
| 6 | Utah | +18.9 pp | calculated_value · Census ACS B25064/B19013 (2019, 2025) · rent $1,098→$1,646/mo (+49.9%) · income $75,780→$99,311/yr (+31.1%). Gap = rent growth − income growth. |
| 7 | Georgia | +18.1 pp | calculated_value · Census ACS B25064/B19013 (2019, 2025) · rent $1,049→$1,575/mo (+50.1%) · income $61,980→$81,847/yr (+32.1%). Gap = rent growth − income growth. |
| 8 | North Carolina | +16.3 pp | calculated_value · Census ACS B25064/B19013 (2019, 2025) · rent $931→$1,412/mo (+51.7%) · income $57,341→$77,638/yr (+35.4%). Gap = rent growth − income growth. |
| 9 | Connecticut | +15.7 pp | calculated_value · Census ACS B25064/B19013 (2019, 2025) · rent $1,177→$1,679/mo (+42.7%) · income $78,833→$100,056/yr (+26.9%). Gap = rent growth − income growth. |
| 10 | Wisconsin | +15.6 pp | calculated_value · Census ACS B25064/B19013 (2019, 2025) · rent $867→$1,219/mo (+40.6%) · income $64,168→$80,213/yr (+25.0%). Gap = rent growth − income growth. |
| 11 | New Hampshire | +14.9 pp | calculated_value · Census ACS B25064/B19013 (2019, 2025) · rent $1,147→$1,742/mo (+51.9%) · income $77,933→$106,759/yr (+37.0%). Gap = rent growth − income growth. |
| 12 | Tennessee | +14.7 pp | calculated_value · Census ACS B25064/B19013 (2019, 2025) · rent $904→$1,356/mo (+50.0%) · income $56,071→$75,875/yr (+35.3%). Gap = rent growth − income growth. |
| 13 | Ohio | +14.5 pp | calculated_value · Census ACS B25064/B19013 (2019, 2025) · rent $813→$1,155/mo (+42.1%) · income $58,642→$74,804/yr (+27.6%). Gap = rent growth − income growth. |
| 14 | Florida | +14.2 pp | calculated_value · Census ACS B25064/B19013 (2019, 2025) · rent $1,238→$1,866/mo (+50.7%) · income $59,227→$80,846/yr (+36.5%). Gap = rent growth − income growth. |
| 15 | Maine | +14.0 pp | calculated_value · Census ACS B25064/B19013 (2019, 2025) · rent $870→$1,329/mo (+52.8%) · income $58,924→$81,760/yr (+38.8%). Gap = rent growth − income growth. |
| 16 | Illinois | +13.8 pp | calculated_value · Census ACS B25064/B19013 (2019, 2025) · rent $1,020→$1,419/mo (+39.1%) · income $69,187→$86,676/yr (+25.3%). Gap = rent growth − income growth. |
| 17 | Delaware | +12.8 pp | calculated_value · Census ACS B25064/B19013 (2019, 2025) · rent $1,116→$1,614/mo (+44.6%) · income $70,176→$92,520/yr (+31.8%). Gap = rent growth − income growth. |
| 18 | Indiana | +11.9 pp | calculated_value · Census ACS B25064/B19013 (2019, 2025) · rent $840→$1,187/mo (+41.3%) · income $57,603→$74,516/yr (+29.4%). Gap = rent growth − income growth. |
| 19 | Kentucky | +11.6 pp | calculated_value · Census ACS B25064/B19013 (2019, 2025) · rent $773→$1,072/mo (+38.7%) · income $52,295→$66,447/yr (+27.1%). Gap = rent growth − income growth. |
| 20 | Pennsylvania | +11.4 pp | calculated_value · Census ACS B25064/B19013 (2019, 2025) · rent $951→$1,329/mo (+39.7%) · income $63,463→$81,473/yr (+28.4%). Gap = rent growth − income growth. |
| 21 | New Jersey | +11.3 pp | calculated_value · Census ACS B25064/B19013 (2019, 2025) · rent $1,376→$1,885/mo (+37.0%) · income $85,751→$107,797/yr (+25.7%). Gap = rent growth − income growth. |
| 22 | Montana | +10.5 pp | calculated_value · Census ACS B25064/B19013 (2019, 2025) · rent $831→$1,208/mo (+45.4%) · income $57,153→$77,099/yr (+34.9%). Gap = rent growth − income growth. |
| 23 | Oklahoma | +10.3 pp | calculated_value · Census ACS B25064/B19013 (2019, 2025) · rent $814→$1,107/mo (+36.0%) · income $54,449→$68,441/yr (+25.7%). Gap = rent growth − income growth. |
| 24 | Nevada | +10.2 pp | calculated_value · Census ACS B25064/B19013 (2019, 2025) · rent $1,168→$1,692/mo (+44.9%) · income $63,276→$85,198/yr (+34.6%). Gap = rent growth − income growth. |
| 25 | Michigan | +10.1 pp | calculated_value · Census ACS B25064/B19013 (2019, 2025) · rent $888→$1,220/mo (+37.4%) · income $59,584→$75,832/yr (+27.3%). Gap = rent growth − income growth. |
| 26 | Nebraska | +9.9 pp | calculated_value · Census ACS B25064/B19013 (2019, 2025) · rent $859→$1,194/mo (+39.0%) · income $63,229→$81,614/yr (+29.1%). Gap = rent growth − income growth. |
| 27 | Texas | +9.8 pp | calculated_value · Census ACS B25064/B19013 (2019, 2025) · rent $1,091→$1,515/mo (+38.9%) · income $64,034→$82,625/yr (+29.0%). Gap = rent growth − income growth. |
| 28 | Minnesota | +9.8 pp | calculated_value · Census ACS B25064/B19013 (2019, 2025) · rent $1,016→$1,357/mo (+33.6%) · income $74,593→$92,297/yr (+23.7%). Gap = rent growth − income growth. |
| 29 | Virginia | +8.4 pp | calculated_value · Census ACS B25064/B19013 (2019, 2025) · rent $1,254→$1,734/mo (+38.3%) · income $76,456→$99,322/yr (+29.9%). Gap = rent growth − income growth. |
| 30 | Washington | +8.3 pp | calculated_value · Census ACS B25064/B19013 (2019, 2025) · rent $1,359→$1,873/mo (+37.8%) · income $78,687→$101,946/yr (+29.6%). Gap = rent growth − income growth. |
| 31 | Arkansas | +8.2 pp | calculated_value · Census ACS B25064/B19013 (2019, 2025) · rent $742→$1,055/mo (+42.2%) · income $48,952→$65,588/yr (+34.0%). Gap = rent growth − income growth. |
| 32 | Alabama | +8.1 pp | calculated_value · Census ACS B25064/B19013 (2019, 2025) · rent $807→$1,121/mo (+38.9%) · income $51,734→$67,663/yr (+30.8%). Gap = rent growth − income growth. |
| 33 | Oregon | +7.8 pp | calculated_value · Census ACS B25064/B19013 (2019, 2025) · rent $1,185→$1,629/mo (+37.5%) · income $67,058→$86,953/yr (+29.7%). Gap = rent growth − income growth. |
| 34 | Wyoming | +7.8 pp | calculated_value · Census ACS B25064/B19013 (2019, 2025) · rent $822→$1,087/mo (+32.2%) · income $65,003→$80,894/yr (+24.4%). Gap = rent growth − income growth. |
| 35 | North Dakota | +6.9 pp | calculated_value · Census ACS B25064/B19013 (2019, 2025) · rent $804→$1,071/mo (+33.2%) · income $64,577→$81,545/yr (+26.3%). Gap = rent growth − income growth. |
| 36 | California | +6.8 pp | calculated_value · Census ACS B25064/B19013 (2019, 2025) · rent $1,614→$2,160/mo (+33.8%) · income $80,440→$102,159/yr (+27.0%). Gap = rent growth − income growth. |
| 37 | New York | +6.5 pp | calculated_value · Census ACS B25064/B19013 (2019, 2025) · rent $1,309→$1,704/mo (+30.2%) · income $72,108→$89,210/yr (+23.7%). Gap = rent growth − income growth. |
| 38 | South Dakota | +6.4 pp | calculated_value · Census ACS B25064/B19013 (2019, 2025) · rent $769→$1,089/mo (+41.6%) · income $59,533→$80,506/yr (+35.2%). Gap = rent growth − income growth. |
| 39 | Kansas | +6.2 pp | calculated_value · Census ACS B25064/B19013 (2019, 2025) · rent $862→$1,134/mo (+31.6%) · income $62,087→$77,824/yr (+25.3%). Gap = rent growth − income growth. |
| 40 | Maryland | +5.9 pp | calculated_value · Census ACS B25064/B19013 (2019, 2025) · rent $1,401→$1,822/mo (+30.0%) · income $86,738→$107,700/yr (+24.2%). Gap = rent growth − income growth. |
| 41 | Missouri | +5.4 pp | calculated_value · Census ACS B25064/B19013 (2019, 2025) · rent $834→$1,142/mo (+36.9%) · income $57,409→$75,485/yr (+31.5%). Gap = rent growth − income growth. |
| 42 | Colorado | +5.0 pp | calculated_value · Census ACS B25064/B19013 (2019, 2025) · rent $1,369→$1,839/mo (+34.3%) · income $77,127→$99,729/yr (+29.3%). Gap = rent growth − income growth. |
| 43 | Mississippi | +3.3 pp | calculated_value · Census ACS B25064/B19013 (2019, 2025) · rent $777→$1,033/mo (+32.9%) · income $45,792→$59,346/yr (+29.6%). Gap = rent growth − income growth. |
| 44 | Iowa | +3.0 pp | calculated_value · Census ACS B25064/B19013 (2019, 2025) · rent $808→$1,026/mo (+27.0%) · income $61,691→$76,483/yr (+24.0%). Gap = rent growth − income growth. |
| 45 | West Virginia | +1.1 pp | calculated_value · Census ACS B25064/B19013 (2019, 2025) · rent $727→$921/mo (+26.7%) · income $48,850→$61,340/yr (+25.6%). Gap = rent growth − income growth. |
| 46 | Louisiana | +0.1 pp | calculated_value · Census ACS B25064/B19013 (2019, 2025) · rent $866→$1,105/mo (+27.6%) · income $51,073→$65,139/yr (+27.5%). Gap = rent growth − income growth. |
| 47 | Vermont | -0.004 pp | calculated_value · Census ACS B25064/B19013 (2019, 2025) · rent $980→$1,338/mo (+36.5%) · income $63,001→$86,018/yr (+36.5%). Gap = rent growth − income growth. |
| 48 | New Mexico | -0.2 pp | calculated_value · Census ACS B25064/B19013 (2019, 2025) · rent $847→$1,145/mo (+35.2%) · income $51,945→$70,342/yr (+35.4%). Gap = rent growth − income growth. |
| 49 | Alaska | -1.3 pp | calculated_value · Census ACS B25064/B19013 (2019, 2025) · rent $1,201→$1,500/mo (+24.9%) · income $75,463→$95,220/yr (+26.2%). Gap = rent growth − income growth. |
| 50 | Hawaii | -4.7 pp | calculated_value · Census ACS B25064/B19013 (2019, 2025) · rent $1,651→$2,009/mo (+21.7%) · income $83,102→$105,013/yr (+26.4%). Gap = rent growth − income growth. |
Original ranks remain fixed when the table is sorted or filtered. Top 10 and Top 20 refer to the original ranking, not to a new ranking of filtered matches.
Four findings from the 2019–2025 comparison
Key Insight
Idaho ranks first with a +28.0 pp gap: its gross rent median increased 66.1%, versus 38.1% for household income. Its gap is 7.5 pp wider than Arizona's +20.6 pp in second place.
Notable Pattern
Rent growth exceeded income growth in 46 of 50 states (92%) on the point estimates. The median state gap is +10.0 pp; the separately calculated national gap is +12.9 pp.
Regional Differences
Every state in the South (16/16) and Midwest (12/12) has a positive gap: 28 of 28 combined. In the Northeast the count is 8/9; in the West, 10/13.
Outlier
Hawaii is last at -4.7 pp: median rent rose 21.7%, while household income rose 26.4%. Vermont is almost exactly balanced at -0.004 pp, so its sign should not be overinterpreted.
What the ranking does and does not mean
A high positive gap identifies a state where the median gross rent increased faster, in percentage terms, than median household income over these endpoints. It does not mean that renters in that state spend the largest share of income on housing, or that individual rents rose by the ranked percentage.
The rent median uses renter-occupied homes paying cash rent; the household-income median includes homeowners. Both are cross-sectional statistics, not measurements of the same families six years apart. Differences in household size, tenancy, geographic composition and utility costs can affect the two measures. Use ACS B25070 or B25106 for a direct housing-cost burden analysis rather than interpreting this growth gap as a rent-burden rate.
When comparing nearby ranks, consider sampling error and rounded displays. The Vermont near-tie, in particular, offers no robust claim that income actually outran rent in the underlying population. Neither regional grouping nor these numbers establishes why the gaps arose.
Frequently asked questions
Which state had the largest gap between rent growth and income growth from 2019 to 2025?
Idaho: +28.0 percentage points. Median monthly gross rent rose from $880 to $1,462 (+66.1%), while median annual household income rose from $60,999 to $84,234 (+38.1%).
What does a positive percentage-point gap mean?
It means the percentage increase in median gross rent exceeded the percentage increase in median household income between the two ACS survey years. It is not the percentage of income spent on rent.
Are the numbers actual 2025 estimates or a 2026 forecast?
They are ACS 2019 and 2025 observed survey estimates, with the 2025 ACS 1-year data released on October 29, 2026. The gaps are calculated values, not Census-published growth gaps or forecasts.
Does the comparison use income earned specifically by renters?
No. B19013 is the median for all households, homeowners included. This makes the gap a broad two-series comparison; it should not be used as a direct measure of renters' affordability or purchasing power.
Is gross rent the asking price of a newly advertised apartment?
No. B25064 covers median gross rent, including utilities, among renter-occupied cash-rent housing units. It includes existing tenancies and is not equivalent to a listing-rent index.
Are the 2019 and 2025 values inflation-adjusted to one year?
No. Both are expressed in each survey year's nominal dollars. The analysis compares percentage growth rates and does not estimate real increases in rent or income after inflation.
Why is Vermont shown with an almost-zero negative gap?
Its unrounded calculated gap is about -0.004 percentage points. Rounding each growth rate to one decimal would obscure the sign; the displayed figure preserves this near-tie. ACS sampling uncertainty is considerably more important than such a tiny point-estimate difference.
Why is Washington, D.C. excluded?
This is an all-50-state ranking. The District of Columbia and Puerto Rico are not states. The ranking does not substitute a city, metro, or territorial observation for a state.
Sources and verification
U.S. Census Bureau — ACS B25064, 2025
Role: numeric_source. Official median gross monthly rent (dollars), 2025 ACS 1-year table-based summary file. Values are published estimates, not modeled 2026 rents.
U.S. Census Bureau — ACS B19013, 2025
Role: numeric_source. Official median annual household income (dollars), 2025 ACS 1-year table-based summary file, all households.
U.S. Census Bureau — Household Income: 2019
Role: numeric_source. The official 2019 ACS state median household income and survey methodology (Table 1). This is one Census publishing organization with the 2025 numeric sources.
https://www.census.gov/content/dam/Census/library/publications/2020/acs/acsbr20-03.pdf
U.S. Census Bureau — ACS B25064, 2019
Role: numeric_source. Census detailed table for the 2019 median gross rent, in nominal 2019 dollars.
State of Hawaii DBEDT — Data Book 2021, Table 14.08
Role: validation_source. State-government reproduction of the Census 2019 gross-rent amounts for all states, used to cross-check 2019 state inputs. Not counted as a second independent numeric series.
https://files.hawaii.gov/dbedt/economic/databook/db2021/DB2021_final.pdf
Understand Idaho — ACS 2025 State Comparisons
Role: validation_source. Reproduced ACS 2025 B25064 and B19013 state tables, used to cross-check coverage, exact dollar values, and year labels. Both pages reproduce Census data; they are not independent numeric publishers.
https://understandidaho.com/housing/rent/
https://understandidaho.com/economy/median-household-income/
U.S. Census Bureau — 2025 ACS 1-Year Release
Role: methodology_source. The October 29, 2026 release, survey coverage and the distinction between 1-year and 5-year estimates.
https://www.census.gov/data/developers/data-sets/acs-1year.html
U.S. Census Bureau — ACS Methodology
Role: methodology_source. Survey definitions, sampling and interpretation.
https://www.census.gov/programs-surveys/acs/methodology.html
Related rankings
Closely related StatRanker ranking and data pages selected by topic, entity scope and category. Fewer links are shown when strong matches are limited.