

Median Gross Rent by U.S. State: 2024 Ranking of All 50 States
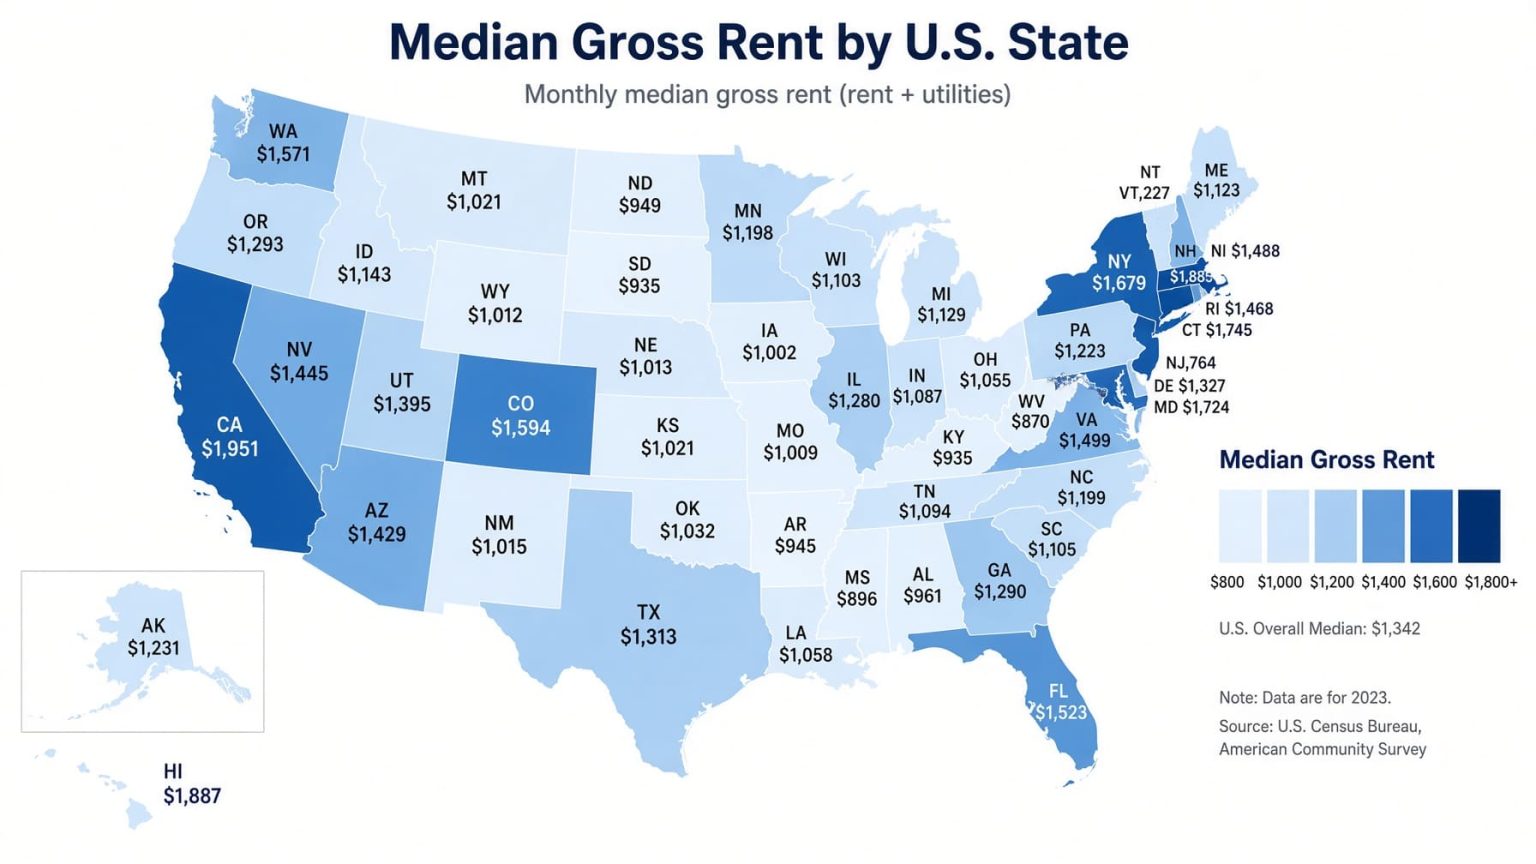
Median Gross Rent Across the 50 U.S. States in 2024
California leads at $2,104 per month, while West Virginia is lowest at $883. This ranking compares the U.S. Census Bureau's 2024 American Community Survey (ACS) 1-Year estimate of median gross rent, Table B25064, for all 50 states. Gross rent covers monthly contract rent plus utilities and fuels paid separately by renters. Higher dollar estimates rank higher.
Snapshot: 2024 ACS 1-Year Detailed Tables. Coverage: all 50 states, excluding Washington, D.C., and Puerto Rico. Unit: nominal U.S. dollars per month. Source mode: one official numeric publisher, the U.S. Census Bureau. Value status: 50 official_value estimates; zero projected or row-level calculated values. StatRanker ranks and summary calculations are derived from those published estimates. Source retrieval: October 11, 2026.
California, rank 1. ACS 2024 1-Year; published 90% margin of error ±$9.
West Virginia, rank 50. ACS 2024 1-Year; published 90% margin of error ±$19.
50 official_value estimates, all for 2024. District of Columbia is discussed separately.
Official nationwide ACS median. It is not the arithmetic average or median of the 50 state medians.
Overview: What the 2024 Rent Ranking Actually Measures
The median is the middle of the gross-rent distribution for renter-occupied housing units paying cash rent in each state. It is not the mean of advertised apartment listings, a rent quote for a particular bedroom count, or the rent paid by every household. Median gross rent includes monthly utility and fuel costs where renters pay those costs separately, making it broader than contract rent alone.
The official U.S. median is $1,487. Eighteen states have published state medians above that benchmark; 32 are below. Separately, the unweighted median of the 50 state-level estimates is $1,305. Those two numbers answer different questions: one summarizes renter-occupied units nationally; the other treats every state equally regardless of its renter population.
Washington, D.C., is not a state and is excluded from these 50 positions. Its separately published 2024 estimate is $1,931 ±$43, which would appear between Hawaii and Massachusetts in a 51-jurisdiction ordering. Puerto Rico and the national figure are also excluded from the state ranking.
Top 10 States by Median Gross Rent in 2024
Six of the ten highest published state medians occur in the Census West region, compared with two in the Northeast and two in the South. The figures below are monthly gross rent estimates, not current asking rents; the margin of error alongside each estimate helps interpret close comparisons.
Top 10 of 50 states · 2024 ACS 1-Year B25064 · U.S. dollars per month
| Rank | State | Median gross rent | Region / source note |
|---|---|---|---|
| 1 | California | $2,104 | West; Census ACS 1-Year B25064, 2024; official_value; 90% MOE ±$9. |
| 2 | Hawaii | $1,942 | West; Census ACS 1-Year B25064, 2024; official_value; 90% MOE ±$36. |
| 3 | Massachusetts | $1,848 | Northeast; Census ACS 1-Year B25064, 2024; official_value; 90% MOE ±$24. |
| 4 | Washington | $1,824 | West; Census ACS 1-Year B25064, 2024; official_value; 90% MOE ±$14. |
| 5 | Colorado | $1,822 | West; Census ACS 1-Year B25064, 2024; official_value; 90% MOE ±$15. |
| 6 | Florida | $1,812 | South; Census ACS 1-Year B25064, 2024; official_value; 90% MOE ±$9. |
| 7 | New Jersey | $1,800 | Northeast; Census ACS 1-Year B25064, 2024; official_value; 90% MOE ±$15. |
| 8 | Maryland | $1,721 | South; Census ACS 1-Year B25064, 2024; official_value; 90% MOE ±$14. |
| 9 | Nevada | $1,709 | West; Census ACS 1-Year B25064, 2024; official_value; 90% MOE ±$16. |
| 10 | Arizona | $1,672 | West; Census ACS 1-Year B25064, 2024; official_value; 90% MOE ±$19. |
90% MOE means the Census-published 90% margin of error, not a fee added to monthly rent. The state rank reflects the published point estimate; it is not a statistical significance result.
Chart: Top 20 States by Monthly Gross Rent
Each bar uses the same dollar estimate as the 50-state table. California is the 100% reference bar; all other bar widths equal their state's 2024 ACS median gross rent divided by California's $2,104, multiplied by 100. The figures at right are monthly dollars, not percentages.
Methodology and Data Reliability
Official metric and source
U.S. Census Bureau, 2024 ACS 1-Year Detailed Table B25064, Median Gross Rent (Dollars). Source file variable B25064_E001 supplies the official estimate; B25064_M001 supplies its published 90% margin of error. The universe is renter-occupied housing units paying cash rent.
Year, coverage and order
Every ranked row is a 2024 one-year estimate. Fifty state GEO_ID records beginning 0400000US are included; the separate District of Columbia and Puerto Rico records are excluded. Rank is descending by unrounded source value as published (integer U.S. dollars).
Ties, rounding and status
The source publishes whole-dollar estimates. Identical estimates share competition rank: Kentucky and Wyoming both show $998 and rank 44; rank 45 is skipped, so 50 rows remain. All 50 state estimates have status official_value. The ordering, percentages, differences and regional summaries are StatRanker calculations, not new Census-published statistics.
Geography and uncertainty
Northeast (9 states), Midwest (12), South (16) and West (13) follow Census region definitions. The official 90% margins of error accompany every state estimate. When two values are close, their numerical order should not be presented as proof of a statistically significant difference.
Reproducible calculations
State ranking: order the 50 values of B25064_E001 from largest to smallest; rank = 1 + number of states with a strictly higher published value. National benchmark comparison: count states where B25064_E001 exceeds the separately published national estimate ($1,487). Regional median: sort the state medians in a Census region and take the center value (or average the two center values for an even state count), with one equal weight per state. State-median median: average the 25th and 26th sorted values across 50 states: ($1,291 + $1,319) / 2 = $1,305. These are calculations from observed official estimates, not projections.
Spread and chart: highest minus lowest = $2,104 − $883 = $1,221 per month; ratio = $2,104 / $883 = 2.38 after rounding. Chart width = state B25064_E001 / $2,104 × 100%, rounded to one decimal. No population or household weights are applied to region or state-median summaries, and the official national median is never derived by averaging the state medians.
Inclusion and quality rules: only 2024 ACS 1-Year B25064 state records with published estimates and 90% MOEs are used. No 2024 ACS 5-Year figures, other years, rent-index models, contract-rent series, forecasts, cities or metro areas are mixed into the ranked rows. There are no missing or stale included rows and no competing numeric publishers to reconcile. Both the official Census table and its original table-based summary file provide a reproducible audit path, but count as one independent numeric publisher.
Limitations: ACS estimates are sampled and have uncertainty and nonsampling limitations; medians do not describe the range of unit sizes or the burden relative to income. The Census Bureau also raised the maximum accepted monthly contract-rent amount from $10,000 to $20,000 for 2024 processing, which warrants care when comparing high-rent areas with pre-2024 years. This page does not estimate a year-on-year change, inflation-adjusted rent, a 2026 rental level or a housing affordability score. Data retrieved October 11, 2026.
Full Ranking: Median Gross Rent in All 50 States
Search by state, filter by Census region and value status, sort the existing entries, or show the first 10, first 20 or all 50 states. Rank always refers to the complete 2024 state comparison; a filter does not create a new rank.
Official ACS 2024 1-Year state estimates · USD/month · descending rank · source code B25064_E001
| Rank | State | Median gross rent | Region / source note |
|---|---|---|---|
| 1 | California | $2,104 | West; Census ACS 1-Year B25064, 2024; official_value; 90% MOE ±$9. |
| 2 | Hawaii | $1,942 | West; Census ACS 1-Year B25064, 2024; official_value; 90% MOE ±$36. |
| 3 | Massachusetts | $1,848 | Northeast; Census ACS 1-Year B25064, 2024; official_value; 90% MOE ±$24. |
| 4 | Washington | $1,824 | West; Census ACS 1-Year B25064, 2024; official_value; 90% MOE ±$14. |
| 5 | Colorado | $1,822 | West; Census ACS 1-Year B25064, 2024; official_value; 90% MOE ±$15. |
| 6 | Florida | $1,812 | South; Census ACS 1-Year B25064, 2024; official_value; 90% MOE ±$9. |
| 7 | New Jersey | $1,800 | Northeast; Census ACS 1-Year B25064, 2024; official_value; 90% MOE ±$15. |
| 8 | Maryland | $1,721 | South; Census ACS 1-Year B25064, 2024; official_value; 90% MOE ±$14. |
| 9 | Nevada | $1,709 | West; Census ACS 1-Year B25064, 2024; official_value; 90% MOE ±$16. |
| 10 | Arizona | $1,672 | West; Census ACS 1-Year B25064, 2024; official_value; 90% MOE ±$19. |
| 11 | Virginia | $1,646 | South; Census ACS 1-Year B25064, 2024; official_value; 90% MOE ±$16. |
| 12 | New York | $1,634 | Northeast; Census ACS 1-Year B25064, 2024; official_value; 90% MOE ±$11. |
| 13 | Oregon | $1,597 | West; Census ACS 1-Year B25064, 2024; official_value; 90% MOE ±$17. |
| 14 | Utah | $1,593 | West; Census ACS 1-Year B25064, 2024; official_value; 90% MOE ±$27. |
| 15 | New Hampshire | $1,558 | Northeast; Census ACS 1-Year B25064, 2024; official_value; 90% MOE ±$46. |
| 16 | Connecticut | $1,550 | Northeast; Census ACS 1-Year B25064, 2024; official_value; 90% MOE ±$24. |
| 17 | Delaware | $1,530 | South; Census ACS 1-Year B25064, 2024; official_value; 90% MOE ±$47. |
| 18 | Georgia | $1,506 | South; Census ACS 1-Year B25064, 2024; official_value; 90% MOE ±$18. |
| 19 | Texas | $1,475 | South; Census ACS 1-Year B25064, 2024; official_value; 90% MOE ±$8. |
| 20 | Alaska | $1,444 | West; Census ACS 1-Year B25064, 2024; official_value; 90% MOE ±$48. |
| 21 | Rhode Island | $1,418 | Northeast; Census ACS 1-Year B25064, 2024; official_value; 90% MOE ±$46. |
| 22 | Idaho | $1,384 | West; Census ACS 1-Year B25064, 2024; official_value; 90% MOE ±$29. |
| 23 | North Carolina | $1,338 | South; Census ACS 1-Year B25064, 2024; official_value; 90% MOE ±$14. |
| 24 | Illinois | $1,322 | Midwest; Census ACS 1-Year B25064, 2024; official_value; 90% MOE ±$12. |
| 25 | Vermont | $1,319 | Northeast; Census ACS 1-Year B25064, 2024; official_value; 90% MOE ±$54. |
| 26 | Minnesota | $1,291 | Midwest; Census ACS 1-Year B25064, 2024; official_value; 90% MOE ±$17. |
| 27 | Tennessee | $1,284 | South; Census ACS 1-Year B25064, 2024; official_value; 90% MOE ±$16. |
| 28 | South Carolina | $1,272 | South; Census ACS 1-Year B25064, 2024; official_value; 90% MOE ±$28. |
| 29 | Pennsylvania | $1,252 | Northeast; Census ACS 1-Year B25064, 2024; official_value; 90% MOE ±$12. |
| 30 | Maine | $1,210 | Northeast; Census ACS 1-Year B25064, 2024; official_value; 90% MOE ±$30. |
| 31 | Montana | $1,177 | West; Census ACS 1-Year B25064, 2024; official_value; 90% MOE ±$42. |
| 32 | Michigan | $1,168 | Midwest; Census ACS 1-Year B25064, 2024; official_value; 90% MOE ±$11. |
| 33 | Wisconsin | $1,142 | Midwest; Census ACS 1-Year B25064, 2024; official_value; 90% MOE ±$10. |
| 34 | New Mexico | $1,117 | West; Census ACS 1-Year B25064, 2024; official_value; 90% MOE ±$25. |
| 35 | Indiana | $1,104 | Midwest; Census ACS 1-Year B25064, 2024; official_value; 90% MOE ±$11. |
| 36 | Nebraska | $1,102 | Midwest; Census ACS 1-Year B25064, 2024; official_value; 90% MOE ±$17. |
| 37 | Ohio | $1,090 | Midwest; Census ACS 1-Year B25064, 2024; official_value; 90% MOE ±$9. |
| 38 | Kansas | $1,079 | Midwest; Census ACS 1-Year B25064, 2024; official_value; 90% MOE ±$18. |
| 39 | Alabama | $1,077 | South; Census ACS 1-Year B25064, 2024; official_value; 90% MOE ±$16. |
| 40 | Missouri | $1,067 | Midwest; Census ACS 1-Year B25064, 2024; official_value; 90% MOE ±$14. |
| 41 | Louisiana | $1,064 | South; Census ACS 1-Year B25064, 2024; official_value; 90% MOE ±$15. |
| 42 | Oklahoma | $1,044 | South; Census ACS 1-Year B25064, 2024; official_value; 90% MOE ±$10. |
| 43 | South Dakota | $999 | Midwest; Census ACS 1-Year B25064, 2024; official_value; 90% MOE ±$31. |
| 44 | Kentucky | $998 | South; Census ACS 1-Year B25064, 2024; official_value; 90% MOE ±$19. |
| 44 | Wyoming | $998 | West; Census ACS 1-Year B25064, 2024; official_value; 90% MOE ±$38. |
| 46 | Mississippi | $990 | South; Census ACS 1-Year B25064, 2024; official_value; 90% MOE ±$15. |
| 47 | Arkansas | $982 | South; Census ACS 1-Year B25064, 2024; official_value; 90% MOE ±$13. |
| 48 | Iowa | $981 | Midwest; Census ACS 1-Year B25064, 2024; official_value; 90% MOE ±$15. |
| 49 | North Dakota | $980 | Midwest; Census ACS 1-Year B25064, 2024; official_value; 90% MOE ±$30. |
| 50 | West Virginia | $883 | South; Census ACS 1-Year B25064, 2024; official_value; 90% MOE ±$19. |
No states match the selected filters. Try another state name, region, status, or display limit.
All rows: value_status = official_value; numeric publisher = U.S. Census Bureau; survey and target year = ACS 2024 1-Year; measure = dollars per month; published 90% MOE appears in the last column. The duplicate rank 44 is intentional for two equal $998 estimates.
Four Findings Beyond the State Order
Key Insight: Overall Range
The gap between California (rank 1, $2,104) and West Virginia (rank 50, $883) is $1,221 per month. The first estimate is 2.38 times the last. Both are official ACS point estimates, not advertised rents.
Notable Pattern: Two Different Medians
18 of 50 states are above the official U.S. median of $1,487; 32 are below. The separate, unweighted median across the 50 published state medians is $1,305, which is $182 lower. The national median and median-of-state-medians use different units of aggregation.
Regional Concentration
The West supplies 6 of the Top 10 states (60%) but contains only 13 of all 50 states (26%). Its unweighted regional state-median is $1,597, versus $1,096 in the 12-state Midwest, a $501 gap. None of the Midwest states exceeds the U.S. median.
Outlier and Rank Precision
California is $162 above Hawaii ($2,104 versus $1,942). Elsewhere, Washington is only $2 above Colorado ($1,824 versus $1,822), compared with published 90% MOEs of ±$14 and ±$15. That close point-estimate order is not by itself evidence of a statistically meaningful difference.
What the Ranking Means for Renters and Researchers
A high rank means a higher median monthly rent-and-utilities estimate among existing renter-occupied units paying cash rent; it does not show what a newly available apartment will list for today. The figures are statewide, so local neighborhoods, metro areas, unit sizes and housing types can differ substantially from the statewide middle value.
A low state median should not be called more affordable without local income data. Rent burden requires a different numerator-and-denominator measure, such as ACS B25070, and is intentionally not inferred from these rent levels. The national $1,487 figure likewise cannot be reconstructed as an unweighted average of state medians.
The row-level 90% margins of error distinguish a published estimate from an exact administrative rent register. Especially when ranked values differ by only a few dollars, interpret positions as the order of reported estimates rather than proof that one state's true median must exceed another's.
Frequently Asked Questions
What is the highest median gross rent state in ACS 2024?
California is rank 1 with $2,104 per month in the 2024 ACS 1-Year B25064 estimate (90% MOE ±$9). Hawaii is second at $1,942 (±$36).
What is the lowest median gross rent state in 2024?
West Virginia is rank 50 at $883 per month (90% MOE ±$19), followed by North Dakota at $980 and Iowa at $981.
Does median gross rent include utilities?
Yes. The ACS gross-rent definition adds estimated average monthly utility and fuel costs to contract rent when those costs are paid separately by the renter. It is not the same measure as median contract rent (B25058).
Is this the ACS 2024 1-Year or 5-Year series?
This ranking uses the ACS 2024 1-Year Detailed Table B25064 for all 50 states. It does not mix 2020–2024 five-year estimates into the 2024 one-year series, because the two products represent different reference periods and estimation methods.
Why is Washington, D.C., not in the Top 50?
The title specifies states, not states plus the federal district. The separately published D.C. 2024 median is $1,931 (90% MOE ±$43), which would sit between Hawaii ($1,942) and Massachusetts ($1,848) if included. Its omission preserves exactly 50 state rows.
Why are Kentucky and Wyoming both rank 44?
The official published estimate for each is exactly $998 per month. The ranking uses competition ranks for equal published dollar values, so both occupy rank 44 and the next rank is 46. This is a ranking tie, not a claim their population medians are identical.
Why does the U.S. figure differ from the median across 50 states?
The published U.S. value of $1,487 summarizes renter-occupied housing units nationally. The $1,305 figure is StatRanker's unweighted median across 50 state-level medians, one value per state: ($1,291 + $1,319) / 2. They use different underlying units and are not interchangeable.
Does rank 4 Washington conclusively have higher rent than rank 5 Colorado?
No. The published estimates are $1,824 and $1,822, respectively; the gap is $2, while their 90% margins of error are ±$14 and ±$15. The point-estimate ranking alone does not establish a statistically significant difference.
Can these figures be projected to 2026 or directly compared with 2023?
No projection is performed here. The values are for the 2024 ACS only. Year-to-year comparisons require the relevant official year and uncertainty analysis; the Census Bureau's 2024 processing increase in the upper contract-rent limit also matters for some high-rent areas.
Sources and Verification Trail
All 50 numeric rows originate from a single independent publishing organization, the U.S. Census Bureau. Separate Bureau resources document the measure, geography, processing and uncertainty; they are not counted as independent numeric publishers.
U.S. Census Bureau: ACS 2024 Table-Based Summary File
Role: numeric_source. Original B25064 1-Year data file; rows identified by state GEO_ID and fields B25064_E001 (estimate) and B25064_M001 (90% MOE). Also includes the official U.S. reference value $1,487.
Census Data: ACS 2024 B25064
Role: validation_source. Census display table for the same 2024 one-year rent measure, its universe, geography and margins of error. Same organization as the numeric source.
Census API Variable B25064_001E
Role: methodology_source. Published label and meaning of the median gross rent estimate field in the 2024 ACS 1-Year series; field naming corresponds to B25064_E001 in the table-based summary file.
https://api.census.gov/data/2024/acs/acs1/variables/B25064_001E.html
Census Survey Explorer: Regions and Divisions
Role: methodology_source. Official membership of the Northeast, Midwest, South and West used for row filtering and region-based calculations.
https://www.census.gov/data/data-tools/survey-explorer/geo.html
ACS Sample Size and Data Quality Definitions
Role: methodology_source. Explains survey sampling uncertainty and the Census Bureau's 90% margins of error; does not supply ranking values.
2024 ACS Contract-Rent Processing Change
Role: context_source. Census Bureau note documenting the upper contract-rent reporting limit change and why comparisons with pre-2024 high-rent estimates require care. Not used to supply state values.
https://www.census.gov/programs-surveys/acs/technical-documentation/user-notes/2025-06.html
Related rankings
Closely related StatRanker ranking and data pages selected by topic, entity scope and category. Fewer links are shown when strong matches are limited.
