

Which U.S. States Have the Most Volatile Tax Revenue? (2019–2025)
Fiscal years 2019–2025 · Updated October 31, 2026
Alaska had the widest swings in state tax collections
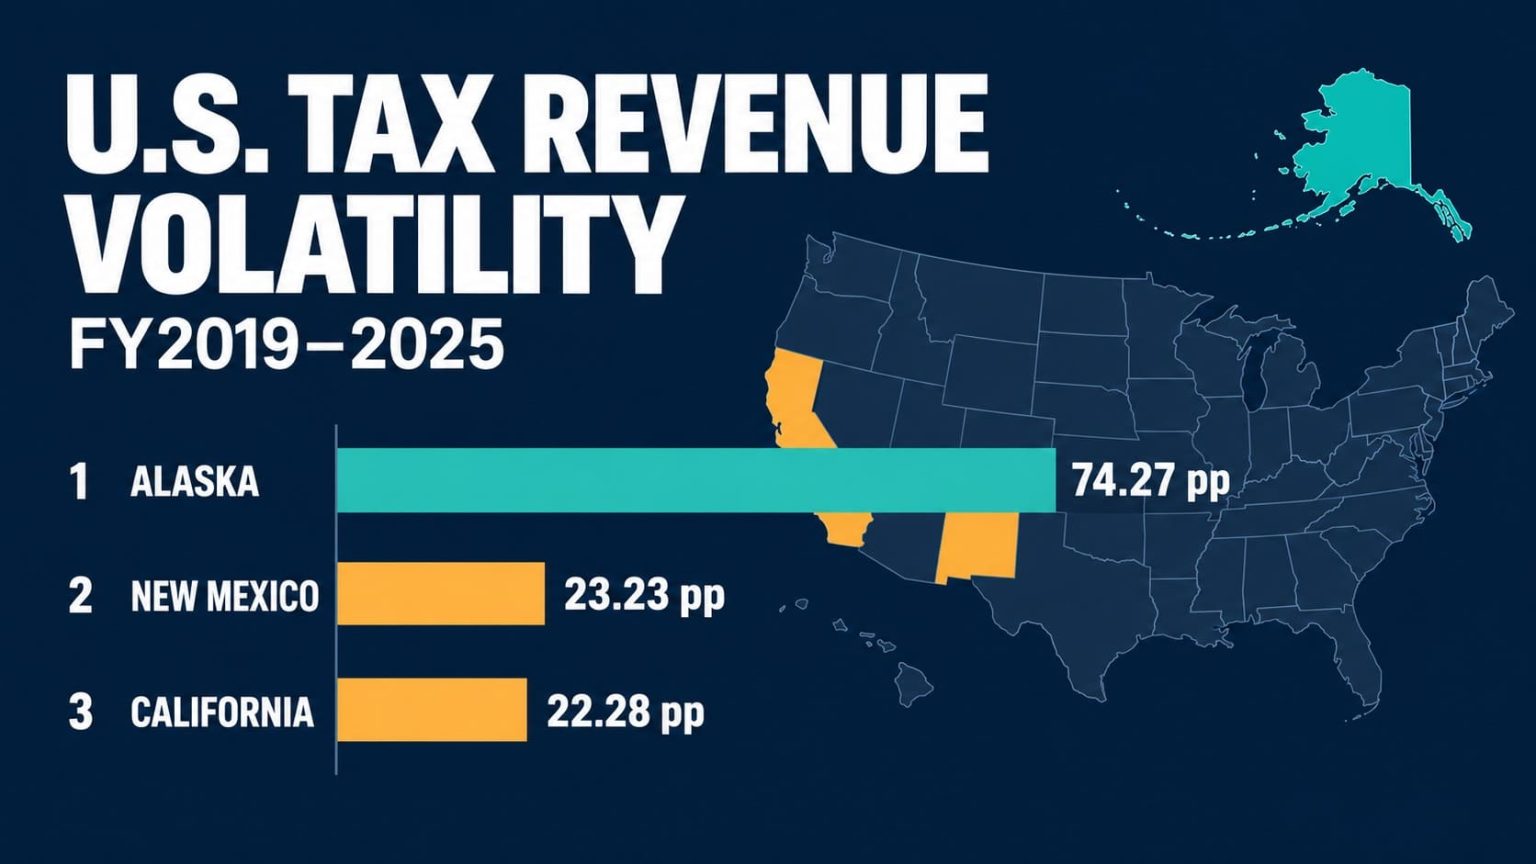
Alaska, New Mexico and California recorded the most volatile tax revenue in this 50-state comparison. The ranking measures the population standard deviation of six annual growth rates using seven years of nominal state-government tax collections from the U.S. Census Bureau, FY2019–2025. Scores are in percentage points: higher means larger fluctuations in annual growth.
Research retrieved October 31, 2026. FY2025 is the latest annual collection year in the Census dataset. StatRanker calculated all 50 volatility scores from observed Census data; Census does not publish these scores. The source covers state-government taxes. Largest-tax shares use FY2025 collections.
Highest volatility
74.27 ppAlaska · Rank 1
FY2020–2025 annual growth rates
Lowest volatility
3.18 ppWisconsin · Rank 50
FY2020–2025 annual growth rates
Median state
8.09 ppUnweighted median of 50 scores
StatRanker calculation
Coverage
50 states350 annual totals · FY2019–2025
Census inputs · 50 calculated scores
Revenue instability and tax dependence measure different things
Alaska’s score is 3.20 times New Mexico’s. Its annual collections fell 21.22% in FY2021 and rose 179.22% in FY2022. California’s score reflects a different sequence: growth of 47.31% in FY2021, a decline of 23.04% in FY2023 and a rebound of 21.98% in FY2024. The calculation does not separate economic changes from tax-policy changes or shifts in payment timing.
A state can depend heavily on one tax category without having unusually volatile total revenue. In FY2025, general sales and gross receipts supplied 61.56% of South Dakota’s taxes and 59.40% of Washington’s. Both states appear among the three least volatile in this window. Oregon, where individual income taxes supplied 63.70%, ranks sixth.
The three states whose largest FY2025 category was severance taxes—Alaska, New Mexico and North Dakota—all rank in the top five. Their FY2025 tax mix does not establish which taxes drove changes in earlier years.
Nominal tax collections declined in 35 states in FY2020, one in FY2022 and 10 in FY2025. The unweighted mean score is 10.73 pp, above the 8.09 pp median. Volatility calculated from the combined collections of the same 50 states is 8.66 pp. This aggregate gives larger states more influence than the unweighted mean does.
Top 10 states by tax revenue volatility
All scores and shares are StatRanker calculations from Census STC data. Each tax share is the largest of the 25 detailed Census categories in FY2025 divided by that state’s total taxes. pp = percentage points.
| Rank | State | Volatility | Largest tax, FY2025 |
|---|---|---|---|
| 1 | Alaska | 74.27 pp | Severance: 43.92% |
| 2 | New Mexico | 23.23 pp | Severance: 31.19% |
| 3 | California | 22.28 pp | Individual income: 46.79% |
| 4 | Nevada | 20.74 pp | General sales and gross receipts: 52.45% |
| 5 | North Dakota | 17.21 pp | Severance: 47.19% |
| 6 | Oregon | 17.21 pp | Individual income: 63.70% |
| 7 | New York | 16.81 pp | Individual income: 46.62% |
| 8 | Utah | 16.61 pp | Individual income: 42.84% |
| 9 | Wyoming | 16.06 pp | General sales and gross receipts: 38.66% |
| 10 | Colorado | 14.36 pp | Individual income: 43.51% |
Top 20: Alaska stands apart
Volatility in percentage points. Linear scale starts at zero and ends at Alaska’s unrounded score, 74.274129 pp. Labels show two decimals. This chart stays fixed when the ranking table is filtered.
How the ranking was calculated
Seven totals, six annual changes
For each state, T is Census STC total taxes, aggregate STC001, in $1,000. We use FY2019 through FY2025 inclusive. FY2019 supplies the starting denominator. The first growth rate is FY2020 versus FY2019.
Mean growth = Σgt / 6
Volatility = √[Σ(gt − mean growth)² / 6]
t = FY2020, …, FY2025
The divisor is six because the score describes the complete selected window. Sample standard deviation would multiply every score by √(6/5), leaving ranks unchanged. We use nominal collections without inflation or tax-policy adjustments.
Dependence on the largest tax category
We select the largest reported FY2025 amount among 25 detailed, non-overlapping Census tax codes. Broad subtotals are excluded so the same revenue is not counted twice.
“General sales and gross receipts” includes more than a single statutory tax. The share describes one year’s collection mix. It is not a seven-year average and does not identify how much that category contributed to volatility.
Coverage, dates and source roles
This compiled research dataset was extracted from the Census Bureau’s GOVSSTATETAXTIMESERIES package, which covers 2016–2025. It combines seven annual totals for each of 50 states with FY2025 detailed tax categories. It has one independent publishing organization: the U.S. Census Bureau. We exclude D.C., territories and the U.S. aggregate from the state ranking and its mean and median. All 350 required annual totals are present and positive. Retrieval date: October 31, 2026.
Separate Census tables and flat files validate overlapping inputs; they are publications from the same organization, not independent numeric sources. The Census methodology defines scope and fiscal years, and its region map supplies the four geographic groups. If a transcribed or derived figure conflicts with a Census-published amount for the same scope and year, the published Census amount takes precedence; values are never averaged. Pew supplies context and a comparison of methods only.
Quality checks and limits
We reconciled all 50 state totals with separate Census workbooks for FY2019–2022 and FY2025. For FY2023–2025, each detailed tax category’s state sum matches the published U.S. total. The 25 FY2025 category amounts also reconcile to each state’s total.
No missing annual totals were filled, older years substituted or conflicting values averaged. Non-applicable category flags are excluded when identifying the largest tax. Census may revise or impute its published inputs. Our scores and shares are calculated from those inputs; Census does not publish these volatility rankings.
Ranks use unrounded scores, descending. Displayed scores and shares are rounded to two decimals, so visually equal values can have different ranks. State means and medians are unweighted. The national aggregate score is calculated from summed collections before computing growth and standard deviation. All calculations describe historical observations and contain no forecast assumptions.
Inputs for the 50-state aggregate
We sum the same 50 states separately for each fiscal year, excluding D.C. throughout. In the downloaded time-series file, the published U.S. total includes D.C. in FY2019–FY2022 and excludes it in FY2023–FY2025. We therefore use the sums of the individual states rather than joining those U.S. totals.
Combined state taxes, $1,000: FY2019: 1,084,772,676; FY2020: 1,060,362,882; FY2021: 1,266,754,688; FY2022: 1,472,265,920; FY2023: 1,423,479,536; FY2024: 1,472,039,413; FY2025: 1,535,843,715.
Applying the six-growth-rate formula above gives 8.655527473 percentage points, displayed as 8.66 pp. This is a StatRanker calculation from Census STC inputs, separate from the average state score.
Fiscal years generally end June 30. Alabama and Michigan end September 30, New York March 31, and Texas August 31. Local taxes, federal transfers and other non-tax revenue are outside the measure. This is not a ranking of household tax burdens, general-fund revenue, fiscal solvency or revenue predictability after policy changes.
Full ranking: all 50 U.S. states
Open a state’s calculation note to see its seven annual tax totals and the numerator and denominator behind its FY2025 largest-tax share. The national ranks remain fixed when you change the display order.
Showing 50 of 50 states.
| Rank | State | Volatility | Region / note |
|---|---|---|---|
| 1 | Alaska | 74.27 pp | West Severance: 43.92% of FY2025 taxes. StatRanker calculation · Census STC · FY2019–2025 Inputs and calculationTotal taxes, $1,000: 2019: 1,780,911; 2020: 1,337,059; 2021: 1,053,400; 2022: 2,941,280; 2023: 2,794,075; 2024: 1,985,846; 2025: 1,686,939. Score is calculated from these totals using the six-growth-rate method above. Figures are nominal and are not adjusted for policy changes. FY2025 largest category: T53 = 740,920; total = 1,686,939 ($1,000). Share = category / total × 100. |
| 2 | New Mexico | 23.23 pp | West Severance: 31.19% of FY2025 taxes. StatRanker calculation · Census STC · FY2019–2025 Inputs and calculationTotal taxes, $1,000: 2019: 7,427,622; 2020: 7,194,016; 2021: 7,487,814; 2022: 12,290,409; 2023: 14,436,205; 2024: 14,223,723; 2025: 14,938,479. Score is calculated from these totals using the six-growth-rate method above. Figures are nominal and are not adjusted for policy changes. FY2025 largest category: T53 = 4,659,195; total = 14,938,479 ($1,000). Share = category / total × 100. |
| 3 | California | 22.28 pp | West Individual income: 46.79% of FY2025 taxes. StatRanker calculation · Census STC · FY2019–2025 Inputs and calculationTotal taxes, $1,000: 2019: 187,638,267; 2020: 172,977,355; 2021: 254,818,453; 2022: 282,894,652; 2023: 217,707,953; 2024: 265,550,679; 2025: 275,041,333. Score is calculated from these totals using the six-growth-rate method above. Figures are nominal and are not adjusted for policy changes. FY2025 largest category: T40 = 128,687,029; total = 275,041,333 ($1,000). Share = category / total × 100. |
| 4 | Nevada | 20.74 pp | West General sales and gross receipts: 52.45% of FY2025 taxes. StatRanker calculation · Census STC · FY2019–2025 Inputs and calculationTotal taxes, $1,000: 2019: 9,744,547; 2020: 9,452,840; 2021: 9,056,648; 2022: 13,974,437; 2023: 14,314,135; 2024: 15,026,720; 2025: 14,519,772. Score is calculated from these totals using the six-growth-rate method above. Figures are nominal and are not adjusted for policy changes. FY2025 largest category: T09 = 7,615,178; total = 14,519,772 ($1,000). Share = category / total × 100. |
| 5 | North Dakota | 17.21 pp | Midwest Severance: 47.19% of FY2025 taxes. StatRanker calculation · Census STC · FY2019–2025 Inputs and calculationTotal taxes, $1,000: 2019: 4,969,744; 2020: 4,336,232; 2021: 3,908,672; 2022: 5,350,784; 2023: 6,048,549; 2024: 5,847,708; 2025: 5,517,006. Score is calculated from these totals using the six-growth-rate method above. Figures are nominal and are not adjusted for policy changes. FY2025 largest category: T53 = 2,603,733; total = 5,517,006 ($1,000). Share = category / total × 100. |
| 6 | Oregon | 17.21 pp | West Individual income: 63.70% of FY2025 taxes. StatRanker calculation · Census STC · FY2019–2025 Inputs and calculationTotal taxes, $1,000: 2019: 14,184,891; 2020: 13,229,766; 2021: 17,741,902; 2022: 18,660,826; 2023: 20,749,483; 2024: 16,957,638; 2025: 20,522,201. Score is calculated from these totals using the six-growth-rate method above. Figures are nominal and are not adjusted for policy changes. FY2025 largest category: T40 = 13,072,992; total = 20,522,201 ($1,000). Share = category / total × 100. |
| 7 | New York | 16.81 pp | Northeast Individual income: 46.62% of FY2025 taxes. StatRanker calculation · Census STC · FY2019–2025 Inputs and calculationTotal taxes, $1,000: 2019: 85,368,973; 2020: 92,720,854; 2021: 91,821,961; 2022: 132,147,203; 2023: 125,459,496; 2024: 119,935,019; 2025: 131,284,169. Score is calculated from these totals using the six-growth-rate method above. Figures are nominal and are not adjusted for policy changes. FY2025 largest category: T40 = 61,201,732; total = 131,284,169 ($1,000). Share = category / total × 100. |
| 8 | Utah | 16.61 pp | West Individual income: 42.84% of FY2025 taxes. StatRanker calculation · Census STC · FY2019–2025 Inputs and calculationTotal taxes, $1,000: 2019: 9,918,773; 2020: 8,731,796; 2021: 12,347,773; 2022: 13,491,108; 2023: 13,485,420; 2024: 13,437,832; 2025: 14,133,061. Score is calculated from these totals using the six-growth-rate method above. Figures are nominal and are not adjusted for policy changes. FY2025 largest category: T40 = 6,054,453; total = 14,133,061 ($1,000). Share = category / total × 100. |
| 9 | Wyoming | 16.06 pp | West General sales and gross receipts: 38.66% of FY2025 taxes. StatRanker calculation · Census STC · FY2019–2025 Inputs and calculationTotal taxes, $1,000: 2019: 2,110,704; 2020: 1,963,896; 2021: 1,874,876; 2022: 2,441,007; 2023: 3,004,996; 2024: 2,639,728; 2025: 2,568,605. Score is calculated from these totals using the six-growth-rate method above. Figures are nominal and are not adjusted for policy changes. FY2025 largest category: T09 = 993,067; total = 2,568,605 ($1,000). Share = category / total × 100. |
| 10 | Colorado | 14.36 pp | West Individual income: 43.51% of FY2025 taxes. StatRanker calculation · Census STC · FY2019–2025 Inputs and calculationTotal taxes, $1,000: 2019: 15,869,834; 2020: 15,074,484; 2021: 19,250,711; 2022: 22,089,402; 2023: 18,131,705; 2024: 19,194,334; 2025: 20,261,443. Score is calculated from these totals using the six-growth-rate method above. Figures are nominal and are not adjusted for policy changes. FY2025 largest category: T40 = 8,815,538; total = 20,261,443 ($1,000). Share = category / total × 100. |
| 11 | Hawaii | 10.61 pp | West General sales and gross receipts: 44.92% of FY2025 taxes. StatRanker calculation · Census STC · FY2019–2025 Inputs and calculationTotal taxes, $1,000: 2019: 8,207,524; 2020: 7,707,502; 2021: 8,046,691; 2022: 10,279,504; 2023: 10,187,648; 2024: 10,574,059; 2025: 11,036,365. Score is calculated from these totals using the six-growth-rate method above. Figures are nominal and are not adjusted for policy changes. FY2025 largest category: T09 = 4,957,864; total = 11,036,365 ($1,000). Share = category / total × 100. |
| 12 | Michigan | 9.88 pp | Midwest General sales and gross receipts: 32.28% of FY2025 taxes. StatRanker calculation · Census STC · FY2019–2025 Inputs and calculationTotal taxes, $1,000: 2019: 30,270,130; 2020: 27,960,375; 2021: 34,431,625; 2022: 38,545,971; 2023: 38,254,379; 2024: 38,611,735; 2025: 40,805,907. Score is calculated from these totals using the six-growth-rate method above. Figures are nominal and are not adjusted for policy changes. FY2025 largest category: T09 = 13,171,810; total = 40,805,907 ($1,000). Share = category / total × 100. |
| 13 | Georgia | 9.60 pp | South Individual income: 47.26% of FY2025 taxes. StatRanker calculation · Census STC · FY2019–2025 Inputs and calculationTotal taxes, $1,000: 2019: 24,723,046; 2020: 23,760,988; 2021: 27,850,996; 2022: 33,801,938; 2023: 33,818,735; 2024: 33,644,287; 2025: 34,358,826. Score is calculated from these totals using the six-growth-rate method above. Figures are nominal and are not adjusted for policy changes. FY2025 largest category: T40 = 16,236,377; total = 34,358,826 ($1,000). Share = category / total × 100. |
| 14 | Montana | 9.47 pp | West Individual income: 47.69% of FY2025 taxes. StatRanker calculation · Census STC · FY2019–2025 Inputs and calculationTotal taxes, $1,000: 2019: 3,168,557; 2020: 3,168,411; 2021: 3,880,366; 2022: 4,638,060; 2023: 4,704,607; 2024: 4,717,017; 2025: 4,836,766. Score is calculated from these totals using the six-growth-rate method above. Figures are nominal and are not adjusted for policy changes. FY2025 largest category: T40 = 2,306,589; total = 4,836,766 ($1,000). Share = category / total × 100. |
| 15 | Nebraska | 9.30 pp | Midwest General sales and gross receipts: 41.87% of FY2025 taxes. StatRanker calculation · Census STC · FY2019–2025 Inputs and calculationTotal taxes, $1,000: 2019: 5,754,834; 2020: 5,857,227; 2021: 6,960,988; 2022: 7,475,982; 2023: 7,326,707; 2024: 8,119,665; 2025: 7,293,864. Score is calculated from these totals using the six-growth-rate method above. Figures are nominal and are not adjusted for policy changes. FY2025 largest category: T09 = 3,053,906; total = 7,293,864 ($1,000). Share = category / total × 100. |
| 16 | West Virginia | 9.26 pp | South Individual income: 31.02% of FY2025 taxes. StatRanker calculation · Census STC · FY2019–2025 Inputs and calculationTotal taxes, $1,000: 2019: 5,792,317; 2020: 5,434,302; 2021: 6,030,929; 2022: 7,049,102; 2023: 7,646,664; 2024: 6,996,733; 2025: 6,951,166. Score is calculated from these totals using the six-growth-rate method above. Figures are nominal and are not adjusted for policy changes. FY2025 largest category: T40 = 2,156,396; total = 6,951,166 ($1,000). Share = category / total × 100. |
| 17 | New Jersey | 9.07 pp | Northeast Individual income: 38.86% of FY2025 taxes. StatRanker calculation · Census STC · FY2019–2025 Inputs and calculationTotal taxes, $1,000: 2019: 38,449,650; 2020: 37,927,482; 2021: 43,683,029; 2022: 52,771,929; 2023: 50,726,388; 2024: 50,633,470; 2025: 54,065,138. Score is calculated from these totals using the six-growth-rate method above. Figures are nominal and are not adjusted for policy changes. FY2025 largest category: T40 = 21,007,331; total = 54,065,138 ($1,000). Share = category / total × 100. |
| 18 | Texas | 8.89 pp | South General sales and gross receipts: 62.82% of FY2025 taxes. StatRanker calculation · Census STC · FY2019–2025 Inputs and calculationTotal taxes, $1,000: 2019: 63,314,370; 2020: 61,496,546; 2021: 65,466,119; 2022: 81,654,478; 2023: 87,328,717; 2024: 87,365,012; 2025: 89,943,632. Score is calculated from these totals using the six-growth-rate method above. Figures are nominal and are not adjusted for policy changes. FY2025 largest category: T09 = 56,499,029; total = 89,943,632 ($1,000). Share = category / total × 100. |
| 19 | Missouri | 8.83 pp | Midwest Individual income: 43.23% of FY2025 taxes. StatRanker calculation · Census STC · FY2019–2025 Inputs and calculationTotal taxes, $1,000: 2019: 13,181,385; 2020: 12,409,761; 2021: 15,091,423; 2022: 16,913,231; 2023: 17,403,548; 2024: 17,789,696; 2025: 18,004,517. Score is calculated from these totals using the six-growth-rate method above. Figures are nominal and are not adjusted for policy changes. FY2025 largest category: T40 = 7,783,245; total = 18,004,517 ($1,000). Share = category / total × 100. |
| 20 | North Carolina | 8.72 pp | South Individual income: 42.07% of FY2025 taxes. StatRanker calculation · Census STC · FY2019–2025 Inputs and calculationTotal taxes, $1,000: 2019: 29,324,429; 2020: 28,307,011; 2021: 34,735,106; 2022: 38,605,027; 2023: 39,074,633; 2024: 39,170,317; 2025: 40,626,167. Score is calculated from these totals using the six-growth-rate method above. Figures are nominal and are not adjusted for policy changes. FY2025 largest category: T40 = 17,090,797; total = 40,626,167 ($1,000). Share = category / total × 100. |
| 21 | Pennsylvania | 8.63 pp | Northeast Individual income: 31.60% of FY2025 taxes. StatRanker calculation · Census STC · FY2019–2025 Inputs and calculationTotal taxes, $1,000: 2019: 43,132,450; 2020: 40,693,000; 2021: 49,634,346; 2022: 53,700,114; 2023: 55,074,459; 2024: 55,198,027; 2025: 56,545,523. Score is calculated from these totals using the six-growth-rate method above. Figures are nominal and are not adjusted for policy changes. FY2025 largest category: T40 = 17,868,796; total = 56,545,523 ($1,000). Share = category / total × 100. |
| 22 | Rhode Island | 8.40 pp | Northeast Individual income: 33.42% of FY2025 taxes. StatRanker calculation · Census STC · FY2019–2025 Inputs and calculationTotal taxes, $1,000: 2019: 3,612,575; 2020: 3,551,200; 2021: 4,371,625; 2022: 4,833,177; 2023: 5,312,973; 2024: 5,286,527; 2025: 5,470,824. Score is calculated from these totals using the six-growth-rate method above. Figures are nominal and are not adjusted for policy changes. FY2025 largest category: T40 = 1,828,456; total = 5,470,824 ($1,000). Share = category / total × 100. |
| 23 | Idaho | 8.30 pp | West General sales and gross receipts: 36.08% of FY2025 taxes. StatRanker calculation · Census STC · FY2019–2025 Inputs and calculationTotal taxes, $1,000: 2019: 4,902,173; 2020: 5,315,760; 2021: 6,472,467; 2022: 7,710,289; 2023: 7,600,174; 2024: 8,624,676; 2025: 8,881,206. Score is calculated from these totals using the six-growth-rate method above. Figures are nominal and are not adjusted for policy changes. FY2025 largest category: T09 = 3,204,313; total = 8,881,206 ($1,000). Share = category / total × 100. |
| 24 | Illinois | 8.24 pp | Midwest Individual income: 35.64% of FY2025 taxes. StatRanker calculation · Census STC · FY2019–2025 Inputs and calculationTotal taxes, $1,000: 2019: 45,453,840; 2020: 45,284,625; 2021: 55,531,962; 2022: 63,585,838; 2023: 68,053,072; 2024: 67,690,105; 2025: 71,309,239. Score is calculated from these totals using the six-growth-rate method above. Figures are nominal and are not adjusted for policy changes. FY2025 largest category: T40 = 25,413,800; total = 71,309,239 ($1,000). Share = category / total × 100. |
| 25 | Florida | 8.21 pp | South General sales and gross receipts: 62.93% of FY2025 taxes. StatRanker calculation · Census STC · FY2019–2025 Inputs and calculationTotal taxes, $1,000: 2019: 45,017,095; 2020: 43,314,743; 2021: 49,320,041; 2022: 59,251,311; 2023: 61,925,155; 2024: 63,087,887; 2025: 63,550,663. Score is calculated from these totals using the six-growth-rate method above. Figures are nominal and are not adjusted for policy changes. FY2025 largest category: T09 = 39,994,118; total = 63,550,663 ($1,000). Share = category / total × 100. |
| 26 | Massachusetts | 7.98 pp | Northeast Individual income: 53.03% of FY2025 taxes. StatRanker calculation · Census STC · FY2019–2025 Inputs and calculationTotal taxes, $1,000: 2019: 31,806,339; 2020: 31,631,567; 2021: 36,336,125; 2022: 43,083,974; 2023: 41,338,531; 2024: 43,080,972; 2025: 46,172,934. Score is calculated from these totals using the six-growth-rate method above. Figures are nominal and are not adjusted for policy changes. FY2025 largest category: T40 = 24,484,941; total = 46,172,934 ($1,000). Share = category / total × 100. |
| 27 | Kansas | 7.87 pp | Midwest Individual income: 35.64% of FY2025 taxes. StatRanker calculation · Census STC · FY2019–2025 Inputs and calculationTotal taxes, $1,000: 2019: 10,030,158; 2020: 9,659,846; 2021: 11,615,757; 2022: 12,592,576; 2023: 13,139,563; 2024: 13,067,651; 2025: 13,118,999. Score is calculated from these totals using the six-growth-rate method above. Figures are nominal and are not adjusted for policy changes. FY2025 largest category: T40 = 4,675,736; total = 13,118,999 ($1,000). Share = category / total × 100. |
| 28 | New Hampshire | 7.72 pp | Northeast Corporate net income: 32.94% of FY2025 taxes. StatRanker calculation · Census STC · FY2019–2025 Inputs and calculationTotal taxes, $1,000: 2019: 2,934,358; 2020: 2,807,111; 2021: 3,317,286; 2022: 3,510,760; 2023: 3,461,507; 2024: 3,496,616; 2025: 3,372,460. Score is calculated from these totals using the six-growth-rate method above. Figures are nominal and are not adjusted for policy changes. FY2025 largest category: T41 = 1,110,991; total = 3,372,460 ($1,000). Share = category / total × 100. |
| 29 | South Carolina | 7.72 pp | South General sales and gross receipts: 35.15% of FY2025 taxes. StatRanker calculation · Census STC · FY2019–2025 Inputs and calculationTotal taxes, $1,000: 2019: 11,221,043; 2020: 11,794,684; 2021: 13,392,479; 2022: 16,150,255; 2023: 15,649,277; 2024: 18,026,495; 2025: 19,243,335. Score is calculated from these totals using the six-growth-rate method above. Figures are nominal and are not adjusted for policy changes. FY2025 largest category: T09 = 6,764,152; total = 19,243,335 ($1,000). Share = category / total × 100. |
| 30 | Delaware | 7.71 pp | South Individual income: 39.64% of FY2025 taxes. StatRanker calculation · Census STC · FY2019–2025 Inputs and calculationTotal taxes, $1,000: 2019: 4,596,190; 2020: 4,555,474; 2021: 5,395,710; 2022: 6,310,891; 2023: 6,563,472; 2024: 6,534,362; 2025: 6,949,753. Score is calculated from these totals using the six-growth-rate method above. Figures are nominal and are not adjusted for policy changes. FY2025 largest category: T40 = 2,754,586; total = 6,949,753 ($1,000). Share = category / total × 100. |
| 31 | Arizona | 7.68 pp | West General sales and gross receipts: 50.71% of FY2025 taxes. StatRanker calculation · Census STC · FY2019–2025 Inputs and calculationTotal taxes, $1,000: 2019: 18,163,903; 2020: 17,640,435; 2021: 20,757,247; 2022: 24,173,733; 2023: 24,705,701; 2024: 25,102,313; 2025: 26,635,906. Score is calculated from these totals using the six-growth-rate method above. Figures are nominal and are not adjusted for policy changes. FY2025 largest category: T09 = 13,506,130; total = 26,635,906 ($1,000). Share = category / total × 100. |
| 32 | Minnesota | 7.66 pp | Midwest Individual income: 37.84% of FY2025 taxes. StatRanker calculation · Census STC · FY2019–2025 Inputs and calculationTotal taxes, $1,000: 2019: 28,175,795; 2020: 26,790,884; 2021: 31,793,412; 2022: 34,911,881; 2023: 34,473,185; 2024: 35,666,980; 2025: 36,889,555. Score is calculated from these totals using the six-growth-rate method above. Figures are nominal and are not adjusted for policy changes. FY2025 largest category: T40 = 13,957,697; total = 36,889,555 ($1,000). Share = category / total × 100. |
| 33 | Connecticut | 7.60 pp | Northeast Individual income: 45.32% of FY2025 taxes. StatRanker calculation · Census STC · FY2019–2025 Inputs and calculationTotal taxes, $1,000: 2019: 19,131,944; 2020: 18,400,534; 2021: 22,066,648; 2022: 22,774,523; 2023: 22,527,037; 2024: 23,213,078; 2025: 24,753,804. Score is calculated from these totals using the six-growth-rate method above. Figures are nominal and are not adjusted for policy changes. FY2025 largest category: T40 = 11,219,590; total = 24,753,804 ($1,000). Share = category / total × 100. |
| 34 | Indiana | 7.59 pp | Midwest General sales and gross receipts: 40.93% of FY2025 taxes. StatRanker calculation · Census STC · FY2019–2025 Inputs and calculationTotal taxes, $1,000: 2019: 22,968,677; 2020: 22,374,096; 2021: 26,645,852; 2022: 25,691,130; 2023: 26,576,465; 2024: 26,463,321; 2025: 27,421,554. Score is calculated from these totals using the six-growth-rate method above. Figures are nominal and are not adjusted for policy changes. FY2025 largest category: T09 = 11,223,248; total = 27,421,554 ($1,000). Share = category / total × 100. |
| 35 | Oklahoma | 7.46 pp | South Individual income: 37.47% of FY2025 taxes. StatRanker calculation · Census STC · FY2019–2025 Inputs and calculationTotal taxes, $1,000: 2019: 10,787,693; 2020: 10,232,297; 2021: 11,299,244; 2022: 12,996,489; 2023: 13,647,881; 2024: 13,027,326; 2025: 13,044,419. Score is calculated from these totals using the six-growth-rate method above. Figures are nominal and are not adjusted for policy changes. FY2025 largest category: T40 = 4,887,199; total = 13,044,419 ($1,000). Share = category / total × 100. |
| 36 | Louisiana | 7.18 pp | South General sales and gross receipts: 33.50% of FY2025 taxes. StatRanker calculation · Census STC · FY2019–2025 Inputs and calculationTotal taxes, $1,000: 2019: 11,870,499; 2020: 11,495,966; 2021: 12,257,234; 2022: 14,484,028; 2023: 16,057,374; 2024: 16,451,301; 2025: 16,380,208. Score is calculated from these totals using the six-growth-rate method above. Figures are nominal and are not adjusted for policy changes. FY2025 largest category: T09 = 5,488,032; total = 16,380,208 ($1,000). Share = category / total × 100. |
| 37 | Vermont | 6.96 pp | Northeast Property taxes: 28.66% of FY2025 taxes. StatRanker calculation · Census STC · FY2019–2025 Inputs and calculationTotal taxes, $1,000: 2019: 3,493,747; 2020: 3,440,660; 2021: 4,102,929; 2022: 4,416,004; 2023: 4,498,680; 2024: 4,640,799; 2025: 5,205,872. Score is calculated from these totals using the six-growth-rate method above. Figures are nominal and are not adjusted for policy changes. FY2025 largest category: T01 = 1,491,794; total = 5,205,872 ($1,000). Share = category / total × 100. |
| 38 | Maine | 6.59 pp | Northeast Individual income: 39.46% of FY2025 taxes. StatRanker calculation · Census STC · FY2019–2025 Inputs and calculationTotal taxes, $1,000: 2019: 4,674,441; 2020: 4,851,219; 2021: 5,452,250; 2022: 6,462,166; 2023: 6,476,126; 2024: 6,509,073; 2025: 6,917,242. Score is calculated from these totals using the six-growth-rate method above. Figures are nominal and are not adjusted for policy changes. FY2025 largest category: T40 = 2,729,411; total = 6,917,242 ($1,000). Share = category / total × 100. |
| 39 | Tennessee | 6.51 pp | South General sales and gross receipts: 57.48% of FY2025 taxes. StatRanker calculation · Census STC · FY2019–2025 Inputs and calculationTotal taxes, $1,000: 2019: 16,450,938; 2020: 16,775,270; 2021: 19,977,968; 2022: 22,780,221; 2023: 23,776,144; 2024: 24,159,796; 2025: 25,573,839. Score is calculated from these totals using the six-growth-rate method above. Figures are nominal and are not adjusted for policy changes. FY2025 largest category: T09 = 14,700,852; total = 25,573,839 ($1,000). Share = category / total × 100. |
| 40 | Mississippi | 6.48 pp | South General sales and gross receipts: 49.41% of FY2025 taxes. StatRanker calculation · Census STC · FY2019–2025 Inputs and calculationTotal taxes, $1,000: 2019: 8,288,883; 2020: 8,099,990; 2021: 9,428,105; 2022: 10,182,769; 2023: 10,860,590; 2024: 10,602,589; 2025: 10,950,782. Score is calculated from these totals using the six-growth-rate method above. Figures are nominal and are not adjusted for policy changes. FY2025 largest category: T09 = 5,410,368; total = 10,950,782 ($1,000). Share = category / total × 100. |
| 41 | Virginia | 6.47 pp | South Individual income: 47.26% of FY2025 taxes. StatRanker calculation · Census STC · FY2019–2025 Inputs and calculationTotal taxes, $1,000: 2019: 27,076,451; 2020: 28,064,536; 2021: 32,328,105; 2022: 37,427,347; 2023: 37,018,190; 2024: 37,576,864; 2025: 40,256,178. Score is calculated from these totals using the six-growth-rate method above. Figures are nominal and are not adjusted for policy changes. FY2025 largest category: T40 = 19,026,734; total = 40,256,178 ($1,000). Share = category / total × 100. |
| 42 | Arkansas | 5.86 pp | South General sales and gross receipts: 40.90% of FY2025 taxes. StatRanker calculation · Census STC · FY2019–2025 Inputs and calculationTotal taxes, $1,000: 2019: 10,217,866; 2020: 10,255,155; 2021: 11,726,678; 2022: 12,768,129; 2023: 12,758,766; 2024: 12,674,290; 2025: 12,560,305. Score is calculated from these totals using the six-growth-rate method above. Figures are nominal and are not adjusted for policy changes. FY2025 largest category: T09 = 5,136,793; total = 12,560,305 ($1,000). Share = category / total × 100. |
| 43 | Iowa | 5.69 pp | Midwest General sales and gross receipts: 38.56% of FY2025 taxes. StatRanker calculation · Census STC · FY2019–2025 Inputs and calculationTotal taxes, $1,000: 2019: 10,583,869; 2020: 10,661,437; 2021: 11,816,502; 2022: 12,908,955; 2023: 12,950,402; 2024: 12,741,980; 2025: 12,120,559. Score is calculated from these totals using the six-growth-rate method above. Figures are nominal and are not adjusted for policy changes. FY2025 largest category: T09 = 4,673,814; total = 12,120,559 ($1,000). Share = category / total × 100. |
| 44 | Alabama | 5.56 pp | South Individual income: 32.82% of FY2025 taxes. StatRanker calculation · Census STC · FY2019–2025 Inputs and calculationTotal taxes, $1,000: 2019: 11,782,220; 2020: 12,413,368; 2021: 14,251,329; 2022: 16,335,547; 2023: 16,497,098; 2024: 16,870,308; 2025: 17,673,064. Score is calculated from these totals using the six-growth-rate method above. Figures are nominal and are not adjusted for policy changes. FY2025 largest category: T40 = 5,799,729; total = 17,673,064 ($1,000). Share = category / total × 100. |
| 45 | Ohio | 5.53 pp | Midwest General sales and gross receipts: 42.55% of FY2025 taxes. StatRanker calculation · Census STC · FY2019–2025 Inputs and calculationTotal taxes, $1,000: 2019: 30,739,230; 2020: 30,604,964; 2021: 34,909,388; 2022: 37,388,627; 2023: 38,728,351; 2024: 37,466,367; 2025: 38,844,122. Score is calculated from these totals using the six-growth-rate method above. Figures are nominal and are not adjusted for policy changes. FY2025 largest category: T09 = 16,529,684; total = 38,844,122 ($1,000). Share = category / total × 100. |
| 46 | Maryland | 5.19 pp | South Individual income: 35.55% of FY2025 taxes. StatRanker calculation · Census STC · FY2019–2025 Inputs and calculationTotal taxes, $1,000: 2019: 23,605,971; 2020: 23,890,161; 2021: 25,220,541; 2022: 29,361,278; 2023: 29,590,039; 2024: 30,911,703; 2025: 32,921,289. Score is calculated from these totals using the six-growth-rate method above. Figures are nominal and are not adjusted for policy changes. FY2025 largest category: T40 = 11,704,521; total = 32,921,289 ($1,000). Share = category / total × 100. |
| 47 | Kentucky | 4.79 pp | South General sales and gross receipts: 33.58% of FY2025 taxes. StatRanker calculation · Census STC · FY2019–2025 Inputs and calculationTotal taxes, $1,000: 2019: 13,049,436; 2020: 13,353,640; 2021: 14,626,499; 2022: 16,546,544; 2023: 17,217,084; 2024: 17,253,994; 2025: 17,336,567. Score is calculated from these totals using the six-growth-rate method above. Figures are nominal and are not adjusted for policy changes. FY2025 largest category: T09 = 5,821,340; total = 17,336,567 ($1,000). Share = category / total × 100. |
| 48 | South Dakota | 4.77 pp | Midwest General sales and gross receipts: 61.56% of FY2025 taxes. StatRanker calculation · Census STC · FY2019–2025 Inputs and calculationTotal taxes, $1,000: 2019: 1,940,415; 2020: 2,018,423; 2021: 2,149,543; 2022: 2,475,394; 2023: 2,629,090; 2024: 2,678,432; 2025: 2,687,143. Score is calculated from these totals using the six-growth-rate method above. Figures are nominal and are not adjusted for policy changes. FY2025 largest category: T09 = 1,654,301; total = 2,687,143 ($1,000). Share = category / total × 100. |
| 49 | Washington | 4.48 pp | West General sales and gross receipts: 59.40% of FY2025 taxes. StatRanker calculation · Census STC · FY2019–2025 Inputs and calculationTotal taxes, $1,000: 2019: 27,992,437; 2020: 29,173,046; 2021: 32,717,084; 2022: 36,071,826; 2023: 38,025,420; 2024: 37,342,055; 2025: 39,361,742. Score is calculated from these totals using the six-growth-rate method above. Figures are nominal and are not adjusted for policy changes. FY2025 largest category: T09 = 23,381,238; total = 39,361,742 ($1,000). Share = category / total × 100. |
| 50 | Wisconsin | 3.18 pp | Midwest Individual income: 40.39% of FY2025 taxes. StatRanker calculation · Census STC · FY2019–2025 Inputs and calculationTotal taxes, $1,000: 2019: 19,871,532; 2020: 20,170,888; 2021: 22,300,850; 2022: 23,363,814; 2023: 23,743,687; 2024: 24,172,308; 2025: 25,299,273. Score is calculated from these totals using the six-growth-rate method above. Figures are nominal and are not adjusted for policy changes. FY2025 largest category: T40 = 10,219,016; total = 25,299,273 ($1,000). Share = category / total × 100. |
No states match these filters.
Four findings from the state comparison
Key Insight
Alaska’s 74.27 pp score exceeds New Mexico’s 23.23 pp by 51.05 pp. Its largest annual increase was 179.22% in FY2022, when collections rose from $1.053 billion to $2.941 billion.
Notable Pattern
Nine states collected more than half their FY2025 taxes from one detailed category. Four exceeded 60%: Oregon, Florida, Texas and South Dakota. Their volatility ranks range from 6 to 48, showing that a large single-category share does not determine the total-revenue ranking.
Regional Concentration
Eight of the 10 most volatile states are in the West. The region represents 80% of the top 10 and 26% of the full 50-state dataset. The other top-10 states are North Dakota in the Midwest and New York in the Northeast.
Outlier
Washington ranks 49th at 4.48 pp despite receiving 59.40% of FY2025 taxes from general sales and gross receipts. Oregon ranks sixth at 17.21 pp with a 63.70% individual-income-tax share. Similar concentration levels can accompany very different historical volatility.
What the ranking means for state budgets
A high score means annual growth varied widely around its own average. It does not mean collections declined every year or that a state lacks reserves. A state with consistently negative growth could have a low score, while a state with strong but uneven growth could have a high one.
Read the volatility score alongside the annual totals and the current tax mix. The largest-tax share identifies concentration in FY2025. Establishing which tax caused an earlier swing would require a year-by-year contribution analysis, including offsets between categories, policy changes and filing deadlines.
Pew’s Fiscal 50 analysis also uses variation in annual revenue growth, but its April 2026 publication evaluates five- and 15-year windows ending in FY2024 and removes estimated state tax-policy effects. The scores here use a different window and retain those effects. They should not be treated as updates to Pew’s scores.
Questions about state tax revenue volatility
Which state had the most volatile tax revenue in 2019–2025?
Alaska ranks first at 74.27 percentage points, followed by New Mexico at 23.23 and California at 22.28. These scores use the population standard deviation of annual nominal tax growth within the specified period.
Why are there six growth rates for seven years of data?
Seven annual totals produce six consecutive comparisons. FY2019 is the baseline, followed by growth rates for FY2020 versus FY2019 through FY2025 versus FY2024. Including FY2019 growth would require FY2018 data and a different window.
Are these official Census volatility scores?
No. Census publishes the collection amounts. StatRanker calculates the volatility scores and largest-tax shares from those official inputs. Every ranking row is marked as a StatRanker calculation.
Does the ranking include FY2026 tax receipts?
No. The latest annual collection year used here is FY2025. Census released those STC results in April 2026, including revisions to FY2023 and FY2024.
How is dependence on a single tax measured?
We divide the largest detailed Census tax category in FY2025 by the state’s FY2025 total taxes. This is a category concentration measure. Some categories, particularly general sales and gross receipts, combine multiple tax instruments.
Sources and their roles
One numeric publisher: U.S. Census Bureau. Validation files from the same publisher check extraction and reconciliation rather than provide independent confirmation.
Census STC time-series package
Role: numeric_source. GOVSSTATETAXTIMESERIES.dat and its field definitions. FY2019–2025 total taxes, plus FY2025 detailed categories. Amounts are in thousands of dollars. Purpose: all ranking and concentration inputs.
https://www2.census.gov/programs-surveys/stc/data/api_dataset/GOVSSTATETAXTIMESERIES.zipCensus annual table files
Role: validation_source. Separate workbooks for FY2019–2022 and FY2025 validated all 50 state totals for those years. Purpose: check the time-series extraction against published tables. The comparison uses individual states, excluding D.C.
FY2019 detailed workbookFY2020 detailed workbook
FY2021 detailed workbook
FY2022 detailed workbook
FY2025 detailed workbook
Census detailed flat files
Role: validation_source. FY2023, FY2024 and FY2025 files. Purpose: reconcile detailed state categories to U.S. totals and FY2025 state totals.
FY2023 detailed fileFY2024 detailed file
FY2025 detailed file
Census STC methodology
Role: methodology_source. FY2025 survey coverage, tax treatment, fiscal-year dates, revisions and data-quality limits. Purpose: define what the official collection amounts cover.
https://www2.census.gov/programs-surveys/stc/technical-documentation/methodology/2025stcmethodology.pdfCensus regions and divisions
Role: methodology_source. Official four-region classification. Purpose: assign states to the Northeast, Midwest, South and West for the filter and regional comparison.
https://www2.census.gov/geo/pdfs/maps-data/maps/reference/us_regdiv.pdfPew Fiscal 50
Role: context_source. April 9, 2026 analysis of tax revenue volatility. Purpose: explain the distinction between observed collections and policy-adjusted volatility. None of its published scores are used in this ranking.
https://www.pew.org/en/research-and-analysis/articles/2026/04/09/state-tax-revenue-volatility-remains-high-as-long-term-trends-moderate/