

Homeowners Insurance Premiums Relative to Income by State (2022)
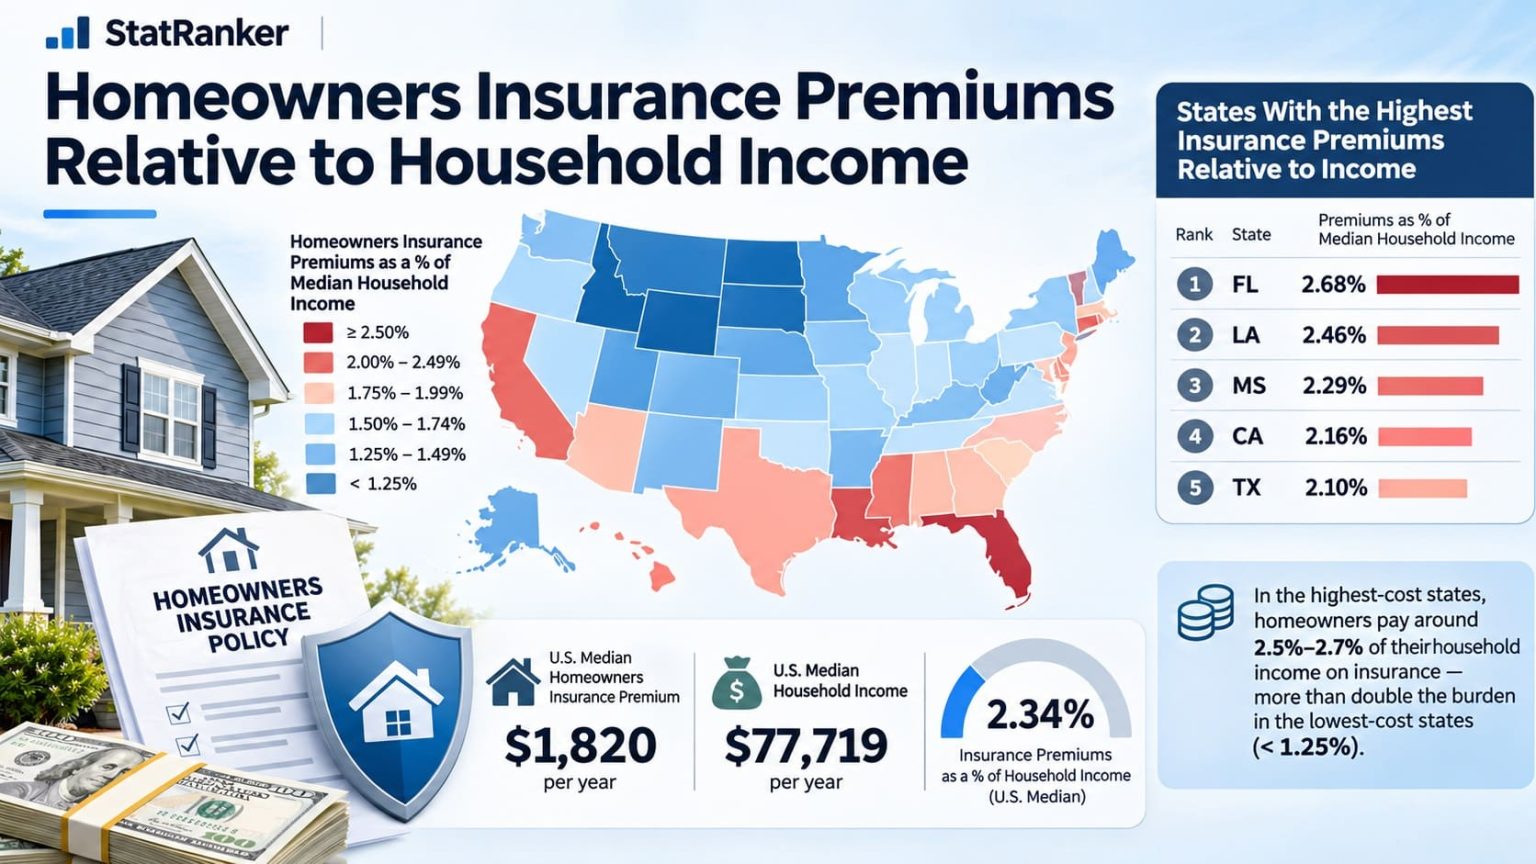
Louisiana had the highest 2022 HO-3 premium relative to median income
Louisiana's average annual HO-3 premium was $2,603 in 2022. Divided by the state's $55,416 median household income, it equaled 4.70%—the highest of 50 states. Utah ranked last at 1.05% ($937 against $89,168). Florida had the most expensive HO-3 policy in dollar terms ($2,677), but ranked second after income was included (3.86%).
This is a 2022 historical comparison, not a 2026 insurance price estimate. NAIC supplied the premium figures, and the U.S. Census Bureau supplied 2022 ACS 1-year household incomes. Higher ratios rank higher. The 50-state table excludes Washington, D.C. and territories; it was checked on November 7, 2026. All 50 ratios are calculated_value, not source-published percentages or forecasts.
The table is a compiled research dataset based on 2 independent publishing organizations, with row-level source and method notes shown in the ranking table. The ratios are calculated from observed inputs, not an official forecast/projection.
$2,603 HO-3 premium; $55,416 median household income.
$937 HO-3 premium; $89,168 median household income.
50 calculated_value percentages from NAIC and Census 2022 inputs.
Unweighted mean: 2.09%. Both are calculations from 50 state ratios, not a U.S.-wide household estimate.
How the income comparison changes the state ranking
States with comparatively expensive HO-3 policies do not necessarily have the highest premium-to-income ratios. The examples below show how the 50-state order changes once median household income becomes the denominator. The complete ratio ranking appears farther down the page.
Selected shifts from premium-only rank to premium-to-income rank
| State | Premium-only rank | Premium / income rank | Change |
|---|---|---|---|
| Arkansas | #14 | #6 | 8 places higher |
| Colorado | #5 | #15 | 10 places lower |
| Connecticut | #10 | #23 | 13 places lower |
| Kentucky | #28 | #17 | 11 places higher |
| Massachusetts | #8 | #26 | 18 places lower |
| West Virginia | #39 | #24 | 15 places higher |
Both rankings above are calculated over the same 50 states using 2022 data. The premium-only order is calculated from NAIC values; NAIC does not publish these comparative ranks. "Higher" means closer to rank 1 by ratio, not an improvement in affordability.
Why the figures differ from the Insurance Research Council
The Insurance Research Council (IRC) also compares insurance spending with median household income, but its 2022 benchmark uses a broader mix of dwelling-fire and owner-occupied homeowners policy forms. This ranking uses HO-3 alone. For 2022, IRC reported Louisiana at 4.22% and Utah at 1.00%; the HO-3-only results here are 4.70% and 1.05%. These are different insurance measures, not conflicting versions of the same figure.
Top 10 states by HO-3 premium-to-income ratio
The top states are sorted by the unrounded annual HO-3 premium divided by state median household income. These are 2022 calculations, not NAIC-published affordability rankings.
| Rank | State | Premium / income | Source / method note |
|---|---|---|---|
| 1 | Louisiana | 4.70% | 2022 NAIC HO-3: $2,603; 2022 Census ACS median income: $55,416. Calculated value = premium / income x 100. |
| 2 | Florida | 3.86% | 2022 NAIC HO-3: $2,677; 2022 Census ACS median income: $69,303. Calculated value = premium / income x 100. |
| 3 | Oklahoma | 3.80% | 2022 NAIC HO-3: $2,268; 2022 Census ACS median income: $59,673. Calculated value = premium / income x 100. |
| 4 | Mississippi | 3.62% | 2022 NAIC HO-3: $1,907; 2022 Census ACS median income: $52,719. Calculated value = premium / income x 100. |
| 5 | Texas | 3.32% | 2022 NAIC HO-3: $2,397; 2022 Census ACS median income: $72,284. Calculated value = premium / income x 100. |
| 6 | Arkansas | 3.14% | 2022 NAIC HO-3: $1,740; 2022 Census ACS median income: $55,432. Calculated value = premium / income x 100. |
| 7 | Alabama | 2.93% | 2022 NAIC HO-3: $1,748; 2022 Census ACS median income: $59,674. Calculated value = premium / income x 100. |
| 8 | Nebraska | 2.69% | 2022 NAIC HO-3: $1,869; 2022 Census ACS median income: $69,597. Calculated value = premium / income x 100. |
| 9 | Missouri | 2.57% | 2022 NAIC HO-3: $1,668; 2022 Census ACS median income: $64,811. Calculated value = premium / income x 100. |
| 10 | Rhode Island | 2.53% | 2022 NAIC HO-3: $2,074; 2022 Census ACS median income: $81,854. Calculated value = premium / income x 100. |
Chart: 20 highest ratios in 2022
Louisiana leads at 4.70%; the 20th-ranked state, Georgia, is at 2.27%—less than half Louisiana's ratio. Each bar uses the same unrounded percentage as the ranking table and is scaled against Louisiana, not against a 50-state total.
NAIC and Census published the 2022 inputs. StatRanker calculated the percentages and scaled the bars from those values.
Methodology: annual HO-3 premium divided by median household income
The measure and formula
Ratio (%) = 2022 average HO-3 premium (USD per insured house-year) / 2022 ACS median annual household income (USD) x 100. Larger ratios rank first. Each result is a StatRanker calculated_value; NAIC and Census publish the separate inputs, not this state-level index.
NAIC premium figures
NAIC's 2022 Homeowners Report (released May 21, 2025) supplies average premiums for HO-3 owner-occupied policies. An average is total written premium divided by insured house-years. NAIC includes certain state funds, residual markets and wind pools; premiums differ with insured value, deductibles and coverage.
Census income figures
The U.S. Census Bureau's Household Income in States and Metropolitan Areas: 2022, Table 1, supplies 2022 ACS 1-year median household incomes in 2022 dollars. The denominator describes all resident households, including renters, rather than the specific households holding HO-3 coverage. ACS income estimates also have sampling uncertainty.
Year, scope and status
All 50 states have confirmed 2022 premium and income inputs. Washington, D.C., Puerto Rico and other territories were excluded throughout; no state-level imputations or future-year projections were made. The retrieval and verification date is November 7, 2026. The rankings contain 50 calculated_value rows and zero official_forecast or modeled_projection rows.
Verification and source priority
NAIC and Census are the two independent numeric publishers. The Insurance Information Institute reproduces the NAIC premium table for cross-checking, but is not a separate underlying dataset. Published NAIC premiums and Census medians take precedence over secondary reproductions; inputs were not averaged across publishers. Census definitions determine the four regional groups.
Rounding, derived rankings and limits
Ratios, regional medians and changes in rank were computed from the unrounded premium/income results. Percentages are displayed to two decimal places; region medians are unweighted across states, and premium-only ranks sort the 50 published whole-dollar premiums (alphabetical tie-break where necessary). The ratio cannot measure actual policyholder spending as a share of personal income, insurance availability, risk-adjusted prices or current premiums.
The unweighted mean across the 50 state ratios rounds to 2.09%. IRC also reports 2.09% for the 2022 national affordability index, but IRC aggregates a broader policy set and uses a national measure. The numerical match after rounding does not make the two statistics equivalent.
Main ranking: All 50 states
Search by state or filter by Census region. Sort by percentage or name, or narrow the table to its original Top 10 or Top 20. The source column shows the premium and income used in every calculation.
| Rank | State | Premium / income | Source / method note |
|---|---|---|---|
| 1 | Louisiana | 4.70% | 2022 NAIC HO-3: $2,603; 2022 Census ACS median income: $55,416. Calculated value = premium / income x 100. |
| 2 | Florida | 3.86% | 2022 NAIC HO-3: $2,677; 2022 Census ACS median income: $69,303. Calculated value = premium / income x 100. |
| 3 | Oklahoma | 3.80% | 2022 NAIC HO-3: $2,268; 2022 Census ACS median income: $59,673. Calculated value = premium / income x 100. |
| 4 | Mississippi | 3.62% | 2022 NAIC HO-3: $1,907; 2022 Census ACS median income: $52,719. Calculated value = premium / income x 100. |
| 5 | Texas | 3.32% | 2022 NAIC HO-3: $2,397; 2022 Census ACS median income: $72,284. Calculated value = premium / income x 100. |
| 6 | Arkansas | 3.14% | 2022 NAIC HO-3: $1,740; 2022 Census ACS median income: $55,432. Calculated value = premium / income x 100. |
| 7 | Alabama | 2.93% | 2022 NAIC HO-3: $1,748; 2022 Census ACS median income: $59,674. Calculated value = premium / income x 100. |
| 8 | Nebraska | 2.69% | 2022 NAIC HO-3: $1,869; 2022 Census ACS median income: $69,597. Calculated value = premium / income x 100. |
| 9 | Missouri | 2.57% | 2022 NAIC HO-3: $1,668; 2022 Census ACS median income: $64,811. Calculated value = premium / income x 100. |
| 10 | Rhode Island | 2.53% | 2022 NAIC HO-3: $2,074; 2022 Census ACS median income: $81,854. Calculated value = premium / income x 100. |
| 11 | South Dakota | 2.52% | 2022 NAIC HO-3: $1,756; 2022 Census ACS median income: $69,728. Calculated value = premium / income x 100. |
| 12 | South Carolina | 2.45% | 2022 NAIC HO-3: $1,571; 2022 Census ACS median income: $64,115. Calculated value = premium / income x 100. |
| 13 | Montana | 2.42% | 2022 NAIC HO-3: $1,639; 2022 Census ACS median income: $67,631. Calculated value = premium / income x 100. |
| 14 | North Carolina | 2.40% | 2022 NAIC HO-3: $1,621; 2022 Census ACS median income: $67,481. Calculated value = premium / income x 100. |
| 15 | Colorado | 2.33% | 2022 NAIC HO-3: $2,079; 2022 Census ACS median income: $89,302. Calculated value = premium / income x 100. |
| 16 | Kansas | 2.30% | 2022 NAIC HO-3: $1,583; 2022 Census ACS median income: $68,925. Calculated value = premium / income x 100. |
| 17 | Kentucky | 2.29% | 2022 NAIC HO-3: $1,359; 2022 Census ACS median income: $59,341. Calculated value = premium / income x 100. |
| 18 | Tennessee | 2.29% | 2022 NAIC HO-3: $1,492; 2022 Census ACS median income: $65,254. Calculated value = premium / income x 100. |
| 19 | Wyoming | 2.28% | 2022 NAIC HO-3: $1,596; 2022 Census ACS median income: $70,042. Calculated value = premium / income x 100. |
| 20 | Georgia | 2.27% | 2022 NAIC HO-3: $1,655; 2022 Census ACS median income: $72,837. Calculated value = premium / income x 100. |
| 21 | New Mexico | 2.21% | 2022 NAIC HO-3: $1,322; 2022 Census ACS median income: $59,726. Calculated value = premium / income x 100. |
| 22 | Minnesota | 2.15% | 2022 NAIC HO-3: $1,774; 2022 Census ACS median income: $82,338. Calculated value = premium / income x 100. |
| 23 | Connecticut | 2.05% | 2022 NAIC HO-3: $1,814; 2022 Census ACS median income: $88,429. Calculated value = premium / income x 100. |
| 24 | West Virginia | 2.05% | 2022 NAIC HO-3: $1,113; 2022 Census ACS median income: $54,329. Calculated value = premium / income x 100. |
| 25 | New York | 2.05% | 2022 NAIC HO-3: $1,628; 2022 Census ACS median income: $79,557. Calculated value = premium / income x 100. |
| 26 | Massachusetts | 1.98% | 2022 NAIC HO-3: $1,871; 2022 Census ACS median income: $94,488. Calculated value = premium / income x 100. |
| 27 | North Dakota | 1.84% | 2022 NAIC HO-3: $1,325; 2022 Census ACS median income: $71,970. Calculated value = premium / income x 100. |
| 28 | Iowa | 1.82% | 2022 NAIC HO-3: $1,268; 2022 Census ACS median income: $69,588. Calculated value = premium / income x 100. |
| 29 | Indiana | 1.78% | 2022 NAIC HO-3: $1,191; 2022 Census ACS median income: $66,785. Calculated value = premium / income x 100. |
| 30 | Illinois | 1.75% | 2022 NAIC HO-3: $1,343; 2022 Census ACS median income: $76,708. Calculated value = premium / income x 100. |
| 31 | California | 1.63% | 2022 NAIC HO-3: $1,492; 2022 Census ACS median income: $91,551. Calculated value = premium / income x 100. |
| 32 | Michigan | 1.58% | 2022 NAIC HO-3: $1,056; 2022 Census ACS median income: $66,986. Calculated value = premium / income x 100. |
| 33 | Pennsylvania | 1.56% | 2022 NAIC HO-3: $1,120; 2022 Census ACS median income: $71,798. Calculated value = premium / income x 100. |
| 34 | Virginia | 1.55% | 2022 NAIC HO-3: $1,332; 2022 Census ACS median income: $85,873. Calculated value = premium / income x 100. |
| 35 | Maine | 1.55% | 2022 NAIC HO-3: $1,077; 2022 Census ACS median income: $69,543. Calculated value = premium / income x 100. |
| 36 | Hawaii | 1.55% | 2022 NAIC HO-3: $1,431; 2022 Census ACS median income: $92,458. Calculated value = premium / income x 100. |
| 37 | Ohio | 1.51% | 2022 NAIC HO-3: $995; 2022 Census ACS median income: $65,720. Calculated value = premium / income x 100. |
| 38 | Vermont | 1.50% | 2022 NAIC HO-3: $1,109; 2022 Census ACS median income: $73,991. Calculated value = premium / income x 100. |
| 39 | New Jersey | 1.47% | 2022 NAIC HO-3: $1,417; 2022 Census ACS median income: $96,346. Calculated value = premium / income x 100. |
| 40 | Maryland | 1.47% | 2022 NAIC HO-3: $1,392; 2022 Census ACS median income: $94,991. Calculated value = premium / income x 100. |
| 41 | Idaho | 1.38% | 2022 NAIC HO-3: $1,002; 2022 Census ACS median income: $72,785. Calculated value = premium / income x 100. |
| 42 | Arizona | 1.37% | 2022 NAIC HO-3: $1,018; 2022 Census ACS median income: $74,568. Calculated value = premium / income x 100. |
| 43 | Wisconsin | 1.35% | 2022 NAIC HO-3: $957; 2022 Census ACS median income: $70,996. Calculated value = premium / income x 100. |
| 44 | Delaware | 1.34% | 2022 NAIC HO-3: $1,103; 2022 Census ACS median income: $82,174. Calculated value = premium / income x 100. |
| 45 | New Hampshire | 1.32% | 2022 NAIC HO-3: $1,188; 2022 Census ACS median income: $89,992. Calculated value = premium / income x 100. |
| 46 | Nevada | 1.31% | 2022 NAIC HO-3: $948; 2022 Census ACS median income: $72,333. Calculated value = premium / income x 100. |
| 47 | Alaska | 1.28% | 2022 NAIC HO-3: $1,129; 2022 Census ACS median income: $88,121. Calculated value = premium / income x 100. |
| 48 | Washington | 1.26% | 2022 NAIC HO-3: $1,151; 2022 Census ACS median income: $91,306. Calculated value = premium / income x 100. |
| 49 | Oregon | 1.18% | 2022 NAIC HO-3: $893; 2022 Census ACS median income: $75,657. Calculated value = premium / income x 100. |
| 50 | Utah | 1.05% | 2022 NAIC HO-3: $937; 2022 Census ACS median income: $89,168. Calculated value = premium / income x 100. |
All 50 values were calculated from NAIC and Census 2022 inputs. Ranks use unrounded ratios; visible percentages are rounded to two decimal places.
What stands out in the 2022 state data
Key Insight
Income changes the Top 10. Only 7 of the 10 states with the highest HO-3 premiums remain in the Top 10 by premium-to-income ratio. Colorado drops from #5 to #15, Connecticut from #10 to #23, and Massachusetts from #8 to #26.
Notable Pattern
Six states clear 3%. Louisiana (4.70%), Florida (3.86%), Oklahoma (3.80%), Mississippi (3.62%), Texas (3.32%) and Arkansas (3.14%) all exceed that level. The midpoint of all 50 state ratios is 2.01%.
Regional Concentration
Seven of the Top 10 states are in the South. The 16 Southern states have a median ratio of 2.43%, compared with 1.38% among the 13 Western states—a 1.05-percentage-point gap based on unrounded inputs. This describes a regional pattern, not its cause.
Outlier
The biggest rank shifts run in opposite directions. Massachusetts moves from #8 by premium to #26 by ratio, 18 places lower. West Virginia moves from #39 by premium to #24 by ratio, 15 places higher. Both shifts are calculated within the same 50-state sample.
How to interpret this comparison
A state's position can change substantially once household income enters the calculation. That makes this ranking a useful screening measure for comparing statewide insurance cost with statewide earnings, rather than a list of the cheapest policies.
It is not a measured household budget share: the premium reflects insured HO-3 homes, while the income median includes all households. States also differ in dwelling values, coverage, deductibles and local risk. To judge the cost of a particular home, compare quotes for the same coverage and property characteristics; to study affordability for a population, use income and insurance data for the same households and locations. These 2022 figures cannot establish today's prices or explain why any state ranks where it does.
Frequently asked questions
Why does Louisiana rank above Florida in 2022?
Florida's average HO-3 premium was $2,677, $74 more than Louisiana's $2,603. But Louisiana's median household income was $55,416 versus $69,303 in Florida. As a result, Louisiana ranks first on the calculated ratio (4.70%) and Florida second (3.86%).
What is the difference between HO-3 and IRC's affordability measure?
This table uses only NAIC's HO-3 homeowner package policy. The Insurance Research Council combines dwelling-fire and several owner-occupied homeowners policy forms. Its state affordability figures therefore use a different premium numerator, even for the same year.
Does an HO-3 premium include separate flood or earthquake insurance?
No. Standard homeowners policies generally exclude flood and earthquake coverage, which usually requires separate insurance. The NAIC state figures may include some supplementary wind-pool coverage; coverage and deductibles still vary across homes.
How was the calculated percentage obtained?
For Mississippi, the 2022 NAIC average HO-3 premium was $1,907 and the Census median household income was $52,719. Dividing $1,907 by $52,719 and multiplying by 100 produces 3.62% after rounding. This is a calculated_value, not an official NAIC affordability score.
Are the incomes specific to insured homeowners?
No. ACS median household income includes renters and owners, while the HO-3 premium covers insured owner-occupied properties. The ratio compares state-level series, not spending and income collected from matching families.
Are these actual 2026 premiums or projected 2026 costs?
Neither. The comparison uses 2022 premiums and incomes only. NAIC published the 2022 insurance report in 2025; the page was checked in November 2026. No growth rates or future premiums have been estimated.
Can two states with nearly identical ratios be considered equally affordable?
Not from this index alone. The ratio ignores uncertainty in ACS income estimates and differences in insured property value, coverage and deductibles. Small gaps between rounded ratios do not prove a meaningful difference in actual household affordability.
Sources and their roles
NAIC 2022 Homeowners Report
Published average 2022 HO-3 premium per house-year by state; the numerator for each calculation. Released May 21, 2025.
https://content.naic.org/sites/default/files/publication-hmr-zu-homeowners-report.pdfHousehold Income in States and Metropolitan Areas: 2022
ACS 2022 1-year median household income, Table 1; the denominator for each state.
https://www.census.gov/content/dam/Census/library/publications/2023/acs/acsbr-017.pdfInsurance Information Institute: Homeowners premiums
Reproduction of NAIC HO-3 premium figures used to cross-check state inputs. Its underlying data are NAIC, not a third independent numeric source.
https://www.iii.org/fact-statistic/facts-statistics-homeowners-and-renters-insuranceInsurance Research Council: Homeowners Insurance Affordability
Published 2022 affordability benchmark using dwelling-fire and owner-occupied homeowners forms. Used only to compare definitions and illustrate why the HO-3-only ratios differ; not a numeric input to any StatRanker state row.
https://insurance-research.org/node/127Census geographic regions
Defines the four regions used to group states and compute region-specific medians.
https://www.census.gov/data/data-tools/survey-explorer/geo.htmlNAIC release and policy coverage notes
Explains policy-form scope, publication date and special market reporting; it is not an additional numeric source.
https://content.naic.org/article/naic-releases-homeowners-insurance-report-2022GAO: Homeowners Insurance
Separate examination of premiums and affordability constraints. GAO's later-year figures and different data scope are not substituted for 2022 NAIC inputs.
https://files.gao.gov/assets/gao-26-107867.pdfDownload the Homeowners Insurance Premiums Relative to Income by State (2022) dataset
Homeowners Insurance Premiums Relative to Income by State (2022)
50 ranked entries · Excel + CSV + methodology + sources + chart · Snapshot: 2022 state average HO-3 homeowners premiums relative to 2022 median household income · Version 1.0
The archive includes machine-readable data, methodology and source documentation. Quick human verification is required before the ZIP is delivered. Full Data Pack downloads require a free account. Free accounts can download 1 different Data Pack every 30 days; re-downloading the same pack does not use another slot. Annual Data Access provides unlimited manual downloads while annual access is active.
Download Excel + CSV Data PackRelated rankings
Closely related StatRanker ranking and data pages selected by topic, entity scope and category. Fewer links are shown when strong matches are limited.