

Where Does Your Salary Go Furthest in America? 2026 Calculator
Where does the same salary buy more?
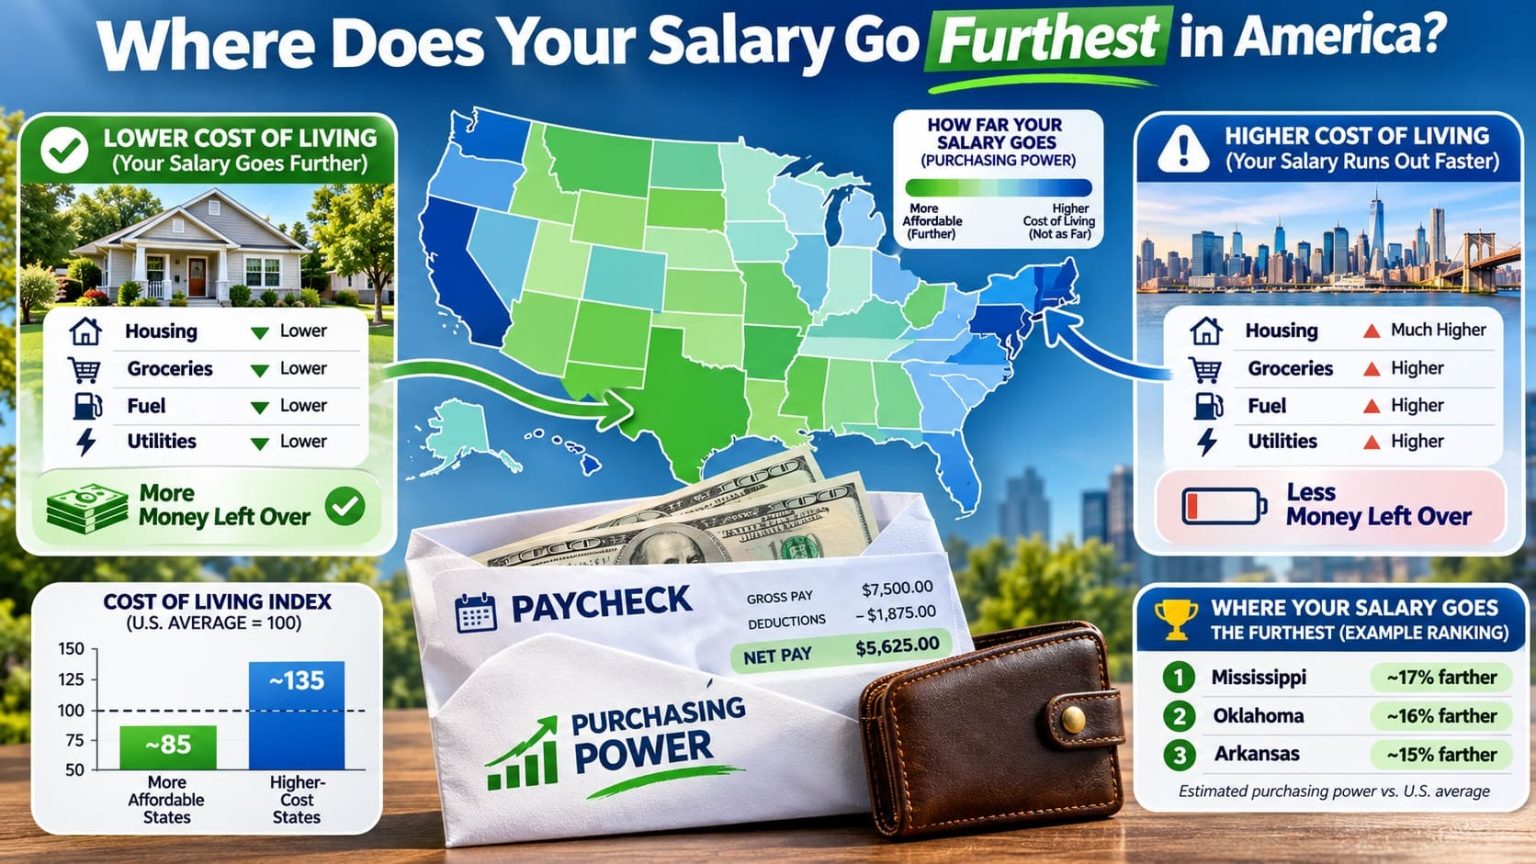
At 2024 prices, a $100,000 salary has about $115,026 in national-price-equivalent buying power in Arkansas, versus $90,318 in California. But with actual median wages, California leads for software developers and nurses, while Washington leads for elementary teachers. Try your pay below.
2026 snapshot based on BEA 2024 regional prices, BLS May 2025 median pay and Census ACS 2024 housing costs. All 50 states and Washington, DC; gross salaries before taxes, not a 2026 forecast.
Find out where your salary goes furthest
Enter your salary or choose a profession, select a state or all states, and press Show results. Housing costs are shown separately and do not change the ranking.
More filters: region, sort and number of results
Your state comparison
Comparing annual gross pay across 51 areas.
| Scenario rank | State | Price-adjusted salary | Housing / source and method note |
|---|---|---|---|
| 1 | Arkansas | $115,026$100,000 user-defined gross salary | $982/mo gross rent · 11.8% of grossBEA/Census 2024 · user_scenario · FormulaBEA 2024 all-items RPP 86.937 (official_value); Census ACS 2024 B25064 rent $982 (official_value); hypothetical user pay $100,000 (not observed); user scenario = $100,000 × 100 / 86.937; separate housing ratio = 12 × $982 / $100,000 × 100. |
| 2 | Mississippi | $115,005$100,000 user-defined gross salary | $990/mo gross rent · 11.9% of grossBEA/Census 2024 · user_scenario · FormulaBEA 2024 all-items RPP 86.953 (official_value); Census ACS 2024 B25064 rent $990 (official_value); hypothetical user pay $100,000 (not observed); user scenario = $100,000 × 100 / 86.953; separate housing ratio = 12 × $990 / $100,000 × 100. |
| 3 | Iowa | $113,945$100,000 user-defined gross salary | $981/mo gross rent · 11.8% of grossBEA/Census 2024 · user_scenario · FormulaBEA 2024 all-items RPP 87.762 (official_value); Census ACS 2024 B25064 rent $981 (official_value); hypothetical user pay $100,000 (not observed); user scenario = $100,000 × 100 / 87.762; separate housing ratio = 12 × $981 / $100,000 × 100. |
| 4 | Oklahoma | $113,839$100,000 user-defined gross salary | $1,044/mo gross rent · 12.5% of grossBEA/Census 2024 · user_scenario · FormulaBEA 2024 all-items RPP 87.843 (official_value); Census ACS 2024 B25064 rent $1,044 (official_value); hypothetical user pay $100,000 (not observed); user scenario = $100,000 × 100 / 87.843; separate housing ratio = 12 × $1,044 / $100,000 × 100. |
| 5 | Louisiana | $113,370$100,000 user-defined gross salary | $1,064/mo gross rent · 12.8% of grossBEA/Census 2024 · user_scenario · FormulaBEA 2024 all-items RPP 88.207 (official_value); Census ACS 2024 B25064 rent $1,064 (official_value); hypothetical user pay $100,000 (not observed); user scenario = $100,000 × 100 / 88.207; separate housing ratio = 12 × $1,064 / $100,000 × 100. |
| 6 | South Dakota | $112,885$100,000 user-defined gross salary | $999/mo gross rent · 12.0% of grossBEA/Census 2024 · user_scenario · FormulaBEA 2024 all-items RPP 88.586 (official_value); Census ACS 2024 B25064 rent $999 (official_value); hypothetical user pay $100,000 (not observed); user scenario = $100,000 × 100 / 88.586; separate housing ratio = 12 × $999 / $100,000 × 100. |
| 7 | Alabama | $112,583$100,000 user-defined gross salary | $1,077/mo gross rent · 12.9% of grossBEA/Census 2024 · user_scenario · FormulaBEA 2024 all-items RPP 88.823 (official_value); Census ACS 2024 B25064 rent $1,077 (official_value); hypothetical user pay $100,000 (not observed); user scenario = $100,000 × 100 / 88.823; separate housing ratio = 12 × $1,077 / $100,000 × 100. |
| 8 | North Dakota | $112,411$100,000 user-defined gross salary | $980/mo gross rent · 11.8% of grossBEA/Census 2024 · user_scenario · FormulaBEA 2024 all-items RPP 88.959 (official_value); Census ACS 2024 B25064 rent $980 (official_value); hypothetical user pay $100,000 (not observed); user scenario = $100,000 × 100 / 88.959; separate housing ratio = 12 × $980 / $100,000 × 100. |
| 9 | West Virginia | $111,736$100,000 user-defined gross salary | $883/mo gross rent · 10.6% of grossBEA/Census 2024 · user_scenario · FormulaBEA 2024 all-items RPP 89.497 (official_value); Census ACS 2024 B25064 rent $883 (official_value); hypothetical user pay $100,000 (not observed); user scenario = $100,000 × 100 / 89.497; separate housing ratio = 12 × $883 / $100,000 × 100. |
| 10 | Kansas | $111,027$100,000 user-defined gross salary | $1,079/mo gross rent · 12.9% of grossBEA/Census 2024 · user_scenario · FormulaBEA 2024 all-items RPP 90.068 (official_value); Census ACS 2024 B25064 rent $1,079 (official_value); hypothetical user pay $100,000 (not observed); user scenario = $100,000 × 100 / 90.068; separate housing ratio = 12 × $1,079 / $100,000 × 100. |
| 11 | Nebraska | $110,984$100,000 user-defined gross salary | $1,102/mo gross rent · 13.2% of grossBEA/Census 2024 · user_scenario · FormulaBEA 2024 all-items RPP 90.103 (official_value); Census ACS 2024 B25064 rent $1,102 (official_value); hypothetical user pay $100,000 (not observed); user scenario = $100,000 × 100 / 90.103; separate housing ratio = 12 × $1,102 / $100,000 × 100. |
| 12 | Kentucky | $110,915$100,000 user-defined gross salary | $998/mo gross rent · 12.0% of grossBEA/Census 2024 · user_scenario · FormulaBEA 2024 all-items RPP 90.159 (official_value); Census ACS 2024 B25064 rent $998 (official_value); hypothetical user pay $100,000 (not observed); user scenario = $100,000 × 100 / 90.159; separate housing ratio = 12 × $998 / $100,000 × 100. |
| 13 | Missouri | $110,112$100,000 user-defined gross salary | $1,067/mo gross rent · 12.8% of grossBEA/Census 2024 · user_scenario · FormulaBEA 2024 all-items RPP 90.817 (official_value); Census ACS 2024 B25064 rent $1,067 (official_value); hypothetical user pay $100,000 (not observed); user scenario = $100,000 × 100 / 90.817; separate housing ratio = 12 × $1,067 / $100,000 × 100. |
| 14 | Tennessee | $108,849$100,000 user-defined gross salary | $1,284/mo gross rent · 15.4% of grossBEA/Census 2024 · user_scenario · FormulaBEA 2024 all-items RPP 91.870 (official_value); Census ACS 2024 B25064 rent $1,284 (official_value); hypothetical user pay $100,000 (not observed); user scenario = $100,000 × 100 / 91.870; separate housing ratio = 12 × $1,284 / $100,000 × 100. |
| 15 | New Mexico | $108,446$100,000 user-defined gross salary | $1,117/mo gross rent · 13.4% of grossBEA/Census 2024 · user_scenario · FormulaBEA 2024 all-items RPP 92.212 (official_value); Census ACS 2024 B25064 rent $1,117 (official_value); hypothetical user pay $100,000 (not observed); user scenario = $100,000 × 100 / 92.212; separate housing ratio = 12 × $1,117 / $100,000 × 100. |
| 16 | Wyoming | $107,885$100,000 user-defined gross salary | $998/mo gross rent · 12.0% of grossBEA/Census 2024 · user_scenario · FormulaBEA 2024 all-items RPP 92.691 (official_value); Census ACS 2024 B25064 rent $998 (official_value); hypothetical user pay $100,000 (not observed); user scenario = $100,000 × 100 / 92.691; separate housing ratio = 12 × $998 / $100,000 × 100. |
| 17 | Ohio | $107,789$100,000 user-defined gross salary | $1,090/mo gross rent · 13.1% of grossBEA/Census 2024 · user_scenario · FormulaBEA 2024 all-items RPP 92.774 (official_value); Census ACS 2024 B25064 rent $1,090 (official_value); hypothetical user pay $100,000 (not observed); user scenario = $100,000 × 100 / 92.774; separate housing ratio = 12 × $1,090 / $100,000 × 100. |
| 18 | Indiana | $107,148$100,000 user-defined gross salary | $1,104/mo gross rent · 13.2% of grossBEA/Census 2024 · user_scenario · FormulaBEA 2024 all-items RPP 93.329 (official_value); Census ACS 2024 B25064 rent $1,104 (official_value); hypothetical user pay $100,000 (not observed); user scenario = $100,000 × 100 / 93.329; separate housing ratio = 12 × $1,104 / $100,000 × 100. |
| 19 | South Carolina | $106,668$100,000 user-defined gross salary | $1,272/mo gross rent · 15.3% of grossBEA/Census 2024 · user_scenario · FormulaBEA 2024 all-items RPP 93.749 (official_value); Census ACS 2024 B25064 rent $1,272 (official_value); hypothetical user pay $100,000 (not observed); user scenario = $100,000 × 100 / 93.749; separate housing ratio = 12 × $1,272 / $100,000 × 100. |
| 20 | Wisconsin | $106,276$100,000 user-defined gross salary | $1,142/mo gross rent · 13.7% of grossBEA/Census 2024 · user_scenario · FormulaBEA 2024 all-items RPP 94.095 (official_value); Census ACS 2024 B25064 rent $1,142 (official_value); hypothetical user pay $100,000 (not observed); user scenario = $100,000 × 100 / 94.095; separate housing ratio = 12 × $1,142 / $100,000 × 100. |
| 21 | North Carolina | $106,015$100,000 user-defined gross salary | $1,338/mo gross rent · 16.1% of grossBEA/Census 2024 · user_scenario · FormulaBEA 2024 all-items RPP 94.326 (official_value); Census ACS 2024 B25064 rent $1,338 (official_value); hypothetical user pay $100,000 (not observed); user scenario = $100,000 × 100 / 94.326; separate housing ratio = 12 × $1,338 / $100,000 × 100. |
| 22 | Montana | $105,658$100,000 user-defined gross salary | $1,177/mo gross rent · 14.1% of grossBEA/Census 2024 · user_scenario · FormulaBEA 2024 all-items RPP 94.645 (official_value); Census ACS 2024 B25064 rent $1,177 (official_value); hypothetical user pay $100,000 (not observed); user scenario = $100,000 × 100 / 94.645; separate housing ratio = 12 × $1,177 / $100,000 × 100. |
| 23 | Idaho | $104,719$100,000 user-defined gross salary | $1,384/mo gross rent · 16.6% of grossBEA/Census 2024 · user_scenario · FormulaBEA 2024 all-items RPP 95.494 (official_value); Census ACS 2024 B25064 rent $1,384 (official_value); hypothetical user pay $100,000 (not observed); user scenario = $100,000 × 100 / 95.494; separate housing ratio = 12 × $1,384 / $100,000 × 100. |
| 24 | Michigan | $103,932$100,000 user-defined gross salary | $1,168/mo gross rent · 14.0% of grossBEA/Census 2024 · user_scenario · FormulaBEA 2024 all-items RPP 96.217 (official_value); Census ACS 2024 B25064 rent $1,168 (official_value); hypothetical user pay $100,000 (not observed); user scenario = $100,000 × 100 / 96.217; separate housing ratio = 12 × $1,168 / $100,000 × 100. |
| 25 | Georgia | $103,850$100,000 user-defined gross salary | $1,506/mo gross rent · 18.1% of grossBEA/Census 2024 · user_scenario · FormulaBEA 2024 all-items RPP 96.293 (official_value); Census ACS 2024 B25064 rent $1,506 (official_value); hypothetical user pay $100,000 (not observed); user scenario = $100,000 × 100 / 96.293; separate housing ratio = 12 × $1,506 / $100,000 × 100. |
| 26 | Maine | $103,040$100,000 user-defined gross salary | $1,210/mo gross rent · 14.5% of grossBEA/Census 2024 · user_scenario · FormulaBEA 2024 all-items RPP 97.050 (official_value); Census ACS 2024 B25064 rent $1,210 (official_value); hypothetical user pay $100,000 (not observed); user scenario = $100,000 × 100 / 97.050; separate housing ratio = 12 × $1,210 / $100,000 × 100. |
| 27 | Texas | $103,032$100,000 user-defined gross salary | $1,475/mo gross rent · 17.7% of grossBEA/Census 2024 · user_scenario · FormulaBEA 2024 all-items RPP 97.057 (official_value); Census ACS 2024 B25064 rent $1,475 (official_value); hypothetical user pay $100,000 (not observed); user scenario = $100,000 × 100 / 97.057; separate housing ratio = 12 × $1,475 / $100,000 × 100. |
| 28 | Pennsylvania | $102,488$100,000 user-defined gross salary | $1,252/mo gross rent · 15.0% of grossBEA/Census 2024 · user_scenario · FormulaBEA 2024 all-items RPP 97.572 (official_value); Census ACS 2024 B25064 rent $1,252 (official_value); hypothetical user pay $100,000 (not observed); user scenario = $100,000 × 100 / 97.572; separate housing ratio = 12 × $1,252 / $100,000 × 100. |
| 29 | Vermont | $102,085$100,000 user-defined gross salary | $1,319/mo gross rent · 15.8% of grossBEA/Census 2024 · user_scenario · FormulaBEA 2024 all-items RPP 97.958 (official_value); Census ACS 2024 B25064 rent $1,319 (official_value); hypothetical user pay $100,000 (not observed); user scenario = $100,000 × 100 / 97.958; separate housing ratio = 12 × $1,319 / $100,000 × 100. |
| 30 | Minnesota | $101,398$100,000 user-defined gross salary | $1,291/mo gross rent · 15.5% of grossBEA/Census 2024 · user_scenario · FormulaBEA 2024 all-items RPP 98.621 (official_value); Census ACS 2024 B25064 rent $1,291 (official_value); hypothetical user pay $100,000 (not observed); user scenario = $100,000 × 100 / 98.621; separate housing ratio = 12 × $1,291 / $100,000 × 100. |
| 31 | Utah | $101,149$100,000 user-defined gross salary | $1,593/mo gross rent · 19.1% of grossBEA/Census 2024 · user_scenario · FormulaBEA 2024 all-items RPP 98.864 (official_value); Census ACS 2024 B25064 rent $1,593 (official_value); hypothetical user pay $100,000 (not observed); user scenario = $100,000 × 100 / 98.864; separate housing ratio = 12 × $1,593 / $100,000 × 100. |
| 32 | Delaware | $100,192$100,000 user-defined gross salary | $1,530/mo gross rent · 18.4% of grossBEA/Census 2024 · user_scenario · FormulaBEA 2024 all-items RPP 99.808 (official_value); Census ACS 2024 B25064 rent $1,530 (official_value); hypothetical user pay $100,000 (not observed); user scenario = $100,000 × 100 / 99.808; separate housing ratio = 12 × $1,530 / $100,000 × 100. |
| 33 | Illinois | $100,042$100,000 user-defined gross salary | $1,322/mo gross rent · 15.9% of grossBEA/Census 2024 · user_scenario · FormulaBEA 2024 all-items RPP 99.958 (official_value); Census ACS 2024 B25064 rent $1,322 (official_value); hypothetical user pay $100,000 (not observed); user scenario = $100,000 × 100 / 99.958; separate housing ratio = 12 × $1,322 / $100,000 × 100. |
| 34 | Nevada | $100,021$100,000 user-defined gross salary | $1,709/mo gross rent · 20.5% of grossBEA/Census 2024 · user_scenario · FormulaBEA 2024 all-items RPP 99.979 (official_value); Census ACS 2024 B25064 rent $1,709 (official_value); hypothetical user pay $100,000 (not observed); user scenario = $100,000 × 100 / 99.979; separate housing ratio = 12 × $1,709 / $100,000 × 100. |
| 35 | Arizona | $99,328$100,000 user-defined gross salary | $1,672/mo gross rent · 20.1% of grossBEA/Census 2024 · user_scenario · FormulaBEA 2024 all-items RPP 100.677 (official_value); Census ACS 2024 B25064 rent $1,672 (official_value); hypothetical user pay $100,000 (not observed); user scenario = $100,000 × 100 / 100.677; separate housing ratio = 12 × $1,672 / $100,000 × 100. |
| 36 | Virginia | $98,908$100,000 user-defined gross salary | $1,646/mo gross rent · 19.8% of grossBEA/Census 2024 · user_scenario · FormulaBEA 2024 all-items RPP 101.104 (official_value); Census ACS 2024 B25064 rent $1,646 (official_value); hypothetical user pay $100,000 (not observed); user scenario = $100,000 × 100 / 101.104; separate housing ratio = 12 × $1,646 / $100,000 × 100. |
| 37 | Rhode Island | $97,771$100,000 user-defined gross salary | $1,418/mo gross rent · 17.0% of grossBEA/Census 2024 · user_scenario · FormulaBEA 2024 all-items RPP 102.280 (official_value); Census ACS 2024 B25064 rent $1,418 (official_value); hypothetical user pay $100,000 (not observed); user scenario = $100,000 × 100 / 102.280; separate housing ratio = 12 × $1,418 / $100,000 × 100. |
| 38 | Alaska | $97,695$100,000 user-defined gross salary | $1,444/mo gross rent · 17.3% of grossBEA/Census 2024 · user_scenario · FormulaBEA 2024 all-items RPP 102.359 (official_value); Census ACS 2024 B25064 rent $1,444 (official_value); hypothetical user pay $100,000 (not observed); user scenario = $100,000 × 100 / 102.359; separate housing ratio = 12 × $1,444 / $100,000 × 100. |
| 39 | Colorado | $97,038$100,000 user-defined gross salary | $1,822/mo gross rent · 21.9% of grossBEA/Census 2024 · user_scenario · FormulaBEA 2024 all-items RPP 103.052 (official_value); Census ACS 2024 B25064 rent $1,822 (official_value); hypothetical user pay $100,000 (not observed); user scenario = $100,000 × 100 / 103.052; separate housing ratio = 12 × $1,822 / $100,000 × 100. |
| 40 | Oregon | $96,748$100,000 user-defined gross salary | $1,597/mo gross rent · 19.2% of grossBEA/Census 2024 · user_scenario · FormulaBEA 2024 all-items RPP 103.361 (official_value); Census ACS 2024 B25064 rent $1,597 (official_value); hypothetical user pay $100,000 (not observed); user scenario = $100,000 × 100 / 103.361; separate housing ratio = 12 × $1,597 / $100,000 × 100. |
| 41 | Florida | $96,699$100,000 user-defined gross salary | $1,812/mo gross rent · 21.7% of grossBEA/Census 2024 · user_scenario · FormulaBEA 2024 all-items RPP 103.414 (official_value); Census ACS 2024 B25064 rent $1,812 (official_value); hypothetical user pay $100,000 (not observed); user scenario = $100,000 × 100 / 103.414; separate housing ratio = 12 × $1,812 / $100,000 × 100. |
| 42 | Connecticut | $96,516$100,000 user-defined gross salary | $1,550/mo gross rent · 18.6% of grossBEA/Census 2024 · user_scenario · FormulaBEA 2024 all-items RPP 103.610 (official_value); Census ACS 2024 B25064 rent $1,550 (official_value); hypothetical user pay $100,000 (not observed); user scenario = $100,000 × 100 / 103.610; separate housing ratio = 12 × $1,550 / $100,000 × 100. |
| 43 | New Hampshire | $96,002$100,000 user-defined gross salary | $1,558/mo gross rent · 18.7% of grossBEA/Census 2024 · user_scenario · FormulaBEA 2024 all-items RPP 104.165 (official_value); Census ACS 2024 B25064 rent $1,558 (official_value); hypothetical user pay $100,000 (not observed); user scenario = $100,000 × 100 / 104.165; separate housing ratio = 12 × $1,558 / $100,000 × 100. |
| 44 | Maryland | $95,275$100,000 user-defined gross salary | $1,721/mo gross rent · 20.7% of grossBEA/Census 2024 · user_scenario · FormulaBEA 2024 all-items RPP 104.959 (official_value); Census ACS 2024 B25064 rent $1,721 (official_value); hypothetical user pay $100,000 (not observed); user scenario = $100,000 × 100 / 104.959; separate housing ratio = 12 × $1,721 / $100,000 × 100. |
| 45 | Massachusetts | $94,556$100,000 user-defined gross salary | $1,848/mo gross rent · 22.2% of grossBEA/Census 2024 · user_scenario · FormulaBEA 2024 all-items RPP 105.757 (official_value); Census ACS 2024 B25064 rent $1,848 (official_value); hypothetical user pay $100,000 (not observed); user scenario = $100,000 × 100 / 105.757; separate housing ratio = 12 × $1,848 / $100,000 × 100. |
| 46 | Washington | $93,447$100,000 user-defined gross salary | $1,824/mo gross rent · 21.9% of grossBEA/Census 2024 · user_scenario · FormulaBEA 2024 all-items RPP 107.013 (official_value); Census ACS 2024 B25064 rent $1,824 (official_value); hypothetical user pay $100,000 (not observed); user scenario = $100,000 × 100 / 107.013; separate housing ratio = 12 × $1,824 / $100,000 × 100. |
| 47 | New York | $92,660$100,000 user-defined gross salary | $1,634/mo gross rent · 19.6% of grossBEA/Census 2024 · user_scenario · FormulaBEA 2024 all-items RPP 107.921 (official_value); Census ACS 2024 B25064 rent $1,634 (official_value); hypothetical user pay $100,000 (not observed); user scenario = $100,000 × 100 / 107.921; separate housing ratio = 12 × $1,634 / $100,000 × 100. |
| 48 | New Jersey | $91,908$100,000 user-defined gross salary | $1,800/mo gross rent · 21.6% of grossBEA/Census 2024 · user_scenario · FormulaBEA 2024 all-items RPP 108.805 (official_value); Census ACS 2024 B25064 rent $1,800 (official_value); hypothetical user pay $100,000 (not observed); user scenario = $100,000 × 100 / 108.805; separate housing ratio = 12 × $1,800 / $100,000 × 100. |
| 49 | District of Columbia | $90,991$100,000 user-defined gross salary | $1,931/mo gross rent · 23.2% of grossBEA/Census 2024 · user_scenario · FormulaBEA 2024 all-items RPP 109.901 (official_value); Census ACS 2024 B25064 rent $1,931 (official_value); hypothetical user pay $100,000 (not observed); user scenario = $100,000 × 100 / 109.901; separate housing ratio = 12 × $1,931 / $100,000 × 100. |
| 50 | Hawaii | $90,950$100,000 user-defined gross salary | $1,942/mo gross rent · 23.3% of grossBEA/Census 2024 · user_scenario · FormulaBEA 2024 all-items RPP 109.951 (official_value); Census ACS 2024 B25064 rent $1,942 (official_value); hypothetical user pay $100,000 (not observed); user scenario = $100,000 × 100 / 109.951; separate housing ratio = 12 × $1,942 / $100,000 × 100. |
| 51 | California | $90,318$100,000 user-defined gross salary | $2,104/mo gross rent · 25.2% of grossBEA/Census 2024 · user_scenario · FormulaBEA 2024 all-items RPP 110.720 (official_value); Census ACS 2024 B25064 rent $2,104 (official_value); hypothetical user pay $100,000 (not observed); user scenario = $100,000 × 100 / 110.720; separate housing ratio = 12 × $2,104 / $100,000 × 100. |
Try another state or clear the filters.
How to interpret your results
What the number means: $100,000 is an example, not an observed statewide wage. The price-adjusted amount is a comparison at national price levels, not money left after expenses.
The housing line is a separate statewide median; no housing expense is deducted twice from the adjusted salary.
Housing costs are reported as separate state medians and should not be deducted from the BEA-adjusted salary a second time. In the occupational mode, missing BLS wages are excluded, never treated as zero.
The equal-pay baseline in four numbers
These are price-level factors, not salaries paid by employers. They explain how an identical paycheck compares across states.
Arkansas · BEA 2024 price index 86.937
California · BEA 2024 price index 110.720
Median of 51 state and DC factors, not population-weighted
51 calculations from 51 official BEA 2024 inputs; no forecast
Why the best state changes with your job
If everyone earns the same amount, a lower overall price level stretches that paycheck further. Arkansas narrowly comes first in this comparison. But pay is not identical across the country: when we adjust each state's published median wage for its price level, California comes first for software developers and registered nurses, and Washington for elementary school teachers.
The two rankings answer different questions. Use the equal-pay ranking to compare prices, and the occupation option to compare median wages after a price adjustment. The rental and homeowner figures are separate points of reference; they are not subtracted from the adjusted result because the overall BEA price index already incorporates housing rents.
What changes when you compare pay, not just prices
Key Insight
With the same $100,000 salary in every state, Arkansas leads at $115,026 in national-price-equivalent buying power. Using May 2025 BLS median wages instead, California leads for software developers ($157,523 adjusted) and registered nurses ($126,689), while Washington leads for elementary teachers ($95,643). The higher-paying job market can outweigh a higher price level.
Notable Pattern
Arkansas and Mississippi are nearly tied for equal-pay buying power: $115,026 versus $115,005 on a $100,000 salary, a difference of only about $21. The median factor across all 51 areas is 1.0304×; that is a median of jurisdictions, not a figure for the typical U.S. resident.
Regional Concentration
All ten highest equal-pay factors are in the South or Midwest: six in the South and four in the Midwest. Neither the Northeast nor West appears among those ten in the BEA 2024 price-based ranking. This describes price levels, not where median wages are highest.
Outlier
Washington, DC's 2024 rent-only price index is 154.984, compared with 109.901 for its overall price index — a 45.083-point difference. The main ranking uses the overall index, so a particularly high rental price level is not mistaken for the price level of everything residents buy.
Top 10 states when everyone earns the same salary
The ten leading equal-pay factors, with each state’s BEA calculation and source note.
Top 20 states on the same-pay comparison
The original 20-bar chart based on the same BEA 2024 price factors.
Methodology and comparability
Core ranking: metric and status
2024 BEA all-items RPP (official_value, U.S. = 100) is the only numeric source for the fixed ranking. StatRanker calculates multiplier = 100 / observed RPP (calculated_value), with higher values ranking first. No estimated salary or future-year observation enters the formal ranking. Rank uses the full factor; display rounds to four decimals.
Custom salary: hypothetical scenario
A user-entered gross salary is not an observed input and is not assigned official_value or calculated_value. Its separate calculator result is labeled user_scenario, outside the formal research ranking. Scenario formula: input annual gross USD × 100 / official BEA 2024 RPP. Example: $100,000 × 100 / 86.937 = about $115,026 in Arkansas. It is not an official wage, forecast or after-tax estimate.
Occupation comparison: observed inputs
For software developers (SOC 15-1252), registered nurses (29-1141) and elementary teachers excluding special education (25-2021), BLS May 2025 state median gross annual wage is official_value. The separate adjusted occupation result is calculated_value = BLS wage × 100 / BEA 2024 RPP. It is an historical cross-year comparison, not a 2026 observed salary. Alaska's software developer median is unavailable and is excluded only from that mode.
Housing benchmark
The Rent selector uses Census ACS 2024 1-Year B25064 median gross rent; Own with Mortgage uses B25088 median selected monthly owner costs for mortgaged homeowners. Their source estimates are official_value. The illustrative benchmark-to-gross-salary ratio = 12 × selected monthly median / selected annual gross salary × 100. This is not an observed individual rent burden, since the housing and wage populations differ.
Sources, hierarchy and vintage
BEA 2024 RPP released February 19, 2026; BLS May 2025 occupational medians; Census ACS 2024 one-year housing estimates. Formal ranking has one numeric publisher (BEA); the calculator additionally uses BLS and Census, for three distinct federal publishing organizations overall. FRED is a republication used for validation, not a fourth independent source. Reviewed November 7, 2026.
Coverage and conflicts
All 50 states and Washington, DC. Puerto Rico, U.S. territories, counties and metro areas are excluded. No annual 2026 projections or modeled trends. Keep suppressed wages missing, never zero. In conflicts, check the original publisher, year, variable and release/revision; do not average disagreements. The observed price year remains 2024 across all 51 research rows.
What the model cannot tell you
BEA all-items RPP is not a household-specific budget. Gross pay excludes tax, benefits, commuting, childcare, debt payments and the user's circumstances. ACS housing medians describe existing renters/owners, not current listings or a mortgage quote for a buyer. The 2025 ACS was released after the 2024 housing set used here; the older housing benchmark is retained to align its year with BEA RPP, not claimed as the newest ACS.
The official inputs and StatRanker-calculated multipliers are separate. The fixed research table and its chart never change when a user chooses a salary. Only the independent personal scenario table is recalculated; source-published values remain immutable.
Research ranking: buying-power factors for all 51 areas
All 51 price factors, state filters and detailed formulas. Click to expand.
How to use the comparison when weighing a job offer
First, compare the gross salaries you could actually earn. If two offers pay the same amount, the state price factors give a useful starting point. If you are deciding where to look for work, choose your occupation instead: higher typical wages in an expensive state can still produce more adjusted buying power. The housing column then gives a separate indication of typical renter or mortgaged-owner costs.
Do not treat the adjusted figure as cash left after bills. Taxes, health insurance, family size, childcare, commuting and neighborhood prices are not modeled. The BLS wage and Census housing medians come from different groups of people, so the result is a comparison tool, not a household budget or an estimate for a particular job offer.
Questions about salary buying power
Where does an identical salary go furthest?
Arkansas is first in the 2024 BEA equal-pay price comparison, followed closely by Mississippi. At a $100,000 gross salary, their estimated national-price-equivalent amounts are $115,026 and $115,005, respectively.
Why does California lead for developers and nurses?
Because the occupation comparison uses each state's published May 2025 median salary as well as its 2024 price level. California has the highest adjusted median among the available states for both selected occupations in this dataset. It does not mean any specific California job offer will be highest.
Are these salaries for 2026?
No. This is a 2026 snapshot using 2024 BEA price levels, May 2025 BLS occupation wages and 2024 Census housing medians. There are no estimated or projected 2026 salaries.
How is the price-adjusted amount calculated?
For a salary you enter, the calculation is gross salary × 100 ÷ the state's BEA all-items price index. For an occupation, the same formula uses that state's BLS May 2025 median annual wage instead. The calculation is produced by StatRanker; BEA and BLS do not publish the final adjusted salary amount.
Why is Alaska missing from the software developer comparison?
BLS did not publish a comparable May 2025 median annual wage for that occupation in Alaska. Rather than invent or substitute a figure, the calculator excludes it only for that occupation. Alaska remains in the equal-pay ranking.
Does switching between Rent and Own change the ranking?
No. It changes the separate monthly housing benchmark and the ratio to gross salary. The main adjusted-pay ranking uses BEA's overall price index, which already includes rental housing prices; housing costs are not deducted a second time.
Is the displayed housing cost what I would pay?
No. The 2024 Census figures are statewide medians for existing renter households or homeowners with mortgages. A current lease or home purchase in a particular city may be very different.
Is this a take-home pay or household affordability calculator?
No. It compares gross salary with state-level prices. It does not account for taxes, health insurance, debt, benefits, childcare or the mix of costs in your own household.
Sources and provenance
U.S. Bureau of Economic Analysis (BEA)
numeric_source · methodology_source. Original official 2024 all-items and housing-rent state price indices. Sole numeric publisher for the immutable main ranking and the base price input in every scenario.
https://www.bea.gov/data/prices-inflation/regional-price-parities-state-and-metro-area
Bureau of Labor Statistics (BLS)
numeric_source (calculator only). Official May 2025 state OEWS median annual wages for SOC 15-1252, 29-1141, 25-2021. BLS figures are used only in the optional occupation calculator.
U.S. Census Bureau, 2024 ACS
numeric_source (calculator only). ACS 2024 one-year tables B25064 (monthly median gross rent) and B25088 (selected monthly homeowner costs with mortgage). These supplement salary results; they do not determine the formal price-multiplier rank.
Federal Reserve Bank of St. Louis (FRED)
validation_source. Republishes BEA state RPP values and rent-series values to three decimals, enabling independent transcription checks. It is not a fourth original numeric publisher.
https://fred.stlouisfed.org/release/tables?eid=233639&rid=403
O*NET Online: BLS 2025 state wage checks
validation_source. U.S. Department of Labor's O*NET republishes BLS 2025 state wage percentiles. Used to check occupational median values and verify that the Alaska software-developer median is unavailable. It is not an independent wage-data publisher.
https://www.onetonline.org/link/localwages/15-1252.00?st=AK
Census ACS 2024 owner-cost release
validation_source · context_source. Official Census announcement checks the selected owner-cost variable, its coverage, and upper/lower endpoints. Not a separate numeric publisher.
https://www.census.gov/newsroom/press-releases/2025/acs-1-year-estimates.html
BEA release, February 19, 2026
context_source · validation_source. Confirms official vintage, RPP definition, and differences between all-items and rental-services prices. Part of the same BEA publisher.
Download the Where Does Your Salary Go Furthest in America? 2026 Calculator dataset
Where Does Your Salary Go Furthest in America? 2026 Calculator
The archive includes machine-readable data, methodology and source documentation. Quick human verification is required before the ZIP is delivered. Full Data Pack downloads require a free account. Free accounts can download 1 different Data Pack every 30 days; re-downloading the same pack does not use another slot. Annual Data Access provides unlimited manual downloads while annual access is active.
Download Excel + CSV Data Pack