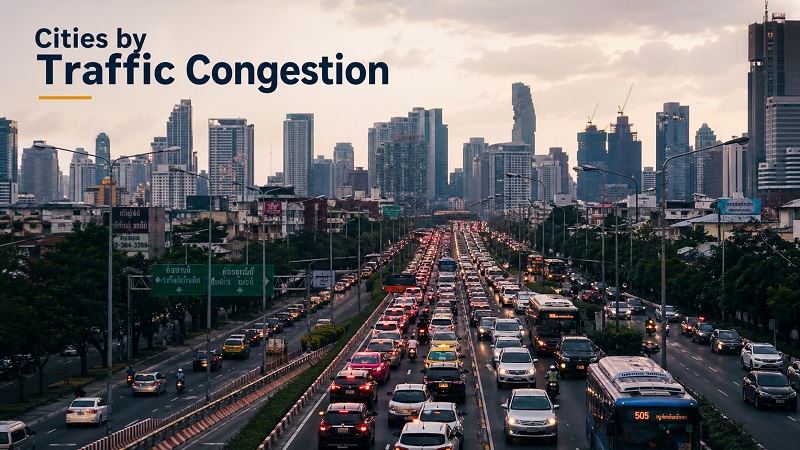
Top 100 Cities by Traffic Congestion in 2026
Mobility · Urban life · 2026 snapshot
Data date: observed 2024 traffic patterns, published in the TomTom Traffic Index 2025 release. Page updated: April 25, 2026.
Cities where a short urban drive takes the longest
Traffic congestion is the daily time tax created when road demand overwhelms a city’s street network. This ranking compares 100 cities by the average time needed to drive 10 km, using the TomTom Traffic Index 2025 release based on observed 2024 traffic patterns. A 10 km trip is short enough to feel familiar to commuters, delivery drivers, visitors and local businesses, yet long enough to reveal how badly traffic friction slows routine movement.
The ranking should not be read as a verdict on overall city quality. Dense, economically successful cities can still appear near the top because demand for road space is intense, historic street layouts are constrained, or public transport does not absorb enough peak-hour trips. The practical question is simpler: how much predictable time does a city consume when people and goods need to move across it?
Top 10 slowest cities by average travel time per 10 km
The top of the list shows two different congestion stories. Barranquilla, Kolkata, Bengaluru, Pune, Lima, Davao City and Trujillo point to fast-growing urban systems where demand, road capacity and public transport alternatives are not aligned. London, Kyoto and Dublin show a second pattern: even wealthy, service-heavy cities can become slow when old street networks, tourism, delivery demand and peak commuting compete for limited space.
Barranquilla, Colombia
Latin America · large coastal city
Dense urban demand, limited road capacity and heavy peak-hour pressure keep average short-distance trips unusually slow.
Kolkata, India
South Asia · megacity
High population density, mixed traffic and saturated arterial corridors push routine road travel well above the global urban norm.
Bengaluru, India
South Asia · technology megacity
Rapid job growth, motorization and infrastructure lag keep everyday journeys highly unreliable across major corridors.
Pune, India
South Asia · large urban economy
Pune shows how a large but not global-megacity urban economy can still experience extreme road pressure.
London, United Kingdom
Europe · global capital
Scarce road space, central demand and the friction of a mature, dense street network make even short trips slow.
Kyoto, Japan
East Asia · historic city
Historic street form and visitor demand can make road travel slow even in a country with strong transport systems.
Lima, Peru
Latin America · coastal megacity
Large-scale commuting flows and uneven corridor capacity contribute to persistent delay across the metropolitan area.
Davao City, Philippines
Southeast Asia · regional urban centre
Growing car dependence and limited road flexibility create congestion levels that feel disproportionate to city size.
Trujillo, Peru
Latin America · medium urban system
Smaller urban systems can rank poorly when corridor capacity, peak demand and network redundancy are weak.
Dublin, Ireland
Europe · capital city
Network bottlenecks, constrained street space and peak commuting pressure keep average driving times elevated.
Ranking table: 100 cities by 10 km travel time
The table ranks cities by average travel time for a 10 km drive. Use the controls to search, sort and filter cities by region, city type and travel-time format.
| Rank | City / metro area | Region / type | Travel time / 10 km |
|---|---|---|---|
| 1 | BarranquillaColombia | AmericasLarge city | 36:0636.10 min |
| 2 | KolkataIndia | AsiaMegacity | 34:3334.55 min |
| 3 | BengaluruIndia | AsiaMegacity | 34:1034.17 min |
| 4 | PuneIndia | AsiaLarge city | 33:2233.37 min |
| 5 | LondonUnited Kingdom | EuropeMegacity | 33:1733.28 min |
| 6 | KyotoJapan | AsiaLarge city | 33:1633.27 min |
| 7 | LimaPeru | AmericasMegacity | 33:1233.20 min |
| 8 | Davao CityPhilippines | AsiaLarge city | 32:5932.98 min |
| 9 | TrujilloPeru | AmericasLarge city | 32:5632.93 min |
| 10 | DublinIreland | EuropeLarge city | 32:4532.75 min |
| 11 | BucharestRomania | EuropeLarge city | 32:3832.63 min |
| 12 | Mexico CityMexico | AmericasMegacity | 32:3332.55 min |
| 13 | JakartaIndonesia | AsiaMegacity | 32:2932.48 min |
| 14 | ManilaPhilippines | AsiaMegacity | 32:2432.40 min |
| 15 | BangkokThailand | AsiaMegacity | 32:1832.30 min |
| 16 | BogotáColombia | AmericasMegacity | 32:1232.20 min |
| 17 | IstanbulTürkiye | MENAMegacity | 32:0832.13 min |
| 18 | HyderabadIndia | AsiaMegacity | 31:3031.50 min |
| 19 | HanoiVietnam | AsiaLarge city | 31:2631.43 min |
| 20 | ParisFrance | EuropeMegacity | 31:2031.33 min |
| 21 | RomeItaly | EuropeLarge city | 31:1431.23 min |
| 22 | AthensGreece | EuropeLarge city | 31:0931.15 min |
| 23 | NairobiKenya | AfricaLarge city | 31:0531.08 min |
| 24 | SantiagoChile | AmericasLarge city | 31:0131.02 min |
| 25 | New YorkUnited States | North AmericaMegacity | 31:0031.00 min |
| 26 | Tel AvivIsrael | MENALarge city | 30:5830.97 min |
| 27 | Cape TownSouth Africa | AfricaLarge city | 30:5430.90 min |
| 28 | Buenos AiresArgentina | AmericasMegacity | 30:5030.83 min |
| 29 | SapporoJapan | AsiaLarge city | 30:3030.50 min |
| 30 | MadridSpain | EuropeLarge city | 30:2730.45 min |
| 31 | ChennaiIndia | AsiaMegacity | 30:2030.33 min |
| 32 | Kuala LumpurMalaysia | AsiaLarge city | 30:1630.27 min |
| 33 | LisbonPortugal | EuropeLarge city | 30:1230.20 min |
| 34 | BrusselsBelgium | EuropeLarge city | 30:0830.13 min |
| 35 | SydneyAustralia | OceaniaLarge city | 30:0430.07 min |
| 36 | MelbourneAustralia | OceaniaLarge city | 30:0030.00 min |
| 37 | TorontoCanada | North AmericaLarge city | 29:5429.90 min |
| 38 | Los AngelesUnited States | North AmericaMegacity | 29:4829.80 min |
| 39 | MumbaiIndia | AsiaMegacity | 29:2629.43 min |
| 40 | SeoulSouth Korea | AsiaMegacity | 29:2229.37 min |
| 41 | TokyoJapan | AsiaMegacity | 29:1829.30 min |
| 42 | ShanghaiChina | AsiaMegacity | 29:1429.23 min |
| 43 | BeijingChina | AsiaMegacity | 29:1029.17 min |
| 44 | Hong KongChina | AsiaLarge city | 29:0629.10 min |
| 45 | SingaporeSingapore | AsiaLarge city | 29:0229.03 min |
| 46 | ViennaAustria | EuropeLarge city | 28:5828.97 min |
| 47 | PragueCzechia | EuropeLarge city | 28:5428.90 min |
| 48 | BudapestHungary | EuropeLarge city | 28:5028.83 min |
| 49 | WarsawPoland | EuropeLarge city | 28:4628.77 min |
| 50 | BerlinGermany | EuropeLarge city | 28:4228.70 min |
| 51 | MunichGermany | EuropeLarge city | 28:3828.63 min |
| 52 | HamburgGermany | EuropeLarge city | 28:3428.57 min |
| 53 | AmsterdamNetherlands | EuropeLarge city | 28:3028.50 min |
| 54 | RotterdamNetherlands | EuropeLarge city | 28:2628.43 min |
| 55 | ZurichSwitzerland | EuropeMedium city | 28:2228.37 min |
| 56 | GenevaSwitzerland | EuropeMedium city | 28:1828.30 min |
| 57 | StockholmSweden | EuropeLarge city | 28:1428.23 min |
| 58 | OsloNorway | EuropeLarge city | 28:1028.17 min |
| 59 | CopenhagenDenmark | EuropeLarge city | 28:0628.10 min |
| 60 | HelsinkiFinland | EuropeLarge city | 28:0228.03 min |
| 61 | MilanItaly | EuropeLarge city | 27:5827.97 min |
| 62 | NaplesItaly | EuropeLarge city | 27:5427.90 min |
| 63 | BarcelonaSpain | EuropeLarge city | 27:5027.83 min |
| 64 | ValenciaSpain | EuropeLarge city | 27:4627.77 min |
| 65 | MarseilleFrance | EuropeLarge city | 27:4227.70 min |
| 66 | LyonFrance | EuropeLarge city | 27:3827.63 min |
| 67 | ManchesterUnited Kingdom | EuropeLarge city | 27:3427.57 min |
| 68 | BirminghamUnited Kingdom | EuropeLarge city | 27:3027.50 min |
| 69 | EdinburghUnited Kingdom | EuropeMedium city | 27:2627.43 min |
| 70 | GlasgowUnited Kingdom | EuropeLarge city | 27:2227.37 min |
| 71 | São PauloBrazil | AmericasMegacity | 27:1827.30 min |
| 72 | Rio de JaneiroBrazil | AmericasMegacity | 27:1427.23 min |
| 73 | BrasíliaBrazil | AmericasLarge city | 27:1027.17 min |
| 74 | RecifeBrazil | AmericasLarge city | 27:0627.10 min |
| 75 | FortalezaBrazil | AmericasLarge city | 27:0227.03 min |
| 76 | JohannesburgSouth Africa | AfricaMegacity | 26:5826.97 min |
| 77 | PretoriaSouth Africa | AfricaLarge city | 26:5426.90 min |
| 78 | CasablancaMorocco | AfricaLarge city | 26:5026.83 min |
| 79 | CairoEgypt | AfricaMegacity | 26:4626.77 min |
| 80 | LagosNigeria | AfricaMegacity | 26:4226.70 min |
| 81 | Addis AbabaEthiopia | AfricaLarge city | 26:3826.63 min |
| 82 | AccraGhana | AfricaLarge city | 26:3426.57 min |
| 83 | DohaQatar | MENALarge city | 26:3026.50 min |
| 84 | DubaiUnited Arab Emirates | MENALarge city | 26:2626.43 min |
| 85 | RiyadhSaudi Arabia | MENALarge city | 26:2226.37 min |
| 86 | Kuwait CityKuwait | MENALarge city | 26:1826.30 min |
| 87 | TehranIran | MENAMegacity | 26:1426.23 min |
| 88 | KarachiPakistan | AsiaMegacity | 26:1026.17 min |
| 89 | LahorePakistan | AsiaMegacity | 26:0626.10 min |
| 90 | DhakaBangladesh | AsiaMegacity | 26:0226.03 min |
| 91 | Ho Chi Minh CityVietnam | AsiaMegacity | 25:5825.97 min |
| 92 | Da NangVietnam | AsiaLarge city | 25:5425.90 min |
| 93 | TaipeiTaiwan | AsiaLarge city | 25:5025.83 min |
| 94 | AucklandNew Zealand | OceaniaLarge city | 25:4625.77 min |
| 95 | VancouverCanada | North AmericaLarge city | 25:4225.70 min |
| 96 | MontrealCanada | North AmericaLarge city | 25:3825.63 min |
| 97 | ChicagoUnited States | North AmericaMegacity | 25:3425.57 min |
| 98 | San FranciscoUnited States | North AmericaLarge city | 25:3025.50 min |
| 99 | SeattleUnited States | North AmericaLarge city | 25:2625.43 min |
| 100 | Washington, DCUnited States | North AmericaLarge city | 25:2225.37 min |
Source frame: TomTom Traffic Index 2025 release, reflecting observed 2024 traffic patterns. Main metric: average travel time for a 10 km drive. Data date: 2024 observed traffic patterns. Page updated: April 25, 2026.
Chart 1. Top 20 slowest cities by 10 km travel time
The bar chart converts the same Top 20 values into decimal minutes so the gap between cities is easier to compare visually. Barranquilla is clearly ahead, while Kolkata, Bengaluru, Pune, London, Kyoto, Lima and several other cities form a dense group where a 10 km trip takes roughly 33–35 minutes.
- Barranquilla — 36.10 min
- Kolkata — 34.55 min
- Bengaluru — 34.17 min
- Pune — 33.37 min
- London — 33.28 min
- Kyoto — 33.27 min
- Lima — 33.20 min
- Davao City — 32.98 min
- Trujillo — 32.93 min
- Dublin — 32.75 min
- Bucharest — 32.63 min
- Mexico City — 32.55 min
- Jakarta — 32.48 min
- Manila — 32.40 min
- Bangkok — 32.30 min
- Bogotá — 32.20 min
- Istanbul — 32.13 min
- Hyderabad — 31.50 min
- Hanoi — 31.43 min
- Paris — 31.33 min
Chart 2. Travel time vs annual time lost
A slow 10 km trip and a high annual congestion burden are related but not identical. Travel time shows how slow a standard urban trip feels; annual time lost shows how much peak delay accumulates through the year. Lima and Dublin stand out because their annual burden is especially high even among cities with similar travel times.
Lima and Dublin: 155 h/year; Mexico City: 152 h/year; Bucharest: 150 h/year; London: 149 h/year; Bengaluru: 147 h/year; Kolkata: 145 h/year; Pune: 142 h/year; Barranquilla: 140 h/year.
Methodology
The ranking uses average travel time for a 10 km urban drive as the main comparison layer. This metric is useful because it converts congestion into a plain time cost: instead of asking readers to interpret an abstract index, it shows how long a relatively short city trip takes under observed traffic conditions. The 2026 page date reflects the publication frame, while the values come from the TomTom Traffic Index 2025 release based on observed 2024 road-speed and travel-time patterns. Data date: 2024 observed traffic patterns.
Cities are treated as urban areas or metropolitan road networks according to the source boundary definitions. That distinction matters because a city proper, a wider metro area and a functional commuting region can produce different rankings. The table therefore compares cities as published in the traffic-data frame rather than redefining borders independently. Names are harmonized for readability, country labels are standardized, and values are kept in mm:ss format in the table. Decimal minutes are shown only as a display option and for charts.
Annual time lost is used as a secondary exposure check, not as the main ranking column. A city can have a very slow 10 km trip but a lower yearly burden if peak congestion is concentrated into fewer hours; another city can have a slightly faster 10 km trip but a larger total burden if congestion lasts longer across the day and workweek. This is why the article separates travel-time ranking from the scatter chart.
The key limitation is comparability. App-based and navigation-based traffic datasets are powerful, but they do not capture every trip mode equally. Public transport, walking and cycling may reduce the lived burden for residents even when road travel looks slow. Weather, road works, tourism, special events, freight movement and temporary policy changes can also affect annual readings. For that reason, the ranking is best interpreted as a strong mobility signal rather than a full audit of every city’s transport system.
Key insights from the ranking
- Congestion is not only a megacity problem. Megacities are prominent, but cities such as Barranquilla, Trujillo, Davao City and Dublin show that smaller or mid-sized urban systems can also become highly constrained.
- South Asia and Latin America are heavily exposed near the top. Rapid vehicle growth, dense corridors, uneven public transport coverage and limited network redundancy can turn relatively short trips into long delays.
- Rich cities are not immune. London, Dublin, Paris, New York and Sydney show that high incomes and mature infrastructure do not automatically solve road-space scarcity.
- Congestion is a reliability problem, not only a speed problem. Once trips become unpredictable, households and firms add buffers, deliveries become harder to schedule, and the real cost spreads beyond fuel and driver time.
- Urban form matters. Historic cores, river crossings, bridge bottlenecks, narrow corridors, dispersed suburbs and weak jobs-housing balance can all raise congestion even before population size is considered.
Reading the table: A city with 31 minutes per 10 km is not merely “a little slow.” It means that a routine cross-city trip can consume half an hour before parking, transfer time, delivery loading or final walking distance are added.
What this means for readers
For commuters, the ranking helps translate a city’s mobility problem into daily time. A 10 km commute that regularly takes 30 minutes or more changes work-life balance, school drop-off planning, appointment reliability and housing choices. A cheaper apartment farther from work may become expensive once the lost time is counted.
For businesses, congestion affects route planning, delivery windows, field-service scheduling, employee access and last-mile logistics. In cities where short trips are slow, firms may need more vehicles, more drivers or more buffer time to deliver the same level of service.
For migrants, students, remote workers and tourists, road congestion should be read together with public transport coverage. A city can rank poorly for car trips but still be manageable if metro, rail, bus priority, cycling and walking routes cover daily needs. The opposite can also happen: a city with moderate road speeds may feel difficult if alternatives to driving are weak.
Policy takeaways
- Reliability is often the fastest win. Better incident response, signal timing, bus priority and bottleneck management can improve daily outcomes before major construction projects are completed.
- Road widening alone rarely solves the problem. Extra capacity can quickly attract more trips if pricing, parking, land use and transit alternatives stay unchanged.
- Peak spreading matters. Flexible work hours, school-time coordination, freight delivery windows and demand management can reduce the worst daily spikes.
- Public transport must be competitive, not symbolic. Rail, metro, bus rapid transit and priority lanes reduce congestion only when they are frequent, reliable and connected to where people actually live and work.
- Land-use planning is transport policy. Shorter distances between housing, jobs, schools and services reduce the number of unavoidable car trips.
FAQ
What does traffic congestion actually measure?
It measures how much urban road movement slows under real traffic conditions. In this ranking, the main metric is the average time needed to drive 10 km, which makes the result easy to understand as minutes lost in routine movement.
Is the most congested city always the worst city to live in?
No. A city can have severe road congestion but still offer strong public transport, walkable districts, high wages or good services. Congestion is one part of quality of life, not the whole picture.
Why do some rich cities still have bad traffic?
High-income cities often concentrate jobs, visitors, deliveries and services in dense areas where road space cannot expand easily. Wealth can increase travel demand faster than streets can absorb it.
Is commute time the same as traffic congestion?
No. Commute time includes distance, mode choice, housing patterns and workplace location. Congestion focuses on delay and slow movement, especially on roads. A long commute can happen in a city with moderate congestion if people live far from work.
Why can a smaller city rank above a megacity?
Smaller cities can suffer from weak network redundancy, narrow corridors, bridge bottlenecks, poor signal timing or rapid vehicle growth. Population size matters, but road design and travel demand patterns matter just as much.
Does good public transport reduce traffic congestion?
It can, but only when it is frequent, reliable and useful for daily trips. A strong metro or bus network gives people alternatives to driving, but congestion may remain high if freight, taxis, private cars and delivery vehicles still compete for limited road space.
Are app-based traffic datasets fully reliable?
They are very useful for comparing road travel speeds and delays, but they can overrepresent roads and users covered by navigation data. They should be read with local transport data, public transport usage, land-use context and infrastructure information.
Why is a 2026 page based on 2024–2025 traffic data?
Global city traffic datasets are usually published after the observed year ends. This 2026 page uses the TomTom Traffic Index 2025 release, which reflects observed 2024 traffic patterns, rather than predicting every trip made in 2026. Data date: 2024 observed traffic patterns.
Sources
- TomTom Traffic Index. Primary source frame for average 10 km travel time and congestion indicators used in this table. https://www.tomtom.com/traffic-index/
- TomTom Traffic Index ranking page. Used for comparable travel-time framing and source-method context. https://www.tomtom.com/traffic-index/ranking/
- INRIX Global Traffic Scorecard. Used as an additional reference for the economic interpretation of hours lost, delay and congestion costs. https://inrix.com/scorecard/
- International Transport Forum / OECD. Used for broader urban mobility policy context, including demand management, public transport and transport-system resilience. https://www.itf-oecd.org/
- World Bank Urban Transport and Urban Development resources. Used for background on urban mobility, transport access and city infrastructure constraints. https://www.worldbank.org/en/topic/transport