


Top 10 Countries for Fennel Production in 2025: A Comprehensive Analysis
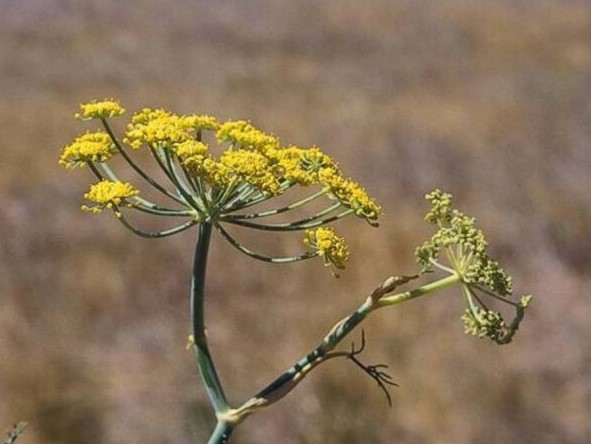
Fennel is grown for seeds, bulbs, and foliage, but the commercial market is dominated by seed production for spice processing, herbal products, and essential-oil use. This ranking compares the leading producing countries in 2025 using the latest available official data and cautious forward estimates where full current-year statistics are not yet published.
Thank you for reading this post, don't forget to subscribe!The top 10 countries account for most world fennel output. India remains the central producer by a wide margin, while the Mediterranean and wider MENA region remain important for export-quality seed and fresh-bulb supply.
Production figures are analytical estimates based on FAO historical data, national statistical releases, and trade-based cross-checks. Values are rounded for comparison.
Continue exploring
More StatRanker pages connected by topic, category or ranking theme.
Top 10 fennel producers in 2025: country-by-country overview
Asia is the main production centre, while the Mediterranean remains important for export-quality seed and fresh-bulb supply.
India is the clear global leader, producing more than half of world fennel output. Rajasthan and Gujarat remain especially important for seed production, and India's domestic market and export position both support the country's lead.
Egypt ranks a clear second. Its production base supports both domestic use and export demand, especially in seed markets serving Europe, the United States, and parts of Latin America.
China remains a major producer, with most output serving domestic food and traditional-medicine demand. That makes the country more important in production data than in export rankings.
Turkey produces both seed and bulb fennel. Its role is important because it combines Mediterranean growing conditions with access to both European and regional export markets.
Syria remains an important producer, although public data are less certain than for most other countries in the ranking. Output is still meaningful in regional trade despite long-term disruption to the agricultural sector.
Italy is one of the leading producers of Florence fennel, the bulb variety sold widely in European fresh markets. Its importance lies more in product type and market positioning than in seed volume alone.
Spain remains an important Mediterranean producer of both seed and bulb fennel. Its role is strengthened by organic production and stable access to European retail channels.
Iran remains relevant mainly through seed production tied to domestic food and herbal use, with a smaller export role in nearby regional markets.
Pakistan's production is still modest by global standards, but the country remains part of the Asian fennel belt and serves both domestic demand and nearby export markets.
Bulgaria is a smaller but relevant EU producer. Its main advantage is access to the European market rather than sheer production scale.
Chart 1. Fennel production by country, 2025 estimate (metric tons)
Estimated production in metric tons, 2025. Global total: ~280,000 MT. Values are rounded analytical estimates; see Methodology section for sources.
Table 1. Fennel production by country, 2025 estimate
Global total (2025 estimate): 280,000 MT. Share % is calculated as country production ÷ global total × 100. YoY refers to estimated change vs. 2024.
| Rank | Country | Region | Production (MT) | YoY Change | Key Product |
|---|---|---|---|---|---|
| 1 | India | Asia | 145,000 51.79% | +5.8% | Fennel seed |
| 2 | Egypt | MENA | 30,000 10.71% | +4.2% | Fennel seed (export) |
| 3 | China | Asia | 25,000 8.93% | +3.1% | Fennel seed / TCM |
| 4 | Turkey | MENA | 20,000 7.14% | +2.6% | Seed + bulb (organic) |
| 5 | Syria | MENA | 18,000 6.43% | −1.4% | Fennel seed (export) |
| 6 | Italy | Europe | 15,000 5.36% | +2.0% | Florence bulb (F1 hybrid) |
| 7 | Spain | Europe | 12,000 4.29% | +3.4% | Bulb + organic seed |
| 8 | Iran | MENA | 10,000 3.57% | +1.0% | Fennel seed / herbal |
| 9 | Pakistan | Asia | 8,000 2.86% | +4.0% | Fennel seed |
| 10 | Bulgaria | Europe | 6,000 2.14% | +3.2% | Seed + bulb (EU market) |
No matching countries found.
Source: FAO FAOSTAT (2020–2023 actuals), national agricultural ministry reports, industry estimates. 2025 figures are projections. Global total: 280,000 MT. Last updated: 2025.
Chart 2. Production share by country, 2025 (%)
The donut chart shows each country's estimated share of global fennel output. India's lead remains the central feature of the market structure.
Share based on estimated global total of 280,000 MT. "Others" includes all producers outside the top 10, estimated at ~11,000 MT (3.9%).
Methodology: how this ranking was built
Data year and sources
The 2025 figures in this ranking are analytical estimates based on FAO historical data, national statistical releases where available, and trade-based cross-checks. Because official current-year production data are often published with a lag, 2025 values should be read as structured estimates rather than final statistics.
Estimation approach
Where current-year official data were not available, the estimates were extended from the latest confirmed production base using recent trend patterns and country-specific adjustments. Figures are rounded to the nearest 1,000 MT.
Scope and coverage
The ranking includes both seed fennel and Florence fennel where national production structures justify that treatment. Small producers with limited global significance were excluded so the table stays focused on the main producing countries.
Limitations
- FAO and national fennel data often lag behind the current year, so projections involve uncertainty.
- Syria's figures carry higher uncertainty than most other countries in the ranking.
- PPP adjustment is not relevant here because the ranking is based on physical output, not value.
- Production is not the same as consumption or export performance.
Analytical insights: what the 2025 ranking reveals
1. India's structural dominance and its systemic risks
India's share means the fennel market is structurally concentrated. That matters because weather, cropping decisions, and policy changes in one country can influence the wider price environment.
2. The Mediterranean belt is upgrading, not just expanding
Italy and Spain matter less because of total volume than because of product type. Their strength is in fresh-bulb supply and higher-value segments of the European market.
3. China's quiet but significant role
China's role is easy to understate if the reader looks only at trade data. Much of its fennel output is absorbed domestically, which makes the country more important in production than in export visibility.
4. Syria as a resilience case study
Syria remains relevant mainly as a reminder that production geography can persist even under severe disruption, although the public data are much less certain than for most other producers.
5. Sustainability and climate as the industry's central challenge
Climate and water pressure remain the main long-term risks for several leading producers, especially in dry growing regions.
Key structural pattern: the fennel market is split between seed supply and fresh-bulb supply.
- A high-volume, low-cost seed segment dominated by India, Egypt, China, and Pakistan, serving spice processors, pharma, and essential-oil manufacturers.
- A lower-volume, premium fresh bulb segment dominated by Italy and Spain, serving European retail and food service.
- These two segments respond to different demand drivers and should not be interpreted as one uniform market.
What this means for you: interpreting the ranking in context
For food businesses and spice buyers
For buyers, the ranking highlights concentration risk. Heavy reliance on India means supply conditions in one country can affect wider pricing and sourcing decisions.
For investors and agri-commodity analysts
For investors and analysts, fennel remains a relatively small market, but demand is supported by food, herbal, and ingredient use. Premium and certified segments matter more than headline volume alone.
For policymakers in producing countries
For policymakers in smaller producing countries, the main challenge is not only yield growth but also market access, quality control, and traceability.
For consumers and food enthusiasts
For consumers, the ranking helps explain why seed fennel and bulb fennel often come from different countries and why supply conditions vary by product type.
Frequently asked questions about fennel production
Primary data sources and technical references
The figures in this ranking are harmonised estimates compiled from the sources below. They are rounded for cross-country comparison and should not be treated as final official statistics.
The primary source for historical fennel (and anise/fennel/badian/coriander combined)
production series by country, 2000–2023. Used as the baseline for forward projections.
Series: "Crops and livestock products" → "Anise, badian, coriander, cumin, caraway,
fennel and juniper berries".
https://www.fao.org/faostat/en/#data/QCL
Official Indian government data on spice production, area under cultivation, and export
statistics for fennel (saunf). Used to cross-check and calibrate FAO data for India.
Available from the Ministry of Commerce and Industry.
https://www.indianspices.com/statistics
U.S. import/export data for fennel, used to validate the export profiles of major
producing countries and cross-check volume estimates through trade-flow triangulation.
https://apps.fas.usda.gov/gats/default.aspx
Bilateral trade flows for HS code 090920 (fennel seeds) and HS 070960 (fresh fennel
bulbs). Used to infer production-consumption gaps and identify major export origins.
https://www.trademap.org/
Used for EU-level import data on fresh fennel (Italy and Spain production/export
cross-check) and to validate the organic segment growth figures for Mediterranean producers.
https://ec.europa.eu/info/food-farming-fisheries/farming/facts-and-figures/markets/overviews
Used only for broad market context and demand outlook. Any directional claims were checked against public-source material where possible.
FAO's semi-annual assessment of supply and demand conditions for spices and herbs.
Used for contextual information on climate impacts and production risk assessments
for South Asian and MENA producers.
https://www.fao.org/publications/home/fao-flagship-publications/food-outlook/en/
All numerical values in the tables and charts are rounded estimates. For formal procurement, policy, or investment use, the original datasets should be checked directly.
Related rankings
More StatRanker pages connected by topic, category or ranking theme.
StatRanker (Website)
administrator
