

Top 10 Olive Producing Countries in 2025
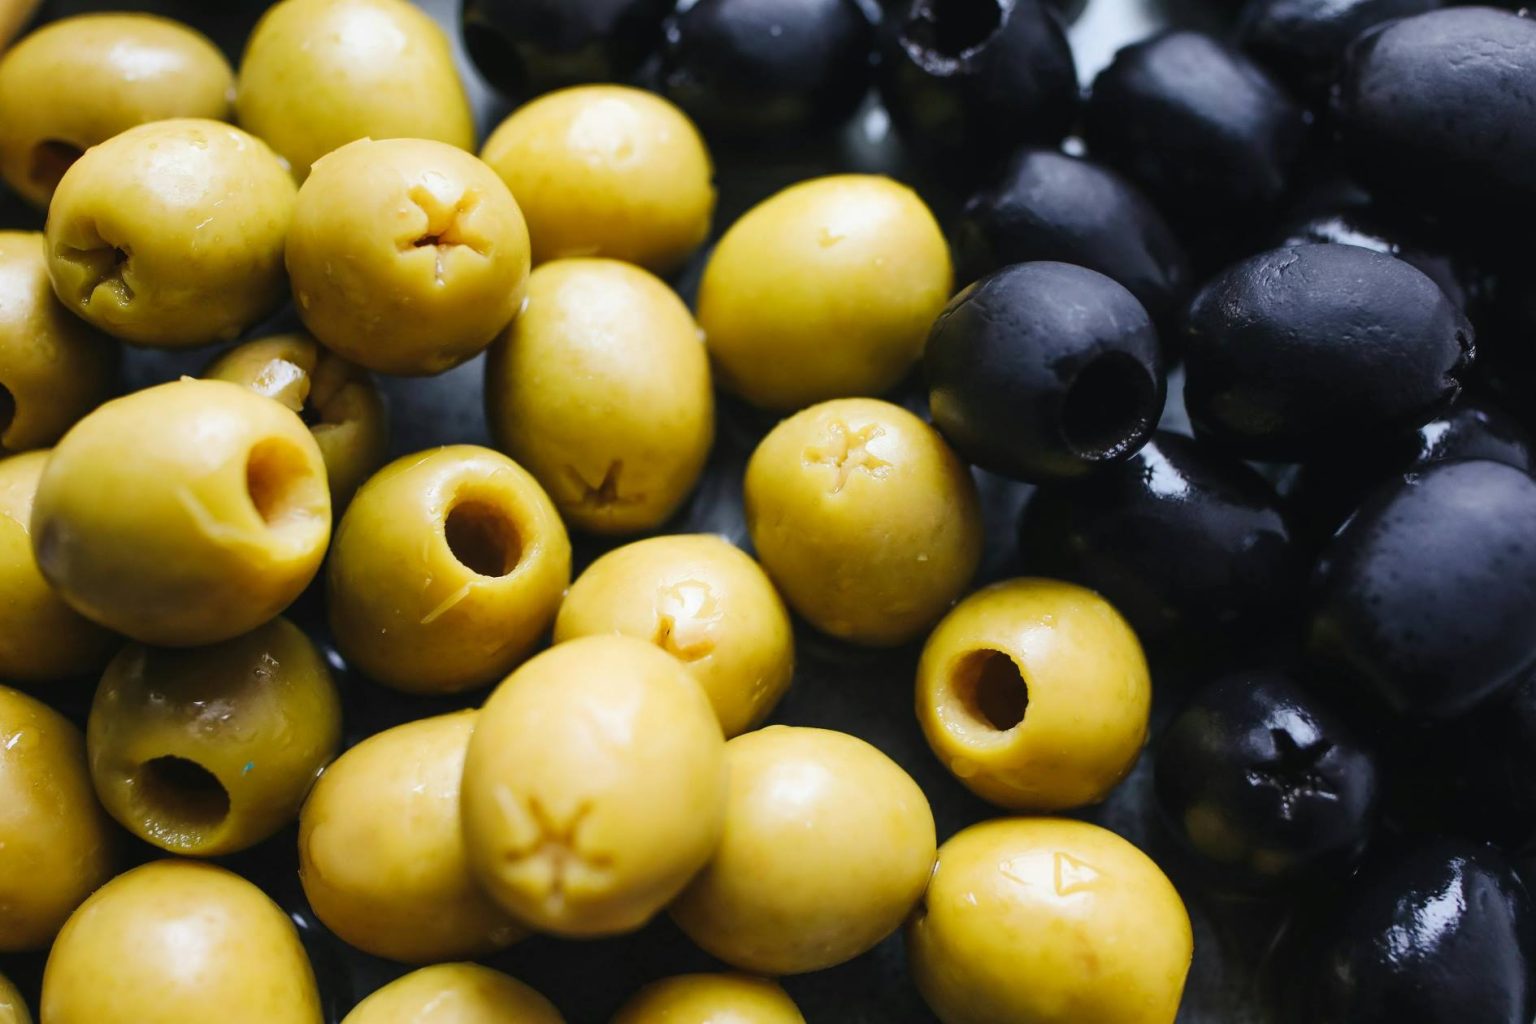
Top 10 Olive-Producing Countries in 2025: Retrospective Ranking Based on 2023 Production
Spain ranks first with 5.101 million tonnes of olive fruit produced in 2023. Greece ranks second at 2.4989 million tonnes, followed by Italy at 2.398 million tonnes.
The ranking answers the 2025 query retrospectively and does not represent the 2025 harvest. FAO's December 2024 agricultural-production release covered data through 2023. Nine ranking values are taken from a FAOSTAT-based comparison published on July 29, 2026; Greece is calculated from an official ELSTAT 2023 value using a unit conversion only.
The metric is harvested olive fruit, not olive oil production. The table is a compiled research dataset based on 4 sources, with row-level source and method notes shown in the ranking table.
Coverage: 10 countries. Unit: million tonnes (Mt). Direction: higher production ranks higher. Production year: 2023. Status counts: 1 calculated_value and 9 industry_observed_value; 0 official_forecast; 0 modeled_projection.
Highest 2023 olive-fruit production in the ranking.
Lowest value among the ten included countries.
Every row uses 2023 production.
Harvested olives, not processed olive oil.
Greece is a unit conversion from official ELSTAT data; nine rows are published secondary values.
Overview: What the Ranking Measures
Olive production here means harvested olive fruit. It does not measure olive oil, exports, crop value, harvested area or yield.
Fruit-production and olive-oil rankings can differ because oil output depends on processing volume and extraction yield.
Top 10 Olive-Producing Countries by 2023 Production
Spain leads by a wide margin. Greece and Italy rank second and third, followed by Türkiye, Portugal, Egypt, Tunisia, Morocco, Algeria and Syria.
Production year: 2023 · Unit: million tonnes · Higher value ranks higher
| Rank | Country | Production | Source / Method Note |
|---|---|---|---|
| 1 | Spain | 5.101 Mt | industry_observed_value · Monopteryx FAOSTAT-based comparison · 2023. |
| 2 | Greece | 2.4989 Mt | calculated_value Input: ELSTAT 2023 = 2,498.9 thousand tonnes. Formula: 2,498.9 ÷ 1,000 = 2.4989 Mt. Unit conversion only; not a forecast or projection. |
| 3 | Italy | 2.398 Mt | industry_observed_value · Monopteryx FAOSTAT-based comparison · 2023. |
| 4 | Türkiye | 1.520 Mt | industry_observed_value · Monopteryx FAOSTAT-based comparison · 2023. |
| 5 | Portugal | 1.195 Mt | industry_observed_value · Monopteryx FAOSTAT-based comparison · 2023. |
| 6 | Egypt | 1.185 Mt | industry_observed_value · Monopteryx FAOSTAT-based comparison · 2023. |
| 7 | Tunisia | 1.093 Mt | industry_observed_value · Monopteryx FAOSTAT-based comparison · 2023. |
| 8 | Morocco | 0.988 Mt | industry_observed_value · Monopteryx FAOSTAT-based comparison · 2023. |
| 9 | Algeria | 0.913 Mt | industry_observed_value · Monopteryx FAOSTAT-based comparison · 2023. |
| 10 | Syria | 0.697 Mt | industry_observed_value · Monopteryx FAOSTAT-based comparison · 2023. |
Monopteryx is the numeric source for nine rows and was published on July 29, 2026. It identifies FAOSTAT's Production: Crops and Livestock Products data and normalized bulk download as the underlying source. Greece uses official ELSTAT 2023 input converted from thousand tonnes to million tonnes.
Chart: Top 10 Countries by 2023 Olive Production
The bars use the same raw values as the ranking table, with Spain as the 100% reference length.
Methodology
Countries are ranked by harvested olive-fruit production in calendar year 2023. Higher production ranks higher. No production value is a forecast or modeled projection.
Metric and unit
Metric: olive-fruit production quantity. Unit used in the ranking: million tonnes. Olive oil, harvested area, exports, crop value and yield are excluded.
Why 2023
FAO's agricultural-production release dated December 19, 2024 covered data through 2023, making 2023 a relevant common-year benchmark for the 2025 ranking query.
Temporal interpretation
The page is retrospective. Nine secondary values are taken from a FAOSTAT-based comparison published on July 29, 2026, so the table is not presented as an immutable FAOSTAT snapshot from 2025.
Greece calculation
Official input: ELSTAT Annual Agricultural Survey 2023, olive production = 2,498.9 thousand tonnes. Formula: 2,498.9 ÷ 1,000 = 2.4989 million tonnes. Assumption: pure metric unit conversion only; no interpolation, estimation or rounding beyond the exact decimal conversion. Result status: calculated_value.
Other nine rows
Spain, Italy, Türkiye, Portugal, Egypt, Tunisia, Morocco, Algeria and Syria use the 2023 values published by Monopteryx in a FAOSTAT-based comparison. The source displays these values to 0.001 Mt.
Value status
Greece is calculated_value because the ranking converts the directly published ELSTAT input from thousand tonnes to million tonnes. The other nine rows are industry_observed_value because their displayed numeric values come from a published secondary comparison.
Conflicts and flags
Conflicting historical values are not averaged. No row-level FAO quality flag is assigned to the nine secondary rows without a directly verified row-level record.
Ranking and chart calculation
Rank uses the raw values in the table, descending. Chart width is calculated as each country's production divided by Spain's production, multiplied by 100.
Limits
A single-year production ranking does not measure olive quality, olive-oil output, processing efficiency, exports, profitability or long-term productive capacity.
Main Ranking: 2025 Retrospective Ranking Based on 2023 Olive Production
Search the ten entries, filter by region or source status, or change the sort order.
Production year: 2023 · Unit: million tonnes · Compiled source mode
| Rank | Country | Production | Source / Method Note |
|---|---|---|---|
| 1 | Spain | 5.101 Mt | industry_observed_value Monopteryx · FAOSTAT-based · 2023. |
| 2 | Greece | 2.4989 Mt | calculated_value Input: ELSTAT 2023, 2,498.9 thousand t. Formula: 2,498.9 ÷ 1,000 = 2.4989 Mt. Unit conversion only. |
| 3 | Italy | 2.398 Mt | industry_observed_value Monopteryx · FAOSTAT-based · 2023. |
| 4 | Türkiye | 1.520 Mt | industry_observed_value Monopteryx · FAOSTAT-based · 2023. |
| 5 | Portugal | 1.195 Mt | industry_observed_value Monopteryx · FAOSTAT-based · 2023. |
| 6 | Egypt | 1.185 Mt | industry_observed_value Monopteryx · FAOSTAT-based · 2023. |
| 7 | Tunisia | 1.093 Mt | industry_observed_value Monopteryx · FAOSTAT-based · 2023. |
| 8 | Morocco | 0.988 Mt | industry_observed_value Monopteryx · FAOSTAT-based · 2023. |
| 9 | Algeria | 0.913 Mt | industry_observed_value Monopteryx · FAOSTAT-based · 2023. |
| 10 | Syria | 0.697 Mt | industry_observed_value Monopteryx · FAOSTAT-based · 2023. |
Greece's 2.4989 Mt is a calculated unit conversion from an official 2023 ELSTAT input, not a forecast. The nine secondary rows retain the values displayed by Monopteryx at 0.001 Mt precision.
Insights From the Ranking
Key Insight
Spain leads at 5.101 Mt, about 2.602 Mt above second-ranked Greece.
Notable Pattern
Portugal and Egypt are nearly level at the displayed precision, at 1.195 Mt and 1.185 Mt respectively.
Regional Concentration
Southern Europe and Northern Africa each place four countries in the Top 10. Türkiye and Syria are the two Western Asian entries.
Outlier
Spain produces slightly more than twice the olive-fruit volume of Greece in this 2023 benchmark.
What This Ranking Means
The table compares physical olive-fruit production in one common year. It does not rank olive-oil output, exports, product quality or agricultural efficiency.
Source status describes provenance: Greece is derived by unit conversion from an official ELSTAT observation, while the other nine values are reproduced from a published FAOSTAT-based comparison.
Historical agricultural data can be revised, so comparisons with another source should account for both production year and publication or access date.
FAQ
Which country ranks first for olive production?
Spain ranks first with 5.101 million tonnes of olive fruit in the 2023 benchmark used for this retrospective ranking.
Are these 2025 harvest figures?
No. The page answers a 2025 ranking query using 2023 production data. It does not estimate the 2025 harvest.
Why use 2023 production?
FAO's December 19, 2024 agricultural-production release covered data through 2023, making 2023 a relevant common-year benchmark for the 2025 query.
Does olive production mean olive oil production?
No. This ranking measures harvested olive fruit. Olive oil is a processed product with a separate production measure.
Are all ten values directly published by official statistical agencies?
No. Greece is calculated from an official ELSTAT input by converting 2,498.9 thousand tonnes to 2.4989 million tonnes. The other nine values come from a FAOSTAT-based secondary comparison published by Monopteryx.
Why can another FAOSTAT-based source show a different historical value?
Historical agricultural series can be revised, and secondary publications may use different data vintages or display precision. The production year and source publication date should therefore be considered together.
How is rank determined?
Countries are sorted from highest to lowest by the raw 2023 production values in the ranking table. No forecast, average or growth model is used.
What does this ranking not measure?
It does not measure olive oil output, table-olive output, exports, crop value, harvested area, yield, quality, processing capacity or profitability.
Sources
FAO — Agricultural Production Statistics 2010–2023
Official release-timing source confirming that the December 19, 2024 agricultural-production update covered data through 2023.
https://www.fao.org/statistics/events/events-detail/agricultural-production-statistics-2010-2023/
FAO Data Catalog — Crop Production, Yield and Harvested Area
Official methodology source for FAOSTAT crop-production scope, production units, temporal coverage and data provenance.
https://data.fao.org/catalog/iso/d24a448b-3b62-4c09-8c1d-4a39bb599876
Hellenic Statistical Authority — Annual Agricultural Survey 2023
Official Greece input. ELSTAT reports 2,498.9 thousand tonnes of olives in 2023; the ranking converts this to 2.4989 Mt.
Monopteryx — FAOSTAT Olive Production Comparison
Numeric source for nine ranking rows. Published July 29, 2026; the table ranks countries by 2023 production and identifies FAOSTAT's Production: Crops and Livestock Products data and normalized bulk download as its underlying source.
https://www.monopteryx.com/blog/soybean-palm-olive-cropgrids
Related rankings
Closely related StatRanker pages selected by topic. If no strong match exists, fewer links are shown instead of unrelated recommendations.
