

Top 100 Countries by Water Stress Level, 2025
Kuwait ranks first among the most water-stressed countries in the latest official global data, followed by the United Arab Emirates and Saudi Arabia. This page brings together the full country ranking, the Top 20 distribution and the official SDG 6.4.2 methodology behind the numbers.
If you are looking for water stress by country or the most water-stressed countries in 2025, this is the comparable international snapshot to use. The ranking is based on the latest verified SDG 6.4.2 country observations published through the UN and FAO system, with most values reflecting 2020–2022 averages that still define the latest harmonized global picture in 2025.
Water stress measures how much freshwater a country withdraws relative to the renewable freshwater resources available, after environmental flow requirements are taken into account. It is one of the clearest cross-country indicators of structural water pressure and a useful companion to broader discussions of water scarcity, drought risk, food security and long-term development constraints.
Continue exploring
More StatRanker rankings on climate, environment, resources and sustainability.
Top 100 Countries by Total CO₂ Emissions, 2026 Snapshot
Open rankingCountries by Renewable Electricity Generation per Capita, 2025
Open rankingTop 100 Countries by PM2.5 Air Pollution (Annual Mean), 2025
Open rankingValues above 100% are possible. They usually mean that renewable freshwater alone cannot support current withdrawals, so the country depends heavily on fossil groundwater, desalination, transfers or other engineered supply solutions.
What stands out among the most water-stressed countries
The top of the table is dominated by arid and semi-arid countries in Western Asia and North Africa. Kuwait, the United Arab Emirates, Saudi Arabia, Libya and Qatar stand far above the rest because the denominator in this indicator is renewable freshwater, not total water actually made available through engineering, desalination or non-renewable aquifers.
The geography is not random. Countries with very low renewable water endowments, intense urban concentration, irrigated agriculture or energy-heavy development models tend to cluster in the highest stress bands. By contrast, many water-rich countries in Latin America, Sub-Saharan Africa and northern Europe appear much lower in the ranking even when they still face local or seasonal shortages.
The upper third of the ranking also shows that water stress is not limited to classic desert economies. Barbados, South Korea, Malta, Belgium, North Macedonia and Spain are in the high, medium or low stress bands because dense populations, limited freshwater storage, irrigation demand or industrial concentration can push pressure upward even in richer or wetter economies.
Top 10 at a glance
- #1 Kuwait — 3,850.50%
- #2 United Arab Emirates — 1,509.93%
- #3 Saudi Arabia — 974.17%
- #4 Libya — 817.14%
- #5 Qatar — 431.03%
- #6 Yemen — 169.76%
- #7 Algeria — 144.81%
- #8 Egypt — 141.17%
- #9 Turkmenistan — 135.21%
- #10 Bahrain — 133.71%
Top 20 countries by water stress level
Latest official SDG 6.4.2 observations, mostly reported as 2020–2022 averages and used here as the latest comparable 2025 reading.
Kuwait is not simply marginally more stressed than the rest of the field; it is an extreme outlier. That is why water policy there centers on desalination, groundwater depletion and system resilience rather than only incremental water-saving measures.
Most water-stressed countries: full Top 100 ranking
The table below shows the full country ranking for readers searching for water stress by country, water scarcity pressure by country or the latest official Top 100 list. Use the controls to search, filter and sort by country, region, stress band or ranking depth.
| Rank | Country | Water stress | Stress band |
|---|---|---|---|
| 1 | Kuwait | 3,850.50% | Critical |
| 2 | United Arab Emirates | 1,509.93% | Critical |
| 3 | Saudi Arabia | 974.17% | Critical |
| 4 | Libya | 817.14% | Critical |
| 5 | Qatar | 431.03% | Critical |
| 6 | Yemen | 169.76% | Critical |
| 7 | Algeria | 144.81% | Critical |
| 8 | Egypt | 141.17% | Critical |
| 9 | Turkmenistan | 135.21% | Critical |
| 10 | Bahrain | 133.71% | Critical |
| 11 | Israel | 129.67% | Critical |
| 12 | Syria | 124.36% | Critical |
| 13 | Uzbekistan | 121.84% | Critical |
| 14 | Sudan | 118.66% | Critical |
| 15 | Oman | 116.71% | Critical |
| 16 | Pakistan | 109.99% | Critical |
| 17 | Jordan | 105.20% | Critical |
| 18 | Tunisia | 98.11% | High |
| 19 | Sri Lanka | 90.79% | High |
| 20 | Barbados | 87.50% | High |
| 21 | South Korea | 85.22% | High |
| 22 | Iran | 81.29% | High |
| 23 | Eswatini | 77.56% | High |
| 24 | Malta | 72.60% | Medium |
| 25 | Tajikistan | 69.94% | Medium |
| 26 | South Africa | 67.60% | Medium |
| 27 | India | 66.49% | Medium |
| 28 | Armenia | 61.97% | Medium |
| 29 | Cape Verde | 59.68% | Medium |
| 30 | Iraq | 59.58% | Medium |
| 31 | Lebanon | 58.79% | Medium |
| 32 | Azerbaijan | 57.53% | Medium |
| 33 | Afghanistan | 54.76% | Medium |
| 34 | North Macedonia | 52.55% | Medium |
| 35 | Belgium | 51.88% | Medium |
| 36 | St. Kitts and Nevis | 50.83% | Medium |
| 37 | Morocco | 50.75% | Medium |
| 38 | Kyrgyzstan | 50.04% | Medium |
| 39 | Palestine | 48.11% | Low |
| 40 | Zimbabwe | 46.09% | Low |
| 41 | Mexico | 44.95% | Low |
| 42 | Solomon Islands | 44.70% | Low |
| 43 | Turkey | 44.10% | Low |
| 44 | Spain | 43.25% | Low |
| 45 | China | 41.52% | Low |
| 46 | Bulgaria | 40.24% | Low |
| 47 | Dominican Republic | 39.55% | Low |
| 48 | Japan | 36.64% | Low |
| 49 | Germany | 35.35% | Low |
| 50 | Kazakhstan | 34.63% | Low |
| 51 | Singapore | 33.26% | Low |
| 52 | Kenya | 33.24% | Low |
| 53 | Poland | 32.49% | Low |
| 54 | Ethiopia | 32.26% | Low |
| 55 | Cyprus | 30.48% | Low |
| 56 | Italy | 29.77% | Low |
| 57 | Indonesia | 29.70% | Low |
| 58 | Timor-Leste | 28.27% | Low |
| 59 | United States | 28.16% | Low |
| 60 | Philippines | 27.83% | Low |
| 61 | North Korea | 27.74% | Low |
| 62 | Denmark | 25.27% | Low |
| 63 | Somalia | 24.53% | No stress |
| 64 | Cuba | 23.94% | No stress |
| 65 | Thailand | 23.01% | No stress |
| 66 | Mauritius | 22.97% | No stress |
| 67 | Czechia | 21.97% | No stress |
| 68 | France | 21.38% | No stress |
| 69 | Greece | 20.33% | No stress |
| 70 | Trinidad and Tobago | 20.33% | No stress |
| 71 | Rwanda | 20.20% | No stress |
| 72 | Viet Nam | 18.13% | No stress |
| 73 | Malawi | 17.50% | No stress |
| 74 | Netherlands | 16.66% | No stress |
| 75 | Senegal | 16.28% | No stress |
| 76 | Maldives | 15.67% | No stress |
| 77 | United Kingdom | 14.35% | No stress |
| 78 | St. Lucia | 14.30% | No stress |
| 79 | Haiti | 13.38% | No stress |
| 80 | Mauritania | 13.25% | No stress |
| 81 | Estonia | 13.05% | No stress |
| 82 | Tanzania | 12.96% | No stress |
| 83 | Moldova | 12.56% | No stress |
| 84 | Jamaica | 12.38% | No stress |
| 85 | Portugal | 12.32% | No stress |
| 86 | El Salvador | 12.09% | No stress |
| 87 | Uruguay | 12.05% | No stress |
| 88 | Madagascar | 11.26% | No stress |
| 89 | Eritrea | 11.18% | No stress |
| 90 | Niger | 11.02% | No stress |
| 91 | Argentina | 10.46% | No stress |
| 92 | Burundi | 10.19% | No stress |
| 93 | Dominica | 10.00% | No stress |
| 94 | Vanuatu | 10.00% | No stress |
| 95 | Nigeria | 9.67% | No stress |
| 96 | Chile | 8.98% | No stress |
| 97 | Austria | 8.68% | No stress |
| 98 | Antigua and Barbuda | 8.46% | No stress |
| 99 | Nepal | 8.31% | No stress |
| 100 | Hungary | 8.11% | No stress |
Source base: official SDG 6.4.2 country data published through the UN/FAO SDG 6 portal. Most values reflect 2020–2022 averages; a smaller number of countries still use single-year observations. Regional aggregates and non-sovereign territories were excluded so the table remains a country ranking.
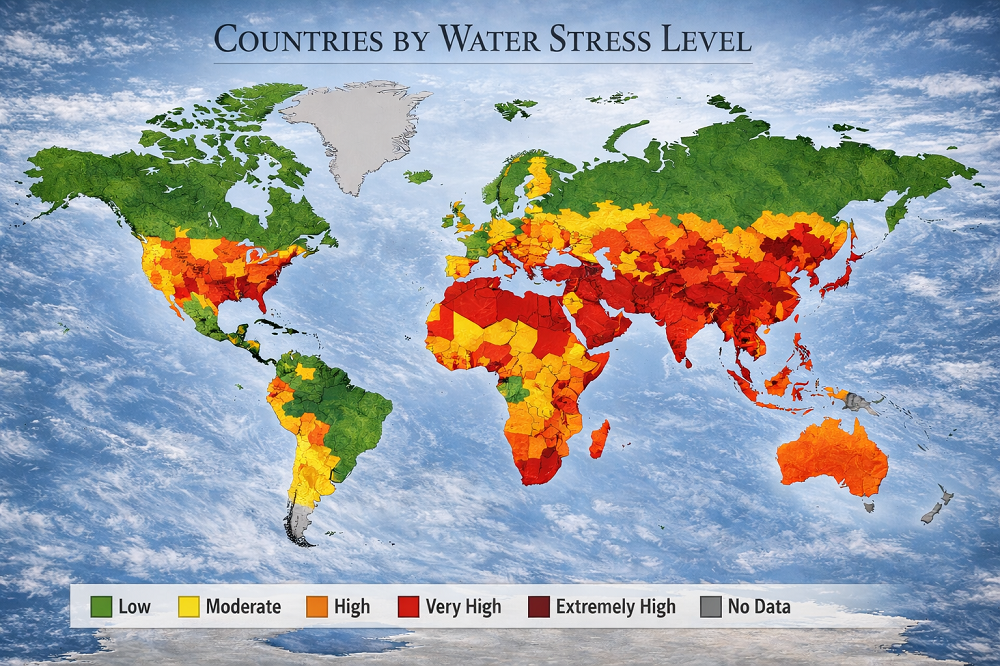
Regional pattern in the official SDG data
Regional averages explain why the global figure can look manageable while the local risks remain severe. Northern Africa and Western Asia is far above every other region, and Central and Southern Asia also sits deep in the danger zone. Europe and Northern America, Latin America and the Caribbean, and most of Oceania are much lower on average, though local basins inside those regions can still face extreme pressure.
Methodology
This ranking uses the official SDG 6.4.2 indicator: level of water stress, defined as freshwater withdrawal as a proportion of available renewable freshwater resources, after accounting for environmental flow requirements. In plain English, it asks how heavily a country is drawing on the renewable freshwater base that can be used without stripping ecosystems of the water they need.
This ranking uses the latest country observations available in the UN/FAO SDG 6 data system. For most countries, the portal reports a 2020–2022 average rather than a single 2022 point. A smaller number of countries still rely on a single-year value, usually 2020 or 2022. Since internationally harmonized 2025 measurements are not yet available, the latest official values remain the most reliable basis for cross-country comparison.
To keep the ranking focused on countries, regional aggregates such as “World”, “Central and Southern Asia” and “Europe and Northern America” were removed, along with non-sovereign territories. Values were rounded to two decimals, but the ordering is otherwise preserved from the official indicator values.
The stress bands follow the official SDG portal thresholds: 0–25% means no stress, more than 25–50% low stress, more than 50–75% medium stress, more than 75–100% high stress, and above 100% critical stress. These bands are useful for comparison, but they should not be read as a complete risk score on their own.
There are important limitations. First, national averages can hide basin-level crises inside otherwise moderate countries. Second, the indicator is about withdrawals versus renewable resources, so countries that use desalination or mine fossil groundwater can post extremely high readings. Third, water quality, storage infrastructure, allocation rules and seasonal variability are not fully captured by a single national percentage. This makes the ranking useful for international comparison, but incomplete for local water planning.
Key insights from the global water stress ranking
- The highest-stress group is overwhelmingly concentrated in dry, import-dependent and highly engineered water systems. Western Asia and North Africa dominate the upper end because renewable water resources are structurally scarce relative to demand.
- Values above 100% are a warning about system dependence, not a statistical mistake. In countries such as Kuwait, the UAE and Saudi Arabia, the indicator is telling you that renewable water alone cannot support the current level of withdrawals.
- Asia has the widest spread. It includes both the highest-stress states in the world and large countries with moderate or low stress levels. That reflects very different climates, water infrastructures, irrigation patterns and policy choices across the continent.
- Europe is mostly outside the top danger zone, but not immune. Malta, Belgium, Spain, Cyprus and Italy remind readers that density, tourism, irrigation and industrial use can push water pressure higher even in advanced economies.
- Agriculture remains the structural pressure point. The latest UN reporting says agriculture accounted for 72% of total global withdrawals in 2022, so irrigation efficiency, crop selection and basin governance matter far more than household water-saving campaigns alone.
- Moderate national stress does not guarantee local security. UN guidance also emphasizes subnational variation, because river basins, aquifers and urban systems can face severe shortages even when the national average still looks manageable.
Why this water stress ranking matters in real life
Water stress is not an abstract environmental number. It affects food prices, electricity systems, industrial reliability, urban growth, public budgets and long-term investment risk. Countries under heavy water stress usually face sharper trade-offs between farms, cities, energy generation and ecosystem protection.
For households, higher water stress can translate into more volatile utility costs, tighter drought restrictions, weaker resilience during heat waves and greater pressure on local food systems. For businesses, it raises the risk of supply disruption, regulatory tightening and higher infrastructure spending. For investors and policy watchers, it is a useful forward-looking signal: countries high in this ranking often need more spending on storage, reuse, leakage control, desalination, irrigation reform and demand management.
It also matters for migration and urban planning. Places that combine rapid population growth with a high water-stress ratio are more likely to face pressure on housing, sanitation, agriculture and public health. Not every high-stress country is on the verge of crisis, but water availability has clearly become a central constraint on development strategy.
FAQ
What does a water stress value of 100% actually mean?
It means annual freshwater withdrawals are roughly equal to the renewable freshwater resources available after environmental flow requirements are accounted for. In practice, that leaves very little buffer for drought, growth or ecological needs.
How can a country have more than 100% water stress?
Because the indicator compares withdrawals with renewable freshwater, not with every possible water source. Countries can exceed 100% when they rely on desalination, fossil groundwater, imported water or other heavily engineered supply systems.
Why are Kuwait, the UAE and Saudi Arabia so far above the rest?
Their renewable freshwater base is extremely small relative to demand. Once urban demand, industrial use, cooling, landscaping and agriculture are added, the ratio rises very quickly even before desalination and groundwater depletion are taken into account.
Does a country below 25% have no water problem?
No. It only means the national withdrawal ratio is relatively low by this indicator. A country can still face seasonal drought, regional groundwater depletion, poor water quality, weak storage capacity or major urban shortages in specific basins.
Why use 2020–2022 data for a 2025 ranking?
Because this is the latest internationally harmonized official country data available in the SDG 6 system. Using the latest verified snapshot keeps the ranking comparable across countries while newer harmonized values are still unavailable.
Why is agriculture so important in this topic?
Agriculture remains the largest freshwater user worldwide. According to the latest UN reporting, it accounted for 72% of total withdrawals in 2022. That is why irrigation efficiency and crop patterns matter far more than focusing only on domestic taps and household behavior.
Is water stress the same thing as water scarcity?
Not exactly. Water stress is a measurable withdrawal-pressure indicator. Water scarcity is broader and can include infrastructure gaps, poor governance, pollution, storage limits, seasonal swings and unequal access. Water stress is one of the best comparable pieces of that bigger picture, but it is not the whole picture.
Sources
-
UN SDG 6 Data Portal — Indicator 6.4.2. Primary country dataset used for the ranking, including the latest official country values and regional aggregates.
https://sdg6data.org/en/indicator/6.4.2 -
UN-Water — Indicator 6.4.2 methodology page. Official definition of the indicator and explanation of what it measures.
https://www.unwater.org/our-work/sdg-6-integrated-monitoring-initiative/indicator-642-level-water-stress-freshwater -
The Sustainable Development Goals Extended Report 2025, Goal 6. Used for the latest global and regional interpretation, including the 18% world figure and the role of agriculture in total withdrawals.
https://unstats.un.org/sdgs/report/2025/extended-report/Extended-Report-2025_Goal-6.pdf -
FAO SDG Data Portal — 6.4.2 Water stress. Official FAO indicator landing page for the same SDG metric.
https://www.fao.org/sustainable-development-goals-data-portal/data/indicators/642-water-stress/en -
World Bank indicator ER.H2O.FWST.ZS. World Bank republication of the AQUASTAT-based water stress series, useful for cross-checking country trends and metadata lineage.
https://data.worldbank.org/indicator/ER.H2O.FWST.ZS -
UN SDG Metadata for indicator 6.4.2. Technical metadata explaining construction, interpretation and reporting of the indicator.
https://unstats.un.org/sdgs/metadata/files/metadata-06-04-02.pdf
Related rankings
More StatRanker rankings on climate, environment, resources and sustainability.
Top 100 Countries by Annual CO₂ Emissions per Capita, 2025
Open rankingTop 100 Countries by Share of Renewable Energy in Power Generation, 2025
Open rankingTop 100 Countries by Climate Risk Index (Heat, Floods, Storms), 2025
Open rankingExtreme Weather Disaster Pressure by Country: Exposure Patterns, Risks and Resilience
Open rankingStatRanker (Website)
administrator
