


Top 100 Countries by Corruption Perceptions Index, 2025
Corruption Perceptions Index 2025: where the cleanest public sectors still stand apart
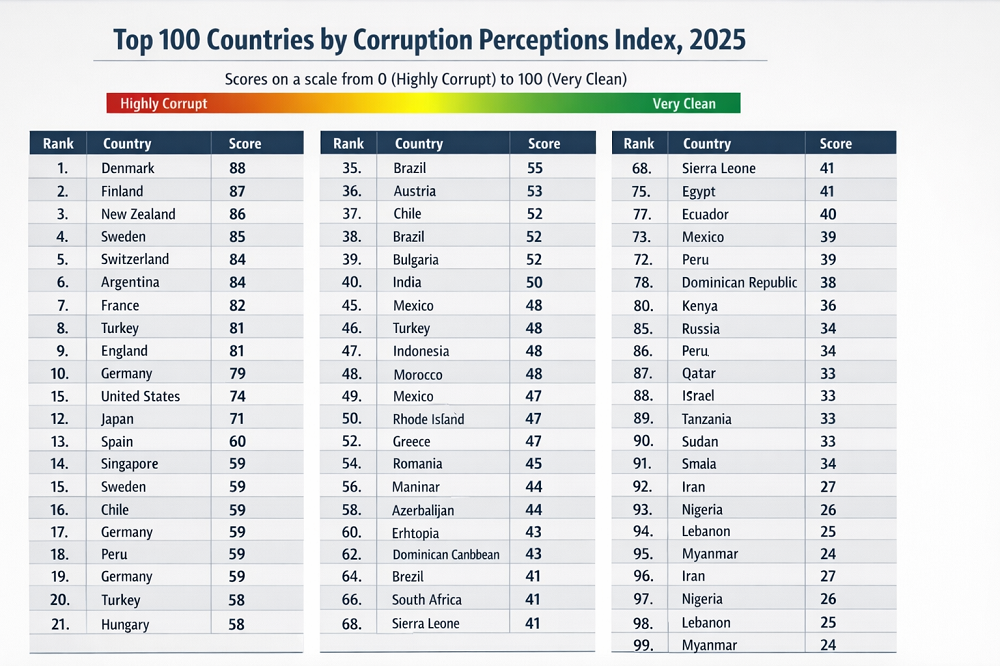
The Corruption Perceptions Index is the most widely used global ranking of perceived public-sector corruption. A higher score means cleaner institutions, stronger enforcement and fewer signals that political access can buy outcomes. For the 2025 edition, Transparency International scored 182 countries and territories on a 0–100 scale, where 0 is highly corrupt and 100 is very clean.
Thank you for reading this post, don't forget to subscribe!This page focuses on the Top 100 countries by CPI score in 2025. In practice, readers usually want three things from this ranking: who leads, where the score gaps start to widen, and how far large economies are from the highest-scoring group.
Top 10 countries by Corruption Perceptions Index, 2025
The top of the table is concentrated in Northern and Western Europe, with a smaller Asia-Pacific group also scoring very highly. What separates these countries is not only lower bribery risk in the public sector, but also stronger oversight, more predictable enforcement, and higher administrative capacity.
Denmark remains the benchmark. Its score reflects deep institutional trust, strong public administration and comparatively low tolerance for opaque decision-making in government.
Finland stays near the ceiling of the index. Its position shows how durable integrity systems can be when rule of law, media freedom and administrative professionalism reinforce one another.
Singapore is the highest-scoring Asian economy. It combines strong enforcement, efficient state capacity and a business environment where public-sector integrity remains central to competitiveness.
New Zealand continues to score at a very high level. Its position shows how durable clean-government outcomes can be when institutional trust and administrative quality remain strong.
Norway shows how a resource-rich country can still remain near the top when transparency, public scrutiny and strong procurement and audit systems are part of the institutional core.
Sweden remains in the elite group. Its score also shows that high-performing democracies still need constant enforcement and political-integrity safeguards to stay there.
Switzerland’s position reflects stable institutions and administrative quality, although the CPI does not capture every integrity risk tied to global finance and cross-border money flows.
Luxembourg stays in the upper echelon. Its result reflects strong public-sector integrity, even though separate debates about international finance and transparency continue outside the CPI framework.
The Netherlands remains comfortably inside the global top 10. Its score reflects institutional depth rather than one-off anti-corruption campaigns.
Germany rounds out the top 10. This matters because it shows that large and complex economies can still achieve very high integrity scores, not only smaller states with simpler administrative structures.
Table 1. Top 10 countries by CPI score
| Rank | Country | Score | Region |
|---|---|---|---|
| 1 | Denmark | 89 | Europe |
| 2 | Finland | 88 | Europe |
| 3 | Singapore | 84 | Asia-Pacific |
| 4 | New Zealand | 81 | Asia-Pacific |
| 4 | Norway | 81 | Europe |
| 6 | Sweden | 80 | Europe |
| 6 | Switzerland | 80 | Europe |
| 8 | Luxembourg | 78 | Europe |
| 8 | Netherlands | 78 | Europe |
| 10 | Germany | 77 | Europe |
Rank numbers follow the official tied-score method. Countries with the same score share the sam
Chart 1. Top 20 CPI scores in 2025
The shape matters more than the exact order inside ties. There is a clear premium for countries that combine clean procurement, credible courts, administrative professionalism and sustained political accountability.
Methodology
This page uses the official Corruption Perceptions Index 2025 from Transparency International. CPI is not a direct count of bribes or court convictions. It is a composite perception-based measure built from multiple expert and business surveys, then standardised to a 0–100 scale and aggregated into a country score. Countries are included only when there are enough underlying sources to meet Transparency International’s methodology threshold.
For this ranking page, the working unit is the official 2025 CPI score. The article sorts countries from highest to lowest score, preserves tied ranks, and uses broad regional labels only for on-page filtering and interpretation. No JS is used to generate the rows themselves; the table remains visible in raw HTML. The chart is a visual layer only.
The main limitation is the one inherent to CPI itself: it measures perceived public-sector corruption, not every form of private misconduct, not every informal payment, and not every integrity risk tied to offshore finance, lobbying or state capture. It is best read as a high-quality governance signal, not as a complete moral scorecard for a country.
Key insights
The first clear pattern is concentration at the top. The highest scores still belong mainly to mature democracies and highly institutionalised administrations. Europe remains overrepresented, while Asia-Pacific contributes a smaller but still important group led by Singapore, New Zealand, Australia, Japan, and Hong Kong.
The second pattern is how quickly the threshold falls once the table moves below the low 70s. The raw point differences are not huge, but they often correspond to meaningful gaps in procurement quality, judicial independence, political-finance controls, and enforcement credibility.
The third point is that income does not guarantee a top score. Several wealthy states remain below the cleanest tier, while some smaller countries do better because institutional rules are applied more consistently. CPI therefore tracks governance quality more closely than headline GDP.
What this means for the reader
For investors, a stronger CPI score usually signals lower friction in permits, procurement, and other state-facing operations. It does not remove political risk, but it often reduces the everyday uncertainty that delays projects and raises compliance costs.
For migrants, international students, and remote professionals, CPI can also serve as a practical proxy for how predictable public systems may feel in daily life: licensing, municipal paperwork, dispute resolution, tax administration, and interaction with regulators.
For broader country comparison, CPI works best alongside rule-of-law, democracy, press-freedom, and human-development indicators. It adds institutional context rather than replacing those measures.
FAQ
Why is Denmark still number one?
Because the countries at the top usually combine strong courts, transparent public administration, lower tolerance for conflicts of interest, and a political culture in which integrity rules are actually enforced.
Does a higher CPI score mean there is no corruption?
No. It means the public sector is perceived as cleaner. Even top-scoring countries can still face major integrity issues, especially around cross-border finance, lobbying, campaign money or foreign proceeds of corruption.
Is CPI about real corruption or only opinions?
CPI is a perception-based composite built from expert and business assessments. That is a limitation, but it is also why the index remains useful where directly comparable corruption counts do not exist.
Why are rich countries not always at the top?
Because wealth alone does not guarantee clean institutions. Administrative quality, judicial independence, public scrutiny and enforcement discipline matter more than headline income.
What score is considered good?
There is no formal cutoff, but a score above 70 usually indicates a stronger integrity environment. Around 50 suggests mixed performance. Below 40 often points to deeper institutional weaknesses and higher public-sector corruption risk.
Can I use CPI to judge investment risk?
Yes, but not alone. It is useful as a first-pass governance filter. For real decisions, pair it with rule of law, political stability, enforcement quality, sanctions exposure and sector-specific regulatory risk.
Why are some countries missing from older editions or regional comparisons?
Transparency International only includes countries that meet the minimum source threshold. If there are not enough qualifying sources, a country cannot be scored in that edition.
Full Top 100 CPI table
The full table below keeps all 100 rows directly in the HTML. With JavaScript enabled, readers can search by country, sort by score or name, filter by broad region and switch between Top 10, Top 20 and all 100 visible rows. Without JavaScript, the full table still remains readable.
Default interactive view: Top 20. Official rank numbers are preserved in the first column, including ties.
| Rank | Country | Score | Region |
|---|---|---|---|
| 1 | Denmark | 89 | Europe |
| 2 | Finland | 88 | Europe |
| 3 | Singapore | 84 | Asia-Pacific |
| 4 | New Zealand | 81 | Asia-Pacific |
| 4 | Norway | 81 | Europe |
| 6 | Sweden | 80 | Europe |
| 6 | Switzerland | 80 | Europe |
| 8 | Luxembourg | 78 | Europe |
| 8 | Netherlands | 78 | Europe |
| 10 | Germany | 77 | Europe |
| 10 | Iceland | 77 | Europe |
| 12 | Australia | 76 | Asia-Pacific |
| 12 | Estonia | 76 | Europe |
| 12 | Hong Kong | 76 | Asia-Pacific |
| 12 | Ireland | 76 | Europe |
| 16 | Canada | 75 | Americas |
| 17 | Uruguay | 73 | Americas |
| 18 | Bhutan | 71 | Asia-Pacific |
| 18 | Japan | 71 | Asia-Pacific |
| 20 | United Kingdom | 70 | Europe |
| 21 | Austria | 69 | Europe |
| 21 | Belgium | 69 | Europe |
| 21 | United Arab Emirates | 69 | MENA |
| 24 | Barbados | 68 | Americas |
| 24 | Seychelles | 68 | Africa |
| 24 | Taiwan | 68 | Asia-Pacific |
| 27 | France | 66 | Europe |
| 28 | Lithuania | 65 | Europe |
| 29 | Bahamas | 64 | Americas |
| 29 | United States | 64 | Americas |
| 31 | Brunei Darussalam | 63 | Asia-Pacific |
| 31 | Chile | 63 | Americas |
| 31 | South Korea | 63 | Asia-Pacific |
| 31 | Saint Vincent and the Grenadines | 63 | Americas |
| 35 | Cabo Verde | 62 | Africa |
| 35 | Israel | 62 | MENA |
| 37 | Dominica | 60 | Americas |
| 37 | Latvia | 60 | Europe |
| 39 | Czechia | 59 | Europe |
| 39 | Saint Lucia | 59 | Americas |
| 41 | Botswana | 58 | Africa |
| 41 | Qatar | 58 | MENA |
| 41 | Rwanda | 58 | Africa |
| 41 | Slovenia | 58 | Europe |
| 45 | Saudi Arabia | 57 | MENA |
| 46 | Costa Rica | 56 | Americas |
| 46 | Grenada | 56 | Americas |
| 46 | Portugal | 56 | Europe |
| 49 | Cyprus | 55 | Europe |
| 49 | Fiji | 55 | Asia-Pacific |
| 49 | Spain | 55 | Europe |
| 52 | Italy | 53 | Europe |
| 52 | Poland | 53 | Europe |
| 54 | Malaysia | 52 | Asia-Pacific |
| 54 | Oman | 52 | MENA |
| 56 | Bahrain | 50 | MENA |
| 56 | Georgia | 50 | Europe |
| 56 | Greece | 50 | Europe |
| 56 | Jordan | 50 | MENA |
| 60 | Malta | 49 | Europe |
| 61 | Mauritius | 48 | Africa |
| 61 | Slovakia | 48 | Europe |
| 63 | Croatia | 47 | Europe |
| 63 | Vanuatu | 47 | Asia-Pacific |
| 65 | Armenia | 46 | Europe |
| 65 | Kuwait | 46 | MENA |
| 65 | Montenegro | 46 | Europe |
| 65 | Namibia | 46 | Africa |
| 65 | Senegal | 46 | Africa |
| 70 | Benin | 45 | Africa |
| 70 | Romania | 45 | Europe |
| 70 | São Tomé and Príncipe | 45 | Africa |
| 73 | Jamaica | 44 | Americas |
| 73 | Solomon Islands | 44 | Asia-Pacific |
| 73 | Timor-Leste | 44 | Asia-Pacific |
| 76 | China | 43 | Asia-Pacific |
| 76 | Côte d’Ivoire | 43 | Africa |
| 76 | Ghana | 43 | Africa |
| 76 | Kosovo | 43 | Europe |
| 80 | Moldova | 42 | Europe |
| 81 | South Africa | 41 | Africa |
| 81 | Trinidad and Tobago | 41 | Americas |
| 81 | Vietnam | 41 | Asia-Pacific |
| 84 | Bulgaria | 40 | Europe |
| 84 | Burkina Faso | 40 | Africa |
| 84 | Cuba | 40 | Americas |
| 84 | Guyana | 40 | Americas |
| 84 | Hungary | 40 | Europe |
| 84 | North Macedonia | 40 | Europe |
| 84 | Tanzania | 40 | Africa |
| 91 | Albania | 39 | Europe |
| 91 | India | 39 | Asia-Pacific |
| 91 | Maldives | 39 | Asia-Pacific |
| 91 | Morocco | 39 | MENA |
| 91 | Tunisia | 39 | MENA |
| 96 | Ethiopia | 38 | Africa |
| 96 | Kazakhstan | 38 | Asia-Pacific |
| 96 | Suriname | 38 | Americas |
| 99 | Colombia | 37 | Americas |
| 99 | Dominican Republic | 37 | Americas |
Source: Transparency International, CPI 2025 map and index. Updated for publication using the official 2025 release.
Figure 2. How quickly the score falls across the Top 100
This chart is useful because it shows the curve, not just the leaders. The drop from the top tier into the 70s is noticeable, but the bigger structural story is what happens below the mid-table: many countries cluster in the 50s, 40s and high 30s, which means small point differences can still separate very different institutional realities.
How to read the 2025 CPI hierarchy
The 2025 table shows a consistent institutional pattern. Countries at the top are not simply “less corrupt” in a broad moral sense. They usually have stronger audit capacity, more stable procurement rules, more credible investigative frameworks, lower tolerance for political interference in state institutions, and more room for civic scrutiny.
The opposite pattern also matters. Once scores fall into the 30s and below, the issue is usually not one scandal but a wider institutional problem: weaker checks and balances, selective enforcement, politicised administration, reduced media freedom, or a state apparatus that does not consistently constrain insiders. That is why CPI is most useful alongside democracy, rule-of-law, and investment-climate measures.
One practical takeaway is that the middle of the table is crowded. Many countries are separated by only a few points. That does not make them equivalent: even small score changes can reflect meaningful differences in trust, enforcement credibility, and the practical reliability of public institutions.
Policy takeaways
- For governments near the top, the main task is to protect enforcement quality and institutional independence from gradual political erosion.
- For middle-ranking states, progress usually depends less on headline campaigns and more on procurement transparency, judicial credibility, budget oversight, and political-finance controls.
- For investors and firms, CPI works best as a first-screen governance metric before deeper legal and regulatory due diligence.
- For citizens, journalists, and civil-society groups, the index is a practical benchmarking tool for testing whether anti-corruption promises are visible in long-run institutional perception.
- For cross-country analysis, CPI should be read together with rule of law, media freedom, democracy quality, state capacity, and income levels rather than in isolation.
Sources
Main official landing page with the 2025 CPI overview, headline findings and materials.
https://www.transparency.org/en/cpi/2025Official score map used to verify the country scores presented on this page.
https://files.transparencycdn.org/images/CPI2025_Map-plus-Index_EN_2026-02-10-062334_ihry.pdfFull analytical report with the 2025 global findings and regional interpretation.
https://files.transparencycdn.org/images/CPI-2025-Report-EN.pdfMethodology note explaining source selection, standardisation and aggregation into the CPI score.
https://files.transparencycdn.org/images/CPI2025_TechnicalMethodology.pdfUseful complementary governance dataset for readers comparing CPI with broader institutional quality measures.
https://info.worldbank.org/governance/wgi/StatRanker (Website)
administrator
