


Top 100 Origin Countries by Emigrants Abroad, 2025
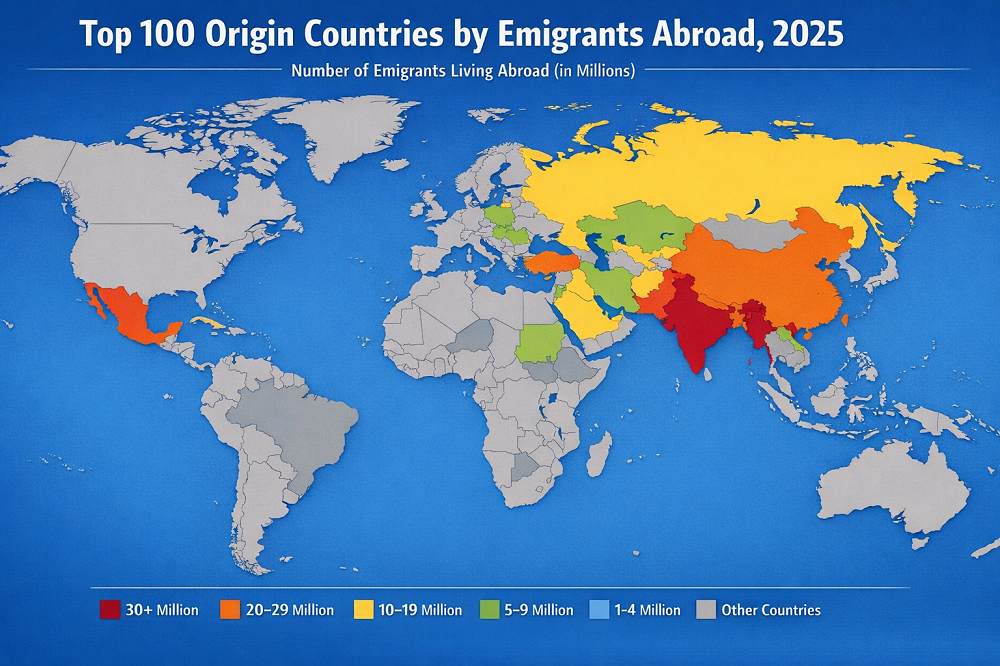
This page ranks emigrants abroad as a stock measure: people born in one country who are living outside it at a given point in time. That is why it should be read differently from net migration, asylum flows or one-year departure estimates. A country can rank high because it has built large overseas communities over decades, because it has absorbed a major displacement shock, or because both stories are true at once. For a 2025 comparison, the most defensible global benchmark is the UN DESA International Migrant Stock 2024 revision, used here as the latest full-year proxy. The result is a map of diaspora scale: where overseas populations are largest, where crises have rapidly expanded them, and where labor, family, and education pathways have become structurally embedded.iv class="sr-badges"> Latest official base: mid-2024 Proxy year used for page: 2025 World migrant stock: 304,020,000 Top 100 coverage: 87.26%
Thank you for reading this post, don't forget to subscribe!The top 10 origin countries alone account for 33.29% of all international migrants worldwide. That degree of concentration means any serious discussion of diaspora scale begins with a relatively small group of very large origin countries.
The top 20 account for 48.45% of the world total. In other words, nearly half of global migrant stock is tied to just twenty origins, even though the underlying UN dataset covers 233 countries and areas.
Continue exploring
More StatRanker pages connected by topic, category or ranking theme.
TOP 10 Origin Countries by Number of Emigrants Abroad (2025)
Open rankingTop 10 origin countries by emigrants abroad
The firThe first ten positions reflect several migration patterns at once.a, China and Mexico sit high because very large populations and decades-old settlement corridors create durable communities abroad. Ukraine, Syria, Venezuela and Afghanistan have been pushed upward by war, state breakdown or forced displacement layered on top of earlier movement. BanglBangladesh and the Philippines illustrate mature labor-export systemse Russia remains one of the world’s largest legacy diasporas because post-Soviet geography still shapes where millions of people live and work.
6.10% of the world’s migrant stock. India sits first not because of one route, but because several systems overlap: Gulf labour migration, English-language education channels, family settlement in North America and Europe, and older business communities across Africa and Asia.
3.85% of the world’s migrant stock. China’s diaspora is unusually diversified: business migration, student-to-settlement pathways, family reunification and long-established communities in Southeast Asia, North America and Europe all contribute to its scale.
3.81% of the world’s migrant stock. Mexico’s position is anchored by the United States corridor, but the key point is durability: proximity, labour-market integration and multigenerational family networks have kept the overseas stock very large over time.
3.21% of the world’s migrant stock. Ukraine already had sizeable labour and family migration before 2022; Russia’s full-scale invasion then sharply expanded displacement and long-stay settlement across Europe, pushing the stock much higher.
3.00% of the world’s migrant stock. Russia remains high largely because of post-Soviet history: borders changed faster than people’s lives, and large Russian-born populations continue to reside across neighbouring states as well as in wider destination markets.
2.94% of the world’s migrant stock. Syria is one of the clearest examples of conflict-driven stock expansion, where refugee movements and prolonged displacement have become a major part of the country’s overseas population profile.
2.86% of the world’s migrant stock. Bangladesh combines classic labour migration to the Gulf with broader family and settlement pathways, making it one of the world’s most important long-run labour-export origins.
2.74% of the world’s migrant stock. Venezuela’s rise is recent in historical terms: economic collapse, institutional breakdown and regional displacement rapidly turned it into one of the largest origin countries in the global ranking.
2.48% of the world’s migrant stock. Afghanistan’s large overseas population reflects repeated cycles of conflict, insecurity and displacement, with major communities in neighbouring countries as well as farther-afield resettlement destinations.
2.30% of the world’s migrant stock. The PhThe Philippines is a clear example of a deeply institutionalized overseas labor system, supported by long-running care, maritime, service-sector, and family migration routes./article>
Chart: Top 20 origin countries by emigrants abroad
The chart makes the hierarchy easier to read at a glance. India sits in a tier of its own. The next cluster — from China and Mexico through Syria and Bangladesh — is large but comparatively compressed, showinshowing how very different migration systems can still produce similarly sized diasporas. Below that, the ranking becomes more mixed, combining conflict-driven origins, labour-export systems and older settlement patterns tied to history, geography and family reunification.
- #1 India 18,533,845
- #2 China 11,701,619
- #3 Mexico 11,596,529
- #4 Ukraine 9,769,216
- #5 Russia 9,134,094
- #6 Syria 8,927,523
- #7 Bangladesh 8,706,947
- #8 Venezuela 8,328,514
- #9 Afghanistan 7,528,994
- #10 Philippines 6,988,383
- #11 Pakistan 6,915,057
- #12 Egypt 4,820,002
- #13 United Kingdom 4,804,944
- #14 Romania 4,583,819
- #15 Poland 4,572,613
- #16 Myanmar 4,320,462
- #17 Germany 4,297,233
- #18 State of Palestine 4,233,248
- #19 Sudan 3,786,603
- #20 Indonesia 3,745,148
If the interactive chart does not load, the ordered bar list remains visible, so the section never collapses into an empty block.
Full Top 100 table
The table below is fully written into the HTML source, so the ranking remains visible even with JavaScript disabled. The interactive controls only improve navigation: search, sorting, region filtering, a Top 10 / Top 20 / All switch and a Units / Share toggle. The share view is useful because it shows how much of the world’s migrant stock is concentrated in each origin country, not just how the raw counts compare. The global reference total used for the share calculations is 304,020,000 international migrants worldwide.
| Rank | Country | Emigrants abroad | Region |
|---|---|---|---|
| 1 | India Asia | 18,533,845 6.10% | Asia |
| 2 | China Asia | 11,701,619 3.85% | Asia |
| 3 | Mexico Americas | 11,596,529 3.81% | Americas |
| 4 | Ukraine Europe | 9,769,216 3.21% | Europe |
| 5 | Russia Europe | 9,134,094 3.00% | Europe |
| 6 | Syria MENA | 8,927,523 2.94% | MENA |
| 7 | Bangladesh Asia | 8,706,947 2.86% | Asia |
| 8 | Venezuela Americas | 8,328,514 2.74% | Americas |
| 9 | Afghanistan Asia | 7,528,994 2.48% | Asia |
| 10 | Philippines Asia | 6,988,383 2.30% | Asia |
| 11 | Pakistan Asia | 6,915,057 2.27% | Asia |
| 12 | Egypt MENA | 4,820,002 1.59% | MENA |
| 13 | United Kingdom Europe | 4,804,944 1.58% | Europe |
| 14 | Romania Europe | 4,583,819 1.51% | Europe |
| 15 | Poland Europe | 4,572,613 1.50% | Europe |
| 16 | Myanmar Asia | 4,320,462 1.42% | Asia |
| 17 | Germany Europe | 4,297,233 1.41% | Europe |
| 18 | State of Palestine MENA | 4,233,248 1.39% | MENA |
| 19 | Sudan Africa | 3,786,603 1.25% | Africa |
| 20 | Indonesia Asia | 3,745,148 1.23% | Asia |
| 21 | Vietnam Asia | 3,693,537 1.21% | Asia |
| 22 | Colombia Americas | 3,652,238 1.20% | Americas |
| 23 | Morocco MENA | 3,627,829 1.19% | MENA |
| 24 | United States Americas | 3,186,999 1.05% | Americas |
| 25 | South Sudan Africa | 3,168,836 1.04% | Africa |
| 26 | Turkey Europe | 3,130,337 1.03% | Europe |
| 27 | Italy Europe | 2,941,444 0.97% | Europe |
| 28 | Kazakhstan Asia | 2,796,572 0.92% | Asia |
| 29 | Nepal Asia | 2,637,195 0.87% | Asia |
| 30 | France Europe | 2,547,158 0.84% | Europe |
| 31 | Yemen MENA | 2,480,734 0.82% | MENA |
| 32 | Malaysia Asia | 2,433,875 0.80% | Asia |
| 33 | Iraq MENA | 2,313,028 0.76% | MENA |
| 34 | Brazil Americas | 2,194,325 0.72% | Americas |
| 35 | Uzbekistan Asia | 2,114,480 0.70% | Asia |
| 36 | DR Congo Africa | 2,097,387 0.69% | Africa |
| 37 | Nigeria Africa | 2,094,265 0.69% | Africa |
| 38 | Burkina Faso Africa | 2,050,050 0.67% | Africa |
| 39 | South Korea Asia | 2,030,473 0.67% | Asia |
| 40 | Haiti Americas | 2,017,692 0.66% | Americas |
| 41 | Puerto Rico Americas | 1,948,223 0.64% | Americas |
| 42 | Somalia Africa | 1,935,594 0.64% | Africa |
| 43 | Dominican Republic Americas | 1,917,153 0.63% | Americas |
| 44 | Cuba Americas | 1,879,613 0.62% | Americas |
| 45 | El Salvador Americas | 1,834,670 0.60% | Americas |
| 46 | Portugal Europe | 1,799,179 0.59% | Europe |
| 47 | Algeria MENA | 1,780,399 0.59% | MENA |
| 48 | Iran MENA | 1,733,468 0.57% | MENA |
| 49 | Peru Americas | 1,672,482 0.55% | Americas |
| 50 | Spain Europe | 1,623,550 0.53% | Europe |
| 51 | Bosnia-Herzegovina Europe | 1,608,324 0.53% | Europe |
| 52 | Zimbabwe Africa | 1,519,324 0.50% | Africa |
| 53 | Sri Lanka Asia | 1,492,103 0.49% | Asia |
| 54 | Guatemala Americas | 1,460,232 0.48% | Americas |
| 55 | Honduras Americas | 1,397,584 0.46% | Americas |
| 56 | Canada Americas | 1,347,381 0.44% | Americas |
| 57 | Mali Africa | 1,292,519 0.43% | Africa |
| 58 | Bulgaria Europe | 1,252,234 0.41% | Europe |
| 59 | Jamaica Americas | 1,248,512 0.41% | Americas |
| 60 | Ecuador Americas | 1,243,065 0.41% | Americas |
| 61 | Ethiopia Africa | 1,240,645 0.41% | Africa |
| 62 | Hong Kong SAR Asia | 1,240,250 0.41% | Asia |
| 63 | Albania Europe | 1,216,628 0.40% | Europe |
| 64 | Côte d’Ivoire Africa | 1,211,422 0.40% | Africa |
| 65 | Argentina Americas | 1,183,381 0.39% | Americas |
| 66 | Thailand Asia | 1,178,757 0.39% | Asia |
| 67 | Ghana Africa | 1,055,494 0.35% | Africa |
| 68 | Japan Asia | 1,008,173 0.33% | Asia |
| 69 | South Africa Africa | 1,005,800 0.33% | Africa |
| 70 | Serbia Europe | 963,307 0.32% | Europe |
| 71 | Eritrea Africa | 912,792 0.30% | Africa |
| 72 | Central African Rep. Africa | 905,808 0.30% | Africa |
| 73 | Nicaragua Americas | 905,251 0.30% | Americas |
| 74 | Moldova Europe | 864,257 0.28% | Europe |
| 75 | Taiwan Province of China Asia | 832,507 0.27% | Asia |
| 76 | Croatia Europe | 826,166 0.27% | Europe |
| 77 | Azerbaijan Asia | 810,116 0.27% | Asia |
| 78 | Belarus Europe | 790,232 0.26% | Europe |
| 79 | Bolivia Americas | 783,473 0.26% | Americas |
| 80 | Greece Europe | 780,112 0.26% | Europe |
| 81 | Cambodia Asia | 778,793 0.26% | Asia |
| 82 | Paraguay Americas | 746,362 0.25% | Americas |
| 83 | Senegal Africa | 741,357 0.24% | Africa |
| 84 | Benin Africa | 726,530 0.24% | Africa |
| 85 | Tunisia MENA | 715,249 0.24% | MENA |
| 86 | Ireland Europe | 714,405 0.23% | Europe |
| 87 | Mozambique Africa | 702,796 0.23% | Africa |
| 88 | Lebanon MENA | 681,720 0.22% | MENA |
| 89 | New Zealand Oceania | 679,772 0.22% | Oceania |
| 90 | Lao PDR Asia | 660,258 0.22% | Asia |
| 91 | Jordan MENA | 659,204 0.22% | MENA |
| 92 | Armenia Asia | 637,604 0.21% | Asia |
| 93 | Netherlands Europe | 631,391 0.21% | Europe |
| 94 | Angola Africa | 616,967 0.20% | Africa |
| 95 | Togo Africa | 584,790 0.19% | Africa |
| 96 | Czechia Europe | 583,214 0.19% | Europe |
| 97 | Uganda Africa | 578,034 0.19% | Africa |
| 98 | Burundi Africa | 576,530 0.19% | Africa |
| 99 | Kyrgyz Republic Asia | 540,573 0.18% | Asia |
| 100 | Kenya Africa | 540,466 0.18% | Africa |
Source base: UN DESA International Migrant Stock 2024, origin-country view, interpreted as a 2025 snapshot. Updated for publication using the latest official 2024 revision available at page-build time.
Methodology and limits
This page ranks countries by the number of emigrants abroad — people who were born in a country and were living outside it at a given point in time. The empirical base is the United Nations Department of Economic and Social Affairs International Migrant Stock 2024 revision, which provides origin-and-destination estimates for 233 countries and areas and covers the period from 1990 to 2024. Because there is no completed official 2025 migrant-stock revision yet, this article uses mid-2024 values as the most defensible proxy for a 2025 ranking snapshot.
In the UN framework, country of birth is the preferred basis for identifying international migrants. Where foreign-born data are not available, country of citizenship can be used as an approximation. The resulting series combines census and population-register evidence where available and relies on interpolation, extrapolation or model-based estimation where direct evidence is incomplete. That matters for interpretation: this ranking is not a live border-crossing counter and it should not be read as an annual departures table.
For page usability, country values are rounded to whole persons, regions are grouped into broad analytical buckets and each country’s global share is calculated against the published 2024 world total of 304,020,000 international migrants. The main limits are straightforward. First, migrant-stock data are revised in discrete UN releases rather than updated continuously. Second, sudden crises can move countries sharply up the ranking, but statistical incorporation depends on source availability. Third, emigrant stock is cumulative: large, old diasporas can rank above countries experiencing intense recent outflows simply because overseas communities had much longer to accumulate.
What the ranking actually shows
- Diaspora scale is path-dependent. The upper end of the ranking is dominated by countries whose overseas populations were built over many years. Once migration systems reach critical mass, family reunification, circular labour movement, student mobility and community support structures help keep the stock large even when current outflows slow.
- Conflict now sits beside classic labour migration as a major ranking driver. Ukraine, Syria, Venezuela and Afghanistan are not just large origin countries in demographic terms; they show how war, persecution, collapse and prolonged instability can reshape the global map of migrant origins in a relatively short period.
- A high emigrant stock is not the same thing as national failure. Wealthy countries such as the United Kingdom, Germany, Italy and the United States also place high because colonial legacies, free-movement regimes, multinational labour markets, education pathways and long-settled diasporas all generate large populations abroad.
- Asia is the single biggest regional bloc inside the Top 100. Asian origin countries in this ranking account for roughly 35.18% of the Top 100 total, highlighting the combined weight of South Asia, East and Southeast Asia in the geography of global migration.
- The ranking is highly concentrated. The Top 100 countries account for about 87.26% of all international migrants worldwide, which means diaspora scale is far from evenly distributed across origins and is strongly shaped by a limited set of very large or highly disrupted countries.
What this means for the reader
If you are using this page for relocation research, diaspora outreach, remittance analysis, labour-market mapping or audience strategy, the key point is practical: emigrant stock measures the depth of a country’s overseas footprint, not the current speed of exits. Large stocks usually imply dense networks abroad, stronger family-reunification channels, deeper labor-market pathways more mature remittance systems and a higher probability that services, media, recruiters or community institutions already exist for that origin group.
For ordinary readers, the ranking also prevents a common misread. A country can rank high without being in today’s biggest migration crisis, because the stock reflects long accumulation. And a country can be in a severe current crisis without yet appearing near the very top if the outward movement is newer or only partly captured in official statistics. In practice, this page works best when read alongside flow indicators, refugee and asylum data, remittance tables and destination-country rankings rather than as a standalone verdict on wwhether a country is simply “losing people”eople”.
FAQ about emigrant stock and diaspora scale
What does “emigrants abroad” mean here?
It refers to the stock of people born in a country who were living outside that country at mid-year 2024 under the UN DESA migrant-stock framework. The emphasis is on where people live at a point in time, not on how many crossed a border this year.
Is this the same as net migration?
No. Net migration is a balance of inflows minus outflows over a period. Emigrants abroad measures the accumulated overseas population from one origin country. A country can therefore have a very large emigrant stock even if current departures have slowed or if immigration partly offsets emigration at home.
Why is India ranked first?
India combines huge population scale with unusually broad overseas netwLabor migration to the Gulf, education and skilled migration to English-speaking destinations, family reunification in Europe and North America, and older commercial communities all reinforce one another, producing the world’s largest diaspora base.base.
Why are Ukraine, Syria and Venezuela so high?
Because migrant stock reacts not only to long-run labour and family migration, but also to major shocks. War, displacement, economic collapse and political instability can push millions of people abroad and keep them there long enough for the overseas stock to rise very sharply.
Does a high rank automatically mean a country is doing badly?
Not automatically. Some countries rank high because they are large and have sent migrants abroad for generations, not because they are in immediate crisis. Rich countries can also have large emigrant populations, especially where colonial ties, free movement, education pathways or multinational labour markets encourage settlement abroad.
Why use 2024 data for a 2025 page?
Because migrant stock is not measured in real time the way inflation, exchange rates or monthly trade can be. The latest completed global origin-by-destination revision from UN DESthe 2024 edition, so using it as the proxy base for a 2025 snapshot is the clearest and most statistically defensible approachq-answer">
In practice, yes, where they are captured within the UN statistical framework as part of the international migrant stock. That is one reason conflict-driven origin countries can move rapidly upward in this ranking. But the page should still be read together with dedicated refugee and asylum datasets, which measure displacement more directly.
Sources and data notes
- UN DESA Population Division — International Migrant Stock. Main official source for origin and destination estimates, including the 2024 revision.
https://www.un.org/development/desa/pd/content/international-migrant-stock - UN DESA — International Migrant Stock 2024: Key facts and figures. Official technical summary for the latest revision and its global totals.
https://www.un.org/development/desa/pd/sites/www.un.org.development.desa.pd/files/undesa_pd_2025_intlmigstock_2024_key_facts_and_figures_advance-unedited.pdf - World Bank Data — International migrant stock, total. WDI page that republishes the UN Population Division series for country-level access and downloads.
https://data.worldbank.org/indicator/SM.POP.TOTL - Migration Data Portal (IOM). Background explainer on international migrant stocks and the latest UN revision.
https://www.migrationdataportal.org/themes/international-migrant-stocks-overview
Compiled from the UN DESA 2024 origin-stock framework and checked against companion international reference sources. For forCompiled from the UN DESA 2024 origin-stock framework and checked against related international reference sources.ing a country value.
Related rankings
More StatRanker pages connected by topic, category or ranking theme.
TOP 10 Origin Countries by Number of Emigrants Abroad (2025)
Open rankingStatRanker (Website)
administrator
