


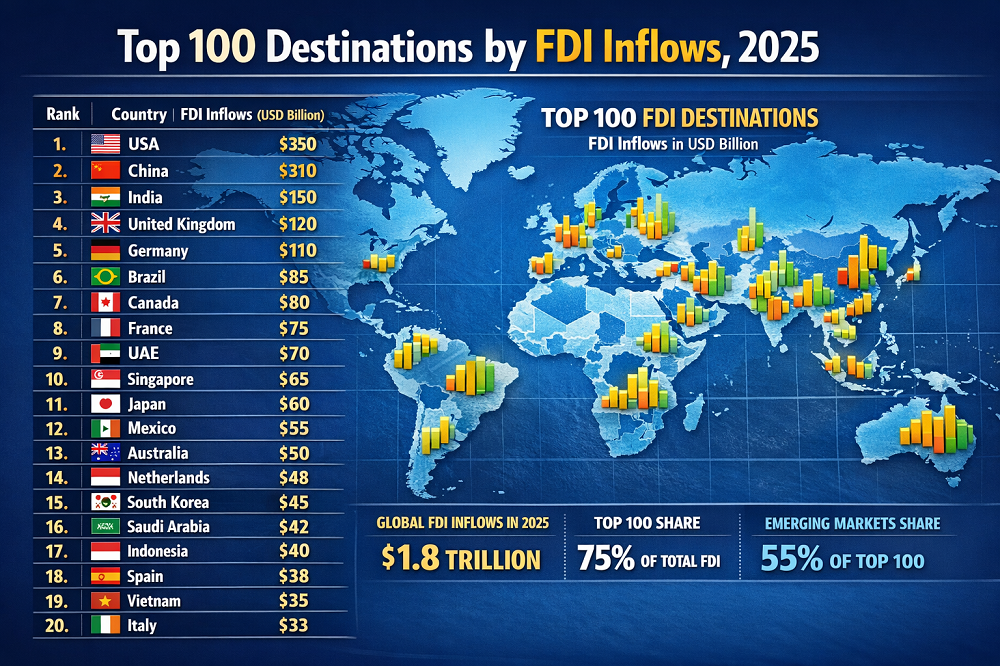
Top 100 Destinations by FDI Inflows, 2025
Foreign direct investment destinations remain highly concentrated even before the 2025 rebound
Foreign direct investment inflows are one of the clearest ways to see where global capital is actually landing. They show which destinations are absorbing equity, reinvested earnings, and other cross-border capital linked to lasting corporate control or influence. This ranking uses the latest fully comparable country layer available across public sources — 2024 values — as a clear base for a 2025-oriented snapshot of destination strength.
Thank you for reading this post, don't forget to subscribe!That choice matters because a fully comparable country-level 2025 table is not yet available across public datasets. Using the 2024 layer keeps the ranking transparent and comparable, while the interpretation section adds UNCTAD’s preliminary 2025 update to show where the broader cycle may be shifting.
Values are shown in current U.S. dollars, rounded for readability and harmonized into a single country ranking layer.
Continue exploring
More StatRanker pages connected by topic, category or ranking theme.
Top 10 destinations by FDI inflows
The leading group mixes three very different destination types: giant diversified economies such as the United States and Germany; regional operating hubs such as Singapore and Hong Kong; and conduit or holding-company jurisdictions such as Luxembourg or the British Virgin Islands. That is why raw FDI should never be read as a pure “factory-building” league table. Part of what the ranking captures is productive expansion, part of it is corporate structuring, treasury activity, mergers, and capital routing through specialised financial centres.
The United States remains the largest destination by a wide margin. Scale, deep capital markets, a broad technology base, and continued reshoring or friendshoring in advanced manufacturing all help keep inbound FDI at the top of the global table.
Singapore stays near the very top because it combines financial intermediation, regional headquarters functions, logistics, and high-end manufacturing. It is both a real production platform and a conduit economy, so flows can look exceptionally large relative to market size.
Hong Kong remains a major entry point into Asia-facing capital flows. Its role as a gateway, financing hub, and corporate structuring center keeps inbound figures very high even when regional investment sentiment becomes more uneven.
Luxembourg’s ranking reflects its role as a financial and holding-company center. Large headline inflows do not map one-for-one into factory construction or job creation, which is why raw FDI always needs interpretation alongside the structure of the host economy.
Brazil is the largest Latin American destination in the table. Market size, natural resources, agribusiness, energy, and a broad industrial base still attract large cross-border investment even when the macro backdrop is noisy.
Canada remains a heavyweight host economy thanks to resources, manufacturing, business services, and North American integration. Inward FDI is also supported by stable institutions and a familiar legal environment for global investors.
Australia pairs a sophisticated services economy with mining, energy, infrastructure, and Asia-linked investment corridors. Large transaction-driven years can lift the inflow number materially.
The British Virgin Islands illustrate why analysts should separate operational FDI from financial structuring. Very high inflows can reflect the jurisdiction’s role in international corporate routing as much as domestic productive expansion.
France stays in the global top tier because it combines a large domestic market, advanced industry, transport, pharmaceuticals, luxury goods, and a central role in European corporate investment networks.
Germany remains one of Europe’s core investment destinations despite cyclical industrial headwinds. Its strength comes from manufacturing depth, engineering ecosystems, logistics, and its position inside the EU single market.
Table 1. Top 10 destinations by FDI inflows
| Rank | Destination | FDI inflows (2024, US$ bn) |
|---|---|---|
| 1 | United States | $297 bn |
| 2 | Singapore | $152 bn |
| 3 | Hong Kong | $117 bn |
| 4 | Luxembourg | $106 bn |
| 5 | Brazil | $74.1 bn |
| 6 | Canada | $58.8 bn |
| 7 | Australia | $54.0 bn |
| 8 | British Virgin Islands | $53.6 bn |
| 9 | France | $52.1 bn |
| 10 | Germany | $47.6 bn |
The full Top 100 ranking appears in the next section.
Chart 1. Top 20 destinations by FDI inflows
If the chart does not render, the leading destinations remain visible here:
- United States: $297 bn
- Singapore: $152 bn
- Hong Kong: $117 bn
- Luxembourg: $106 bn
- Brazil: $74.1 bn
- Canada: $58.8 bn
- Australia: $54.0 bn
- British Virgin Islands: $53.6 bn
- France: $52.1 bn
- Germany: $47.6 bn
The top 20 account for a large share of global inflows. The long tail below them still matters, but the ranking is dominated by a relatively small set of destinations with either very large market size, strong financial intermediation, or both.
Methodology
This page ranks destinations by foreign direct investment, net inflows. In the World Bank metadata, the series includes equity capital, reinvested earnings, and other capital tied to a direct investment relationship, usually understood as at least 10% ownership or meaningful influence over management. The official series is annual and reported in current U.S. dollars on a balance-of-payments basis.
The ranking year is 2024 because that is the latest country-by-country layer that can be harmonized cleanly across public datasets. Those values are used as the base for a 2025 snapshot, while UNCTAD’s 2025 and early-2026 releases are used only for broader directional context.
Processing was deliberately conservative. Country values were rounded for readability and harmonised to a single comparable country layer rather than blending mixed vintages. The main limitations are important: FDI can be distorted by conduit flows, holding-company structures, mergers, tax routing, and one-off mega-projects. Raw inflows also do not tell you whether the capital landed in export manufacturing, digital infrastructure, extractives, real estate, or financial engineering.
Key insights from the ranking
First, scale still matters. The United States stands far above every other destination because no other economy combines such deep capital markets, sector breadth, consumer scale, and technology ecosystems in one market. Large diversified economies remain hard to displace when boards allocate long-horizon capital.
Second, small hubs still punch far above their population size. Singapore, Hong Kong, Luxembourg, Malta, the Cayman Islands, and the British Virgin Islands appear because global investment is not distributed only through final operating markets. It is also routed through legal, financial, and corporate platforms that compress huge volumes of cross-border balance-sheet activity into small host economies.
Third, the middle of the table shows the geography of industrial repositioning. Mexico, Poland, Vietnam, Malaysia, Thailand, Saudi Arabia, the UAE, and India all benefit from different mixes of nearshoring, Gulf diversification, Asian manufacturing relocation, digital infrastructure, or large-market expansion. The lesson is that productive FDI is increasingly clustering around supply-chain resilience, logistics, energy, and tech-enabling assets rather than spreading evenly across the map.
What this means for the reader
For students and journalists, the ranking is a fast way to distinguish between destination size and destination type. A high number can signal manufacturing depth, but it can also signal financial-conduit status. That difference changes how you write about jobs, productivity, and local spillovers.
For business readers, the table is useful as a shortlist of markets where international capital is already dense. Destinations high in the ranking often have better-developed advisory ecosystems, cross-border legal support, and supplier networks. But the same ranking can also reveal overcrowded markets, where competition for talent, land, and incentives is intense.
For general readers, the most practical point is simple: strong FDI destinations are often the places where multinational firms are expanding, financing, or repositioning operations. That can affect jobs, infrastructure, commercial property, logistics demand, and local supply chains — but only if the flows are tied to real operating activity rather than paper routing.
FAQ
What exactly counts as an FDI inflow?
In the World Bank definition, FDI inflows include equity capital, reinvested earnings, and other capital when a foreign investor has control or meaningful influence over a resident enterprise. It is broader than greenfield factory announcements alone.
Why is this page labelled 2025 if most country values are from 2024?
Because 2024 is the latest fully comparable country-by-country layer available across public sources. It is the cleanest proxy for a 2025 snapshot, while the text also references UNCTAD’s 2025 trend updates where they help explain the broader direction of global FDI.
Why do Singapore, Hong Kong, Luxembourg or the British Virgin Islands rank so high?
Because some destinations are both real operating hubs and financial routing centres. Their FDI numbers can capture genuine investment activity plus cross-border structuring, treasury, and holding-company flows.
Does a higher FDI inflow automatically mean a healthier economy?
No. Large inflows can be excellent news, but they can also be volatile, concentrated in a single sector, or driven by one-off corporate transactions. Raw inflows should always be read together with sector mix, jobs, technology transfer, and domestic linkages.
Why can FDI even turn negative in some countries?
Because the net measure can be pulled below zero by disinvestment, intra-company debt repayments, asset sales, or reversals in holding-company structures. Negative FDI does not always mean factories physically disappeared.
Is FDI the same thing as greenfield investment?
No. Greenfield is only one part of the picture. FDI can also come through mergers and acquisitions, reinvested profits, and cross-border intra-firm financing.
Why compare both dollar inflows and share of the world total?
Dollar values show scale. Share of world total shows concentration. A country can attract a large absolute amount but still represent only a modest slice of global FDI if the overall global pool is large.
How the Top 100 FDI destinations are distributed
Once the ranking moves beyond the first ten entries, the picture becomes more nuanced. You can see the coexistence of very large domestic markets, energy exporters, European and Asian operating hubs, and smaller financial platforms that attract disproportionate cross-border capital. The full table below keeps the entire Top 100 in one place, while the controls help narrow the view by country, region, income group, coverage, and units.
Table 2. Top 100 destinations by FDI inflows
The full Top 100 is listed below. The controls allow you to search, sort, and switch the view between current U.S. dollars and share of the global total.
Income-group filter follows current World Bank categories where applicable. Share of global is calculated against the 2024 world total of about $1.51 trillion.
| Rank | Destination | Region | Value |
|---|---|---|---|
| 1 | United States | Americas | $297,000,000,000 19.67% |
| 2 | Singapore | Asia-Pacific | $152,000,000,000 10.07% |
| 3 | Hong Kong | Asia-Pacific | $117,000,000,000 7.75% |
| 4 | Luxembourg | Europe | $106,000,000,000 7.02% |
| 5 | Brazil | Americas | $74,100,000,000 4.91% |
| 6 | Canada | Americas | $58,800,000,000 3.89% |
| 7 | Australia | Asia-Pacific | $54,000,000,000 3.58% |
| 8 | British Virgin Islands | Americas | $53,600,000,000 3.55% |
| 9 | France | Europe | $52,100,000,000 3.45% |
| 10 | Germany | Europe | $47,600,000,000 3.15% |
| 11 | Egypt | MENA | $46,600,000,000 3.09% |
| 12 | United Arab Emirates | MENA | $45,600,000,000 3.02% |
| 13 | Mexico | Americas | $45,300,000,000 3.00% |
| 14 | Spain | Europe | $42,800,000,000 2.83% |
| 15 | Malta | Europe | $42,600,000,000 2.82% |
| 16 | Cayman Islands | Americas | $35,900,000,000 2.38% |
| 17 | Sweden | Europe | $31,600,000,000 2.09% |
| 18 | India | Asia-Pacific | $27,100,000,000 1.79% |
| 19 | Italy | Europe | $26,900,000,000 1.78% |
| 20 | Indonesia | Asia-Pacific | $24,200,000,000 1.60% |
| 21 | Saudi Arabia | MENA | $21,300,000,000 1.41% |
| 22 | Poland | Europe | $20,600,000,000 1.36% |
| 23 | Vietnam | Asia-Pacific | $20,200,000,000 1.34% |
| 24 | China | Asia-Pacific | $18,600,000,000 1.23% |
| 25 | Denmark | Europe | $18,500,000,000 1.23% |
| 26 | Japan | Asia-Pacific | $17,200,000,000 1.14% |
| 27 | Malaysia | Asia-Pacific | $15,600,000,000 1.03% |
| 28 | South Korea | Asia-Pacific | $15,200,000,000 1.01% |
| 29 | Israel | MENA | $14,800,000,000 0.98% |
| 30 | Thailand | Asia-Pacific | $14,300,000,000 0.95% |
| 31 | Colombia | Americas | $13,700,000,000 0.91% |
| 32 | Austria | Europe | $13,700,000,000 0.91% |
| 33 | Portugal | Europe | $13,500,000,000 0.89% |
| 34 | Czechia | Europe | $13,100,000,000 0.87% |
| 35 | Chile | Americas | $12,500,000,000 0.83% |
| 36 | Oman | MENA | $12,500,000,000 0.83% |
| 37 | Argentina | Americas | $11,600,000,000 0.77% |
| 38 | Norway | Europe | $11,500,000,000 0.76% |
| 39 | Philippines | Asia-Pacific | $9,440,000,000 0.63% |
| 40 | Finland | Europe | $8,740,000,000 0.58% |
| 41 | Guyana | Americas | $8,630,000,000 0.57% |
| 42 | Romania | Europe | $7,160,000,000 0.47% |
| 43 | Peru | Americas | $6,800,000,000 0.45% |
| 44 | Greece | Europe | $6,740,000,000 0.45% |
| 45 | Serbia | Europe | $5,590,000,000 0.37% |
| 46 | Costa Rica | Americas | $5,300,000,000 0.35% |
| 47 | Slovakia | Europe | $5,010,000,000 0.33% |
| 48 | Ireland | Europe | $4,820,000,000 0.32% |
| 49 | Lithuania | Europe | $4,700,000,000 0.31% |
| 50 | Croatia | Europe | $4,670,000,000 0.31% |
| 51 | Dominican Republic | Americas | $4,480,000,000 0.30% |
| 52 | Cambodia | Asia-Pacific | $4,390,000,000 0.29% |
| 53 | Ethiopia | Africa | $4,020,000,000 0.27% |
| 54 | Ukraine | Europe | $4,020,000,000 0.27% |
| 55 | Ivory Coast | Africa | $3,800,000,000 0.25% |
| 56 | Mozambique | Africa | $3,510,000,000 0.23% |
| 57 | Bulgaria | Europe | $3,480,000,000 0.23% |
| 58 | Uganda | Africa | $3,260,000,000 0.22% |
| 59 | Panama | Americas | $3,240,000,000 0.21% |
| 60 | Republic of the Congo | Africa | $2,920,000,000 0.19% |
| 61 | Uzbekistan | Asia-Pacific | $2,850,000,000 0.19% |
| 62 | Mongolia | Asia-Pacific | $2,780,000,000 0.18% |
| 63 | Bahrain | MENA | $2,700,000,000 0.18% |
| 64 | Iceland | Europe | $2,700,000,000 0.18% |
| 65 | Pakistan | Asia-Pacific | $2,660,000,000 0.18% |
| 66 | South Africa | Africa | $2,330,000,000 0.15% |
| 67 | Senegal | Africa | $2,020,000,000 0.13% |
| 68 | Kazakhstan | Asia-Pacific | $1,980,000,000 0.13% |
| 69 | Namibia | Africa | $1,970,000,000 0.13% |
| 70 | Slovenia | Europe | $1,870,000,000 0.12% |
| 71 | Guatemala | Americas | $1,850,000,000 0.12% |
| 72 | Lebanon | MENA | $1,840,000,000 0.12% |
| 73 | Ghana | Africa | $1,770,000,000 0.12% |
| 74 | New Zealand | Asia-Pacific | $1,760,000,000 0.12% |
| 75 | Belarus | Europe | $1,740,000,000 0.12% |
| 76 | Tanzania | Africa | $1,720,000,000 0.11% |
| 77 | Albania | Europe | $1,710,000,000 0.11% |
| 78 | Morocco | MENA | $1,640,000,000 0.11% |
| 79 | Turkmenistan | Asia-Pacific | $1,640,000,000 0.11% |
| 80 | Venezuela | Americas | $1,630,000,000 0.11% |
| 81 | Jordan | MENA | $1,630,000,000 0.11% |
| 82 | Georgia | Europe | $1,600,000,000 0.11% |
| 83 | Bangladesh | Asia-Pacific | $1,540,000,000 0.10% |
| 84 | Latvia | Europe | $1,510,000,000 0.10% |
| 85 | Iran | MENA | $1,450,000,000 0.10% |
| 86 | Macau | Asia-Pacific | $1,450,000,000 0.10% |
| 87 | Mauritania | Africa | $1,440,000,000 0.10% |
| 88 | Guinea | Africa | $1,400,000,000 0.09% |
| 89 | Nicaragua | Americas | $1,350,000,000 0.09% |
| 90 | Honduras | Americas | $1,310,000,000 0.09% |
| 91 | Algeria | MENA | $1,230,000,000 0.08% |
| 92 | Zambia | Africa | $1,180,000,000 0.08% |
| 93 | Gabon | Africa | $1,140,000,000 0.08% |
| 94 | Myanmar | Asia-Pacific | $1,100,000,000 0.07% |
| 95 | Nigeria | Africa | $1,080,000,000 0.07% |
| 96 | North Macedonia | Europe | $1,060,000,000 0.07% |
| 97 | Chad | Africa | $1,020,000,000 0.07% |
| 98 | Bosnia and Herzegovina | Europe | $1,000,000,000 0.07% |
| 99 | Laos | Asia-Pacific | $988,000,000 0.07% |
| 100 | Cameroon | Africa | $925,000,000 0.06% |
Source layer: latest public country ranking based on World Bank FDI series, updated and harmonized for 2024 values. Updated for publication on March 30, 2026.
Figure 2. Inflows versus outflows for selected major destinations
The scatter plot below compares net inflows and net outflows for selected economies. It helps separate destinations that mainly receive capital from those that are both major hosts and major outward investors. The upper-right area is especially important: these are economies that function as both large destination markets and major exporters of capital.
If the chart does not render, the pattern is still straightforward:
- The United States combines the largest inflow total with the largest outward investment flow in this selected sample.
- Singapore, Hong Kong and Luxembourg sit high because they are both host hubs and outbound capital platforms.
- Egypt and Vietnam show a much more host-heavy profile in the selected sample, with inflows far above outward flows.
- Japan and China are large on both axes, but their outflow side is especially prominent.
Scatter values are shown in U.S. dollars, billions, using the same 2024 layer that underpins the ranking. The objective is interpretive: to show the difference between pure destination stories and economies that are simultaneously major outward investors.
How to interpret the 2025 FDI destination hierarchy without oversimplifying it
Headline FDI inflows are not a pure measure of domestic productive investment. The same table can place the United States, Singapore, Hong Kong, Luxembourg, Brazil and the British Virgin Islands side by side even though the underlying stories differ sharply. The United States and Brazil are primarily large operating markets. Singapore and Hong Kong combine real headquarters, logistics and production roles with strong intermediation functions. Luxembourg and the British Virgin Islands capture much more of the legal and financial plumbing of cross-border capital.
The hierarchy also shows that FDI is concentrating around a limited set of advantages rather than spreading evenly. Some countries win through market size and institutional depth; some through tax, treasury and holding structures; others through supply-chain repositioning in semiconductors, autos, energy, cloud infrastructure and logistics.
That is why the middle of the table deserves closer reading. Mexico, Poland, Vietnam, Malaysia, Saudi Arabia, the UAE, India and Indonesia are not just smaller versions of the top destinations. They represent distinct investment models: nearshoring into North America, industrial deepening inside Europe and Asia, Gulf diversification, and infrastructure-led scale-up in large domestic markets. For research and strategy work, the real value of the ranking lies in identifying which model of destination is attracting capital, not just which country sits higher.
Policy takeaways
Raw inflow totals are valuable, but the policy question is never just “how much came in?” A more useful question is “what kind of capital came in, how durable is it, and what spillovers did it create?”
- Large advanced economies need to protect investment openness while tying new FDI to innovation, supplier development and strategic sectors rather than passive balance-sheet inflows.
- Middle-income industrial platforms should focus on logistics, skills, grid reliability, and local supplier depth so that new FDI raises domestic value added instead of staying enclave-like.
- Resource-rich destinations need stronger conversion from extractive capital into infrastructure, manufacturing depth and fiscal resilience.
- Financial hubs should not be confused with broad-based domestic investment success stories. Their role is real, but their headline numbers require structural interpretation.
- For lower-income economies, the problem is often not only attracting more capital, but reducing concentration risk and creating enough institutional predictability for repeat investment.
UNCTAD’s early 2026 update adds an important forward-looking nuance: global FDI appears to have risen again in 2025, but much of the rebound was concentrated in developed economies and financial centres, while real project activity stayed more fragile than the headline suggests. In other words, a bigger global number does not automatically mean a broader development gain.
Why this ranking is useful for business, research, and media work
For business users, the ranking helps separate destinations where cross-border capital is already dense from markets where international investment is still thinner and potentially harder to scale. That matters for market-entry planning, location screening, legal structuring and competitor mapping.
For journalists and researchers, the table works as a quick diagnostic tool. It highlights where the narrative should focus on operational expansion and where it should focus on conduit behaviour, tax routing, or transaction effects. Used carefully, it helps avoid treating every FDI spike as proof of broad industrial transformation.
For policymakers and economic-development teams, the biggest analytical gain comes from comparing this league table with sector data, labour-market outcomes, domestic investment, and export complexity. Only then can a country tell whether strong inflows are building capacity or simply passing through.
Primary data sources and technical notes
Official sources are listed first. A supplementary public ranking table is included last only as a cross-check used to harmonize the comparable Top 100 country layer shown in this article.
-
World Bank — Foreign direct investment, net inflows (BoP, current US$)Official indicator definition and source note for the series used in this ranking.
https://data.worldbank.org/indicator/BX.KLT.DINV.CD.WD -
World Bank DataBank Metadata — BX.KLT.DINV.CD.WDDetailed methodological description: equity capital, reinvested earnings, other capital, BoP basis, and limitations.
https://databank.worldbank.org/metadataglossary/world-development-indicators/series/BX.KLT.DINV.CD.WD -
World Bank — Foreign direct investment, net outflows (BoP, current US$)Companion indicator used for the inflows-versus-outflows scatter plot.
https://data.worldbank.org/indicator/BM.KLT.DINV.CD.WD -
UNCTAD — World Investment Report 2025Global and regional context for 2024 FDI performance, including the downturn in developed Europe and the resilience of parts of developing Asia and Africa.
https://unctad.org/publication/world-investment-report-2025 -
UNCTAD — Global foreign investment up 14% in 2025, with growth concentrated in developed economiesPreliminary 2025 update used for the forward-looking interpretation block.
https://unctad.org/news/global-foreign-investment-14-2025-growth-concentrated-developed-economies -
World Bank — Country classifications by income level / FY26 thresholdsBasis for the income-group filter where applicable.
https://datahelpdesk.worldbank.org/knowledgebase/articles/906519-world-bank-country-and-lending-groups -
Supplementary public country ranking tableUsed only as a public cross-check to harmonize the comparable 2024 destination values shown in the Top 100 table.
https://worldpopulationreview.com/country-rankings/fdi-by-country
This ranking should be treated as an analytical reference point, not as a substitute for country-level statistical releases. For formal work, always verify the latest country observation directly in the original source database.
Related rankings
More StatRanker pages connected by topic, category or ranking theme.
StatRanker (Website)
administrator
