

Top 100 Countries by Renewable Power Capacity per Capita in 2025
Renewable power capacity per person changes the ranking lens
Installed renewable power per person highlights a different side of the energy transition than total gigawatts or the renewable share of generation. Large markets can dominate in absolute capacity, but per-capita rankings reward how much renewable electricity infrastructure is available relative to the number of residents. That makes the metric especially useful for comparing small hydro-rich systems, wind-heavy Nordic markets, solar leaders with modest populations, and larger economies that are adding renewables fast but still have a long way to go on a per-person basis.
This page is built as a 2025 ranking article, but the country-by-country values use the latest verified official cross-country per-capita series available in the World Bank SE4ALL dataset: installed renewable electricity-generating capacity in watts per capita for 2022. The broader market context comes from IRENA Renewable Capacity Statistics 2025, which reports that global renewable power capacity reached 4,448 GW at the end of 2024 after a record 585 GW increase during the year.
Top 10 countries by renewable power capacity per person
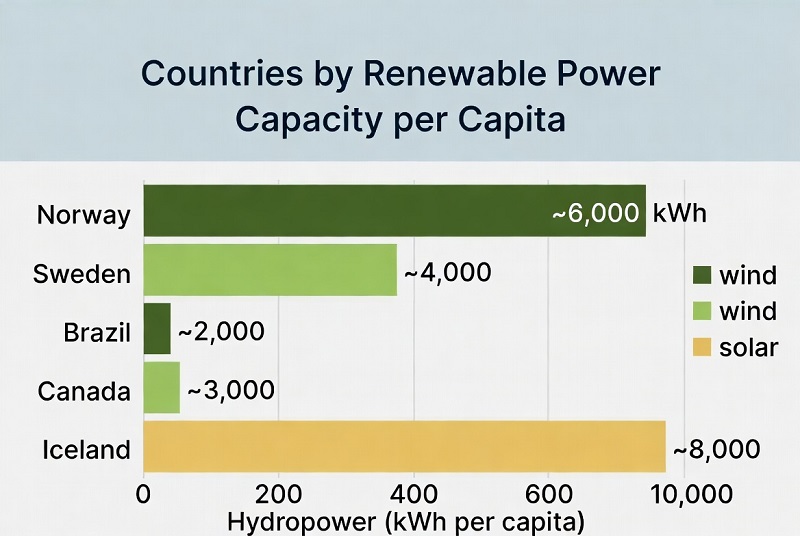
The leadership group is dominated by countries that combine strong renewable resource endowments with relatively small populations. Iceland and Norway remain far ahead because large hydro systems, mature electricity infrastructure and small resident populations produce extremely high watts-per-person ratios. Sweden, Austria, Finland and Denmark show that diversified advanced systems can also rank near the top when wind, hydro and grid investment are sustained over time. Bhutan stands out as the main non-OECD outlier in the top tier, reflecting hydropower’s outsized role in a small Himalayan system.
Iceland
7,722 W per person
Europe · 18.2× the world average
−0.7% year-on-year in the latest official cross-country update.
Norway
7,296 W per person
Europe · 17.2× the world average
+0.0% year-on-year in the latest official cross-country update.
Sweden
3,606 W per person
Europe · 8.5× the world average
+9.1% year-on-year in the latest official cross-country update.
Bhutan
2,985 W per person
Asia · 7.0× the world average
−0.6% year-on-year in the latest official cross-country update.
Canada
2,779 W per person
Americas · 6.6× the world average
+1.7% year-on-year in the latest official cross-country update.
Austria
2,620 W per person
Europe · 6.2× the world average
+5.7% year-on-year in the latest official cross-country update.
Switzerland
2,257 W per person
Europe · 5.3× the world average
+3.1% year-on-year in the latest official cross-country update.
Finland
2,183 W per person
Europe · 5.1× the world average
+26.3% year-on-year in the latest official cross-country update.
Denmark
2,102 W per person
Europe · 5.0× the world average
+13.1% year-on-year in the latest official cross-country update.
Australia
1,865 W per person
Oceania · 4.4× the world average
+7.7% year-on-year in the latest official cross-country update.
Table 1. Top 10 countries, latest official per-capita values
| Rank | Country | Watts per person | YoY |
|---|---|---|---|
| 1 | Iceland | 7,722 | −0.7% |
| 2 | Norway | 7,296 | +0.0% |
| 3 | Sweden | 3,606 | +9.1% |
| 4 | Bhutan | 2,985 | −0.6% |
| 5 | Canada | 2,779 | +1.7% |
| 6 | Austria | 2,620 | +5.7% |
| 7 | Switzerland | 2,257 | +3.1% |
| 8 | Finland | 2,183 | +26.3% |
| 9 | Denmark | 2,102 | +13.1% |
| 10 | Australia | 1,865 | +7.7% |
World average in the same official series: 424.1 watts per person.
Chart 1. Top 20 countries by renewable power capacity per person
Methodology
The core ranking metric on this page is installed renewable electricity-generating capacity in watts per capita. In methodological terms, the numerator is year-end renewable electricity capacity, and the denominator is population. The indicator is aligned with SDG 7.b.1 and is compiled from IRENA electricity-capacity data and population data from the United Nations system. In the official definition, renewable electricity capacity covers hydropower, wind, solar, bioenergy, geothermal and marine technologies, and capacity is measured as the maximum year-end installed generating capacity.
For this article, the country ranking values come from the latest official cross-country per-capita series that could be verified directly in the World Bank SE4ALL dataset, which runs through 2022. The surrounding narrative uses IRENA Renewable Capacity Statistics 2025 to anchor the page in the 2025 discussion cycle and to reference the end-2024 global capacity total. Values are rounded to whole watts per person for readability, and the year-on-year column reflects the change from 2021 to 2022 in the official per-capita series.
There are also limitations. Capacity is not the same as generation, so countries with high renewable capacity may still have lower renewable output if utilisation rates are weak. Hydropower-heavy systems can look exceptionally strong in wet years from a structural standpoint even if generation varies. Countries with fast population growth need to add capacity even faster just to keep their per-capita ratio stable. Finally, because the country ranking values rely on the latest verified official per-capita release rather than a freshly recomputed 2024 population-normalised table, this page should be read as the latest fully comparable benchmark rather than a mechanical 2024 recalculation.
Insights
Three patterns stand out. First, the top of the table is overwhelmingly shaped by hydro and wind-rich systems with small or medium-sized populations. That is why Iceland and Norway sit so far above the world average, and why Bhutan also ranks unusually high relative to its level of income. Second, the upper middle of the ranking is packed with European countries that built renewables steadily over long periods rather than through one-off surges. Countries such as Austria, Finland, Denmark, Portugal, Spain and Greece reflect cumulative grid, planning and investment choices that compound over time.
Third, absolute leaders in renewable additions do not automatically top the per-capita table. China and the United States are global giants in total renewable capacity, but their large populations dilute the watts-per-person metric. That does not make their transitions weak; it simply means that scale and per-capita density answer different questions. Capacity-per-person is best seen as an infrastructure-intensity measure. It shows how deeply renewable generation assets have penetrated the domestic system relative to population, not which country added the most gigawatts last year.
What this means for the reader
For investors, engineers, consultants and policy watchers, this ranking is a fast way to identify where renewable infrastructure is already dense and where the system has deeper operational experience with renewables. For households and businesses, a high per-capita ratio often signals more mature networks, stronger integration of clean power into the electricity mix, and a larger installed base of domestic renewable assets. That does not automatically mean lower prices or perfect energy security, but it usually indicates a more advanced structural transition.
For people comparing countries as places to live or do business, the table is also a reminder that clean-energy leadership comes in different forms. Some countries achieve high per-capita capacity through abundant hydro resources, others through large wind fleets, and others through rapid solar deployment on top of strong legacy systems. The measure therefore works best when read alongside power prices, grid reliability, interconnection, storage build-out and actual renewable generation shares.
FAQ
Why is Iceland number one?
Iceland combines very high renewable capacity with a very small population. A hydro- and geothermal-heavy power system spread across relatively few residents pushes watts per person to an extreme level.
Why are China and the United States not at the very top if they are renewable superpowers?
Because this metric is not about total gigawatts. It divides renewable capacity by population. Large countries can dominate the world in absolute installations and still rank lower per person than smaller countries with dense renewable systems.
Is capacity per person better than renewable share of generation?
It is better for a different question. Capacity per person measures infrastructure intensity. Share of generation measures actual output mix. A country can rank high on one and not the other, depending on technology mix, capacity factors and demand structure.
Does high capacity per person mean cheap electricity?
Not necessarily. Power prices depend on market design, grid costs, storage, fuel imports, taxes and legacy contracts. High renewable capacity per person usually improves structural resilience, but it does not guarantee low retail tariffs.
Why do hydro-rich countries show up so strongly?
Large hydro fleets create a lot of installed renewable capacity that can be spread across small populations. Countries with mountainous terrain and long-established dam systems often score very well on this metric.
Why is the year-on-year change so uneven?
Because a small country can move sharply with one new project, while a large country needs much more capacity to shift the per-capita ratio. That is one reason the YoY column should be read with country size in mind.
Can this ranking change quickly?
Yes. Utility-scale wind, solar or hydro projects can move smaller systems up the table quickly. But the very top is usually sticky because the leaders already sit many multiples above the world average.
Full Top 100 ranking
The full table below keeps every row in the HTML source. Search, sorting and filters only reorganize or hide existing rows; no country is injected via JavaScript. Because renewable capacity per person is already a normalized metric, the alternate view switches from watts per person to an index with the world average set to 100, which is analytically cleaner than showing a “share of global total” for a per-person indicator.
| Rank | Country | Value | YoY |
|---|---|---|---|
| 1 | Iceland | 7,7221820.6 | −0.7% |
| 2 | Norway | 7,2961720.2 | +0.0% |
| 3 | Sweden | 3,606850.2 | +9.1% |
| 4 | Bhutan | 2,985703.8 | −0.6% |
| 5 | Canada | 2,779655.2 | +1.7% |
| 6 | Austria | 2,620617.7 | +5.7% |
| 7 | Switzerland | 2,257532.1 | +3.1% |
| 8 | Finland | 2,183514.7 | +26.3% |
| 9 | Denmark | 2,102495.6 | +13.1% |
| 10 | Australia | 1,865439.7 | +7.7% |
| 11 | Germany | 1,780419.7 | +7.2% |
| 12 | Netherlands | 1,625383.1 | +20.5% |
| 13 | Portugal | 1,590374.9 | +8.5% |
| 14 | New Zealand | 1,504354.6 | −0.3% |
| 15 | Spain | 1,428336.7 | +9.3% |
| 16 | Greece | 1,345317.1 | +12.8% |
| 17 | Montenegro | 1,335314.7 | +2.5% |
| 18 | Paraguay | 1,306307.9 | −1.1% |
| 19 | Laos | 1,278301.3 | +6.2% |
| 20 | Belgium | 1,123264.8 | +9.7% |
| 21 | Uruguay | 1,097258.6 | +2.8% |
| 22 | Latvia | 1,062250.4 | +2.0% |
| 23 | United States | 1,040245.2 | +8.2% |
| 24 | Ireland | 1,015239.3 | +5.8% |
| 25 | Italy | 1,014239.1 | +10.0% |
| 26 | France | 1,012238.6 | +9.2% |
| 27 | Japan | 980231.1 | +2.4% |
| 28 | Chile | 959226.1 | +4.8% |
| 29 | Albania | 893210.5 | −0.3% |
| 30 | Croatia | 892210.3 | +0.1% |
| 31 | Estonia | 888209.4 | +1.4% |
| 32 | Slovenia | 886208.9 | +0.2% |
| 33 | Luxembourg | 884208.4 | +13.9% |
| 34 | Georgia | 837197.3 | +7.6% |
| 35 | China | 814191.9 | +8.0% |
| 36 | Brazil | 814191.9 | +6.8% |
| 37 | United Kingdom | 785185.1 | +7.7% |
| 38 | Bulgaria | 768181.1 | +0.9% |
| 39 | Andorra | 693163.4 | +15.5% |
| 40 | Türkiye | 656154.7 | +4.0% |
| 41 | Bosnia and Herzegovina | 646152.3 | +1.3% |
| 42 | Panama | 635149.7 | +6.7% |
| 43 | Costa Rica | 606142.9 | +2.5% |
| 44 | South Korea | 601141.7 | −1.6% |
| 45 | Venezuela | 600141.5 | 0.0% |
| 46 | Lithuania | 588138.6 | +4.3% |
| 47 | Armenia | 569134.1 | +0.2% |
| 48 | Romania | 567133.7 | +0.9% |
| 49 | Poland | 533125.7 | +1.1% |
| 50 | Tajikistan | 530125.0 | 0.0% |
| 51 | Israel | 495116.7 | +6.0% |
| 52 | Cyprus | 481113.4 | +3.4% |
| 53 | Czech Republic | 470110.8 | +6.8% |
| 54 | Vietnam | 462108.9 | +7.9% |
| 55 | Slovakia | 426100.4 | +1.2% |
| 56 | Serbia | 42399.7 | +6.3% |
| 57 | Malta | 42399.7 | +12.5% |
| 58 | Kyrgyzstan | 41998.8 | +14.8% |
| 59 | Hungary | 39492.9 | +0.3% |
| 60 | Russia | 39392.6 | +0.5% |
| 61 | North Macedonia | 39292.4 | +1.3% |
| 62 | United Arab Emirates | 38089.6 | +16.6% |
| 63 | Ukraine | 37688.6 | −28.0% |
| 64 | Argentina | 33278.3 | +6.1% |
| 65 | Suriname | 31273.6 | +10.6% |
| 66 | Qatar | 30672.1 | +16.8% |
| 67 | Ecuador | 30070.7 | +11.1% |
| 68 | Malaysia | 26662.7 | −4.3% |
| 69 | El Salvador | 26662.7 | +6.8% |
| 70 | Kazakhstan | 26161.5 | +0.4% |
| 71 | Colombia | 26061.3 | +1.6% |
| 72 | Mexico | 25159.2 | +2.0% |
| 73 | Nauru | 25058.9 | +8.2% |
| 74 | Barbados | 24958.7 | −4.2% |
| 75 | Belize | 24457.5 | −5.1% |
| 76 | Palau | 24056.6 | +400.0% |
| 77 | Fiji | 23655.6 | +4.4% |
| 78 | Seychelles | 22853.8 | 0.0% |
| 79 | Jordan | 22653.3 | +9.2% |
| 80 | Mauritius | 20949.3 | +10.6% |
| 81 | Namibia | 20849.0 | +3.5% |
| 82 | Tuvalu | 20448.1 | −1.0% |
| 83 | Peru | 18944.6 | −1.0% |
| 84 | North Korea | 18944.6 | 0.0% |
| 85 | Honduras | 18643.9 | +1.6% |
| 86 | South Africa | 17541.3 | +0.6% |
| 87 | Thailand | 17040.1 | 0.0% |
| 88 | Dominican Republic | 16739.4 | +11.3% |
| 89 | Zambia | 16538.9 | +13.0% |
| 90 | Oman | 15436.3 | +242.2% |
| 91 | Guatemala | 15235.8 | −0.7% |
| 92 | Eswatini | 14935.1 | −0.7% |
| 93 | Singapore | 14233.5 | +21.4% |
| 94 | Tonga | 14133.2 | +80.8% |
| 95 | Iran | 14033.0 | +2.9% |
| 96 | Gabon | 13932.8 | −2.1% |
| 97 | Antigua and Barbuda | 13732.3 | −0.7% |
| 98 | Lebanon | 13331.4 | +54.7% |
| 99 | Samoa | 13130.9 | −1.5% |
| 100 | Sri Lanka | 13130.9 | +4.8% |
Latest official cross-country per-capita benchmark used here: 2022. World average: 424.1 watts per person. Alternate view: index where the world average = 100. Source base: World Bank SE4ALL / SDG 7.b.1, derived from IRENA renewable-capacity data and UN population data.
Figure 2. Capacity per person versus year-on-year change
This scatter chart uses the same latest verified cross-country benchmark and plots renewable capacity per person on the horizontal axis against the year-on-year change from 2021 to 2022 on the vertical axis. The chart is useful for separating countries that already have dense renewable infrastructure from countries that are still lower on the absolute level but are moving quickly.
How to interpret the ranking
The table is not a league of “best energy systems” in a broad sense. It is a structural indicator of how much renewable electricity-generating capacity a country has installed relative to population. Countries rank high for different reasons. In Iceland and Norway, abundant hydro and geothermal resources meet very small populations. In Sweden, Denmark, Finland and Portugal, policy continuity and grid integration matter as much as natural endowments. In Bhutan and Laos, large hydro projects dominate the ratio. In countries such as Canada, Australia and Spain, large resource bases combine with sustained investment in utility-scale projects.
What the ranking does particularly well is highlight infrastructure depth. A country with a high per-capita ratio has usually already made major long-term decisions about networks, project pipelines, balancing capacity and system planning. What it does less well is capture how much renewable electricity is actually generated year to year, how well grids are managed under peak stress, or whether the transition is inclusive and affordable. Those questions require additional indicators such as renewable generation share, curtailment, storage capacity, interconnection, retail prices and emissions intensity.
Policy takeaways
- Per-capita leaders show that renewable scale is not only about country size. Small and medium-sized systems can build very deep renewable capacity if planning, financing and grid policy are aligned over many years.
- Hydro and wind still shape the top of the ranking more than solar alone. Solar is now the fastest global growth engine, but hydro-rich and wind-intensive systems continue to dominate the installed-capacity-per-person frontier.
- Large economies should not be judged only by their ranking position. China and the United States matter enormously for the global transition because they add huge volumes of capacity, even if their per-person ratios remain below the frontier countries.
- Fast population growth raises the bar. Countries in Africa and parts of Asia must add renewables at a pace that outstrips both legacy fossil additions and population growth if they want their watts-per-person ratio to rise materially.
- For emerging markets, the strategic question is not just how much capacity to add, but what mix to build. Hydro, wind, solar, transmission, storage and flexible demand all shape whether high installed capacity translates into reliable and affordable electricity.
Reading the 2025 picture correctly
IRENA’s 2025 publication confirms that the global renewable build-out accelerated sharply in 2024, with renewables accounting for more than nine-tenths of net power-capacity additions worldwide. That tells us the direction of travel is still strong. The per-capita ranking shown on this page adds a second layer: it shows where renewable infrastructure is already dense relative to the size of the resident population. Used together, the two lenses are more informative than either one alone. The 2024 global market story is about speed and scale. The per-capita story is about installed depth and relative system penetration.
That is why the ranking is especially useful for analysts comparing countries that look similar on renewable generation shares but very different on installed infrastructure. It is also useful for avoiding a common mistake: confusing “the biggest renewable market” with “the most renewable-intensive electricity system per resident.” These are related but distinct ideas, and serious energy analysis needs both.
Official sources
Main source for the end-2024 renewable electricity capacity context and the official country capacity tables used in IRENA’s annual statistical release.
https://www.irena.org/publications/2025/mar/renewable-capacity-statistics-2025Official country/technology table that defines renewable electricity installed capacity in megawatts and documents year-end installed-capacity coverage by country and technology.
https://pxweb.irena.org/pxweb/en/IRENASTAT/IRENASTAT__Power%20Capacity%20and%20Generation/Country_ELECSTAT_2025_H2_PX.px/Official World Bank distribution point for the SE4ALL/SDG dataset used here for the cross-country per-capita ranking. The relevant indicator is installed renewable electricity-generating capacity in watts per capita.
https://data360.worldbank.org/en/dataset/WB_SE4ALLOfficial United Nations population dataset referenced in SDG 7.b.1 methodology for the population denominator used in renewable-capacity-per-person calculations.
https://www.un.org/development/desa/pd/content/World-Population-Prospects-2024Official metadata page describing how installed renewable electricity-generating capacity per capita is defined and compiled for SDG monitoring.
https://unstats.un.org/sdgs/metadata/files/Metadata-07-0b-01.pdfStatRanker (Website)
administrator
