

Natural Graphite Mine Production by Country, 2025: USGS Ranking
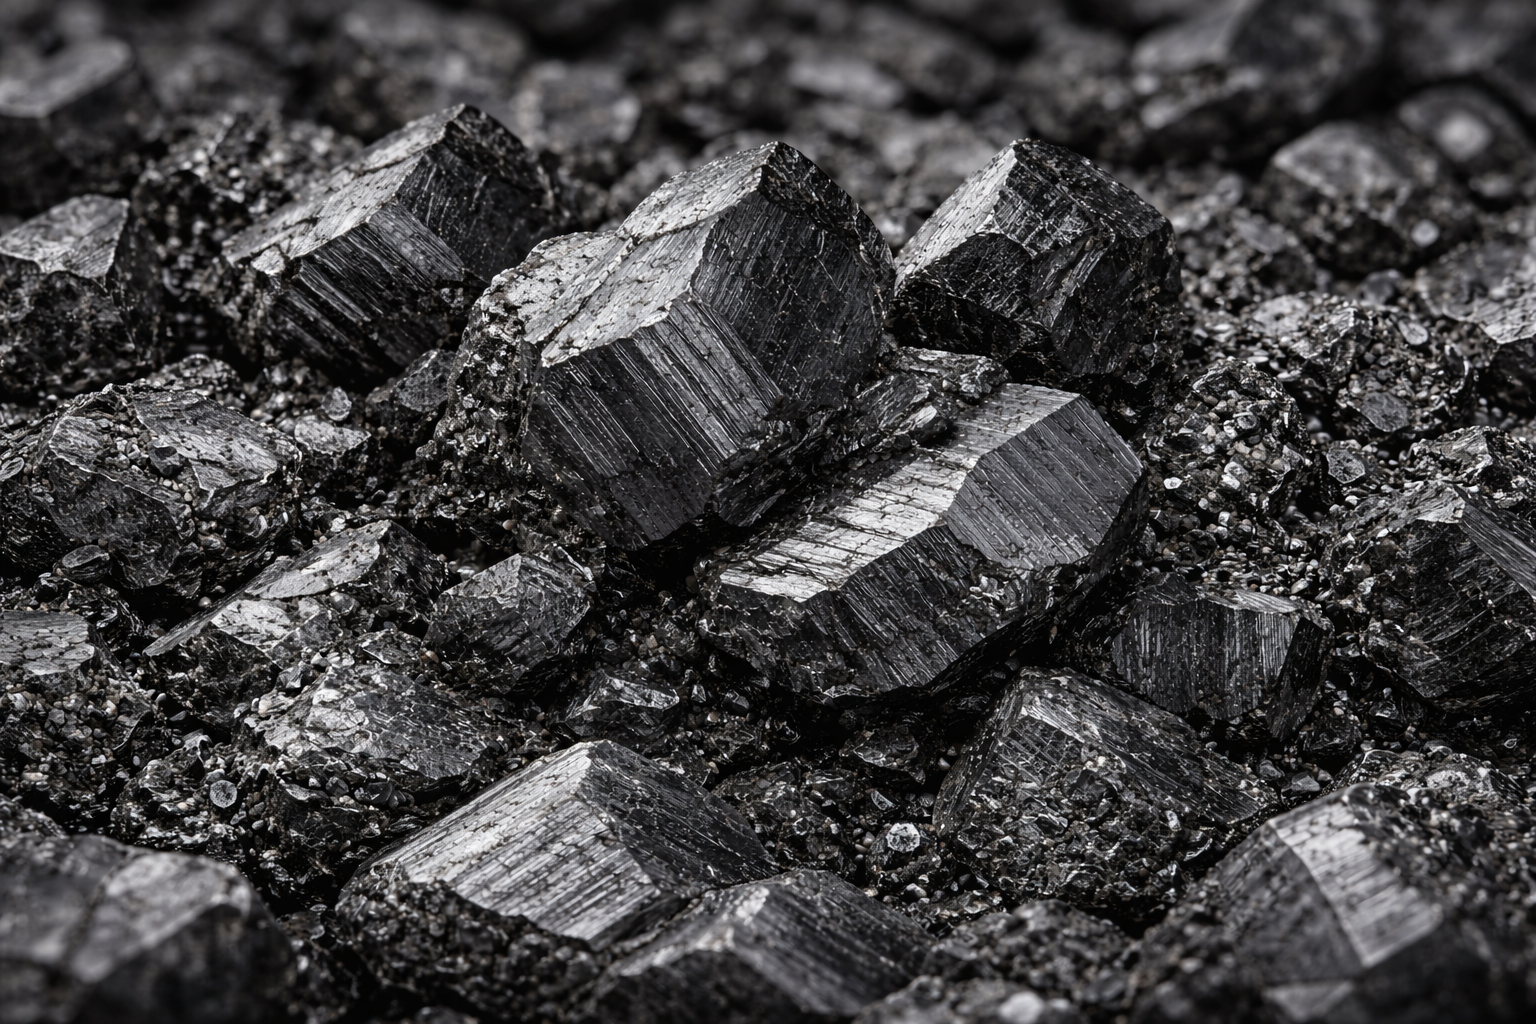
2025 Natural Graphite Production Snapshot
China was the largest natural graphite mine producer in 2025, with U.S. Geological Survey estimated output of 1.4 million metric tons. Madagascar ranked second at 80,000 metric tons, followed by Tanzania at 75,000 metric tons, Brazil at 65,000 metric tons and Mozambique at 60,000 metric tons.
The metric is natural graphite mine production in metric tons. The source is the U.S. Geological Survey Mineral Commodity Summaries 2026, where the 2025 column is marked “e” for estimated. Higher mine output ranks higher.
Coverage: all 18 countries with positive 2025 production individually listed by USGS. All ranking rows use USGS 2025e estimates. No independent forecasts or modeled projections are included.
Continue exploring
More StatRanker pages connected by topic, category or ranking theme.
Iron Ore Mine Production by Country 2026: 2025 USGS Estimates
Open rankingGold Production by Country 2026: 2025 USGS Mine-Production Estimates
Open rankingDry Natural Gas Production by Country 2026: EIA 2024 Ranking
Open rankingChina accounts for the largest 2025e natural graphite mine output in the USGS table.
Madagascar ranks second, well below China by absolute mine output.
Every country with positive 2025e production individually listed by USGS is included.
USGS reports the global 2025 mine-production total as a rounded estimate.
No forecast or modeled-projection rows are mixed into the ranking.
Overview: where natural graphite was mined in 2025
Natural graphite mine production was concentrated in a small number of countries. China’s estimated 1.4 million metric tons represented about 77.8% of the rounded USGS world total of 1.8 million metric tons.
The difference between the first two positions is substantial. China produced an estimated 17.5 times as much natural graphite as Madagascar, while Madagascar and Tanzania were separated by only 5,000 metric tons.
Brazil and Mozambique completed the five largest producers. Combined output from China, Madagascar, Tanzania, Brazil and Mozambique reached 1.68 million metric tons, equivalent to about 93.3% of the rounded world total.
Production falls sharply below the five largest producers. Russia was estimated at 25,000 metric tons and India at 17,000 metric tons. Canada and North Korea each recorded 8,000 metric tons, while every remaining country in the USGS table was below 7,000 metric tons.
This ranking measures mine output only. It does not rank synthetic graphite production, reserves, processing capacity, purified spherical graphite, battery-anode material, exports or graphite quality.
Top 10 natural graphite producers in 2025
The top of the ranking is dominated by China, followed by a much smaller group of producers in Africa and South America. Russia, India, Canada, North Korea and Norway complete the first ten country entries.
Top 10 countries by natural graphite mine output, USGS 2025e
| Rank | Country | Production | Region / note |
|---|---|---|---|
| 1 | China | 1,400,000 t | East Asia; USGS 2025e estimate. |
| 2 | Madagascar | 80,000 t | Africa; USGS 2025e estimate. |
| 3 | Tanzania | 75,000 t | Africa; USGS 2025e estimate. |
| 4 | Brazil | 65,000 t | South America; USGS 2025e estimate. |
| 5 | Mozambique | 60,000 t | Africa; USGS 2025e estimate. |
| 6 | Russia | 25,000 t | Eurasia; USGS 2025e estimate. |
| 7 | India | 17,000 t | South Asia; USGS 2025e estimate. |
| 8 | Canada | 8,000 t | North America; USGS 2025e estimate; tied at 8,000 t. |
| 8 | North Korea | 8,000 t | East Asia; USGS 2025e estimate; tied at 8,000 t. |
| 10 | Norway | 6,600 t | Europe; USGS 2025e estimate. |
Rank is calculated from production in descending order. Equal production values share the same rank.
Chart: natural graphite mine output across all 18 producers
China sets the scale at 1.4 million metric tons. The numeric labels show the underlying USGS estimates, while a minimum visible bar width keeps small producers readable.
Methodology and ranking rules
The ranking uses the Graphite (Natural) chapter of the U.S. Geological Survey Mineral Commodity Summaries 2026. The metric is natural graphite mine production during 2025, measured in metric tons.
Metric and unit
The table measures mined natural graphite output in metric tons. Synthetic graphite and downstream processed products are outside the metric.
Ranking direction
Production is ranked in descending order. Countries with equal production values share the same rank.
Target year
Every row uses the USGS 2025e estimate published in Mineral Commodity Summaries 2026. No 2024 value is substituted into the ranking.
Coverage
USGS individually lists 18 countries with positive 2025 natural graphite mine output. All 18 are included, so the ranking is not presented as a Top 30.
Estimate status
USGS uses “e” to identify estimated values. These figures are source-published 2025 estimates, not independently modeled future projections.
Geographic tags
Region labels are used only to organize and filter the table. They are not part of the USGS production series and do not affect rank.
No CAGR, interpolation, growth assumption or independent production forecast is applied. Values are transcribed from the USGS 2025e mine-production column.
The United States is not ranked because USGS reports zero natural graphite mine production for 2025. The ranking includes only countries with positive production.
USGS reports the 2025 world total as a rounded 1.8 million metric tons. The 18 individually listed positive values sum to 1,752,880 metric tons. Percentage shares calculated from the rounded global total are therefore approximate.
The metric does not measure reserves, resources, ore grade, graphite purity, mine capacity, processing capacity, exports, synthetic graphite, purified spherical graphite or finished battery-anode material.
Full ranking of 18 confirmed producers
The table contains every country with positive 2025 natural graphite mine production individually listed by USGS. Search and filters change only the visible rows; the underlying values and ranks remain unchanged.
Natural graphite mine production by country, USGS 2025e
| Rank | Country | Production | Region / note |
|---|---|---|---|
| 1 | China | 1,400,000 t | East Asia; USGS 2025e estimate. |
| 2 | Madagascar | 80,000 t | Africa; USGS 2025e estimate. |
| 3 | Tanzania | 75,000 t | Africa; USGS 2025e estimate. |
| 4 | Brazil | 65,000 t | South America; USGS 2025e estimate. |
| 5 | Mozambique | 60,000 t | Africa; USGS 2025e estimate. |
| 6 | Russia | 25,000 t | Eurasia; USGS 2025e estimate. |
| 7 | India | 17,000 t | South Asia; USGS 2025e estimate. |
| 8 | Canada | 8,000 t | North America; USGS 2025e estimate; tied at 8,000 t. |
| 8 | North Korea | 8,000 t | East Asia; USGS 2025e estimate; tied at 8,000 t. |
| 10 | Norway | 6,600 t | Europe; USGS 2025e estimate. |
| 11 | Sri Lanka | 3,200 t | South Asia; USGS 2025e estimate. |
| 12 | Turkey | 2,200 t | Eurasia; USGS 2025e estimate. |
| 13 | Ukraine | 800 t | Europe; USGS 2025e estimate. |
| 14 | Mexico | 740 t | North America; USGS 2025e estimate. |
| 15 | South Korea | 500 t | East Asia; USGS 2025e estimate; tied at 500 t. |
| 15 | Vietnam | 500 t | Southeast Asia; USGS 2025e estimate; tied at 500 t. |
| 17 | Austria | 200 t | Europe; USGS 2025e estimate. |
| 18 | Germany | 140 t | Europe; USGS 2025e estimate. |
USGS reports the 2025 world total as a rounded 1,800,000 metric tons. The 18 positive country values individually listed in the table sum to 1,752,880 metric tons.
What stands out in the 2025 ranking
Key Insight
The five largest producers generated an estimated 1.68 million metric tons, approximately 93.3% of the rounded USGS world total.
Notable Pattern
Output falls sharply after Mozambique. Russia ranks sixth at 25,000 metric tons, compared with Mozambique’s 60,000 metric tons.
Regional Concentration
Madagascar, Tanzania and Mozambique together produced an estimated 215,000 metric tons, about 11.9% of the rounded global total.
Outlier
China produced an estimated 17.5 times as much natural graphite as second-ranked Madagascar, creating a large gap between first and second place.
How to interpret natural graphite mine output
Mine production shows where natural graphite was extracted during 2025. It does not measure the complete graphite supply chain because mined material can undergo concentration, purification, shaping and coating before reaching downstream industrial applications.
Production also differs from reserves. Annual mine output measures material produced during a specific year, while reserves describe economically recoverable material under defined technical and economic conditions.
The USGS 2025 figures are estimates rather than modeled future values. Later mineral-statistics releases can revise country estimates as additional reporting becomes available.
Synthetic graphite is excluded. Because synthetic graphite is manufactured rather than mined, combining it with natural graphite mine production would mix two different production measures.
Country shares based on the 1.8 million-ton world figure should be treated as approximate because USGS publishes the global total in rounded form.
FAQ
Which country produced the most natural graphite in 2025?
China ranked first with estimated natural graphite mine production of 1.4 million metric tons in USGS Mineral Commodity Summaries 2026.
How much natural graphite was mined worldwide in 2025?
USGS reports a rounded world mine-production total of approximately 1.8 million metric tons for 2025.
Which countries were the five largest producers?
China, Madagascar, Tanzania, Brazil and Mozambique were the five largest producers in the USGS 2025 estimates.
What does 2025e mean?
The “e” means estimated. USGS uses this notation for its 2025 mine-production estimates.
Does this ranking include synthetic graphite?
No. The ranking covers natural graphite mine production only. Synthetic graphite is manufactured and is outside this metric.
Why is the United States not ranked?
USGS reports zero U.S. natural graphite mine production for 2025. The ranking contains countries with positive mine output.
How are equal production values ranked?
Equal values share the same rank. Canada and North Korea both rank eighth at 8,000 metric tons, while South Korea and Vietnam both rank fifteenth at 500 metric tons.
Is mine production the same as graphite reserves?
No. Mine production measures annual output, while reserves measure economically recoverable material under defined conditions.
Why does the sum of country values differ from the world total?
The 18 positive country values sum to 1,752,880 metric tons, while USGS reports the world total as a rounded 1.8 million metric tons.
Sources
USGS — Mineral Commodity Summaries 2026: Graphite (Natural)
Primary source for every 2025 country mine-production value, the estimate notation and the rounded world total.
https://pubs.usgs.gov/periodicals/mcs2026/mcs2026-graphite.pdf
USGS — Mineral Commodity Summaries 2026
Official publication record for the 2026 Mineral Commodity Summaries and its worldwide 2025 mineral-production coverage.
USGS — Mineral Commodity Summaries 2026 Data Release
Official USGS data-release record associated with the 2026 Mineral Commodity Summaries.
https://data.usgs.gov/datacatalog/data/USGS%3A69837e43b66b01367d7ec7c7
USGS — Graphite Statistics and Information
Supporting USGS commodity page for natural graphite statistics, annual publications and historical information.
Related rankings
More StatRanker pages connected by topic, category or ranking theme.
Top 20 Countries by Rare Earth Mine Production, 2025
Open rankingCountries by Phosphate Rock Mine Production, 2025
Open rankingTop 50 Countries by Uranium Mine Production (2025 Edition)
Open rankingTop 100 Countries by Bauxite Mine Production (2025) — Ranking, Concentration, and Aluminium Linkages
Open ranking
StatRanker (Website)
administrator
