


Top 100 Countries by Forest Area per Capita, 2025
Forest Area per Capita: the “Forest per Person” ranking (verified leaders, draft long-list)
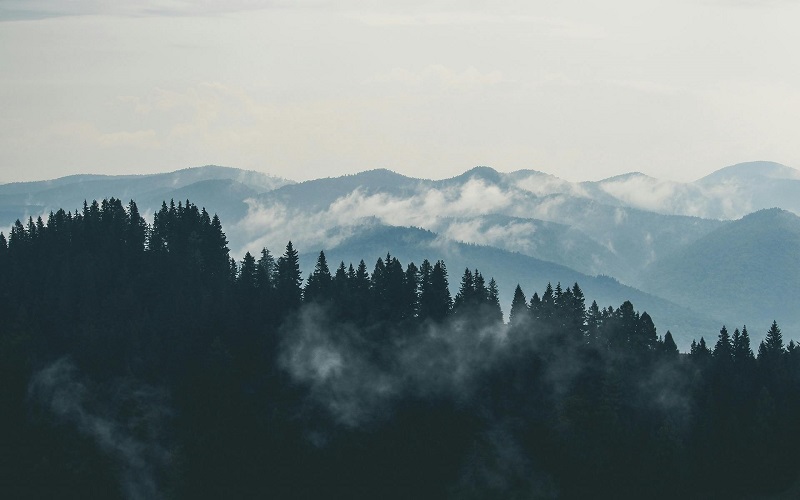
Forests matter far beyond scenery. They store carbon, regulate local and regional water cycles, support biodiversity, and provide livelihoods through timber, non-timber products, recreation, and ecosystem services. But when countries differ by orders of magnitude in population size, “total forest area” alone can mislead. Forest area per capita is a simple, intuitive lens: how much forest (in hectares) falls, on average, to one resident.
Thank you for reading this post, don't forget to subscribe!This ranking is designed for comparison and public understanding. Values are rounded and intended to be harmonised for cross-country comparability rather than to replicate every national statistical nuance. In the current edition, the forest-area side of the calculation follows the latest World Bank forest series, which is publicly available through 2023. The point is to read patterns: which countries are “forest-abundant per person”, and why.
Method in one formula
We compute forest area per capita as Forest area ÷ Population. Forest area is expressed in square kilometres in many international datasets; we convert to hectares (1 km² = 100 ha) and then divide by same-year population estimates. “Forest” here follows international definitions (minimum area, canopy, and tree height thresholds), so it is not the same as “any trees anywhere”.
Continue exploring
More StatRanker pages connected by topic, category or ranking theme.
Countries by Forest Area per Person ТОП-100, 2026
Open rankingFor this page, the forest series is based on the latest World Bank WDI forest-area indicator available on the public site, which currently runs through 2023. That means the ranking should be read as a 2023-based latest-available forest snapshot, not as a literal 2025 measurement.
Units: hectares per person (ha/person). Interpretation: higher values mean more forest relative to population, not automatically “better forest governance”.
Table 1 — Verified leaders by forest area per capita (ha/person)
| Rank | Country | Forest area per capita (ha/person) |
|---|---|---|
| 1 | Suriname | 23.5 |
| 2 | Guyana | 21.8 |
| 3 | Gabon | 9.1 |
| 4 | Canada | 8.7 |
| 5 | Russian Federation | 5.6 |
| 6 | Finland | 3.9 |
| 7 | Papua New Guinea | 3.3 |
| 8 | Sweden | 2.6 |
| 9 | Brazil | 2.4 |
| 10 | Bolivia | 2.3 |
Why these leaders? The common pattern is small or moderate populations combined with large forest estates (often boreal or tropical forest biomes). The ranking rewards forest-rich geography and low population density— not necessarily economic development.
Bar chart — Top 20 countries by forest area per capita
Bars show the Top 20 (to reveal the “long tail” beyond the Top 10 table). Values are rounded. Forest per person can be extremely high in small countries with extensive forests—so the first few ranks may dominate the scale.
Patterns behind the verified leaders: biome, population density, and the “wealth–forest” mix
Forest area per capita is strongly shaped by geography and demography. At the top you typically see either tropical forest countries with small populations (large rainforest belts, low population density) or boreal forest countries where vast conifer forests meet moderate populations. In both cases, the numerator (forest area) is large relative to the denominator (people).
Three recurring “country types” in the Top 100
Type 1 Small population + large intact forest estate (often tropical). A small change in population or forest area can move these countries noticeably in per-capita terms.
Type 2 Boreal giants with extensive forests and long-running forest management institutions. Their per-capita advantage mostly comes from vast land area and low density rather than unusually high forest cover percentages.
Type 3 Mid-rank “working forests” where forestry, agriculture, conservation, and settlement all compete. These countries can have respectable per-capita forest even with moderate density, but the ranking becomes more sensitive to land-use policy.
Important caveat: a high “forest per person” value does not guarantee sustainability. Two countries can have the same per-capita forest but very different outcomes depending on governance, enforcement, protected-area coverage, indigenous land rights, and the economics of timber and agriculture. There is also a timing caveat: the ranking uses the latest public forest series, which currently runs through 2023.
Verification caveat: the full Top 100 table below should not yet be treated as publication-ready. Spot checks already show arithmetic inconsistencies in some rows, so the complete ranking still needs a clean source-based rerun before it can be trusted as a final ordered list.
Historical appendix — Top 100 by forest area per capita (2017 reference table)
This appendix restores a full long-list for readers who want broader country coverage, but it is presented honestly as a historical comparative reference, not as a replacement for a latest-year World Bank rerank. It is assembled from the accessible Worldometer country table that cites FAOSTAT forest area and UN population (2017).
Formatting note: to keep this page stable on desktop and mobile, the appendix below shows the first 40 rows inline. The full historical Top 100 remains available in the separate source file collected for this draft.
| Rank | Country | ha/person | Context |
|---|---|---|---|
| 1 | French Guiana | 29.4296 | Forest: 8,126,800 ha Population: 276,144 |
| 2 | Suriname | 25.8111 | Forest: 15,324,400 ha Population: 593,713 |
| 3 | Guyana | 21.4788 | Forest: 16,506,000 ha Population: 768,479 |
| 4 | Gabon | 10.8489 | Forest: 23,400,000 ha Population: 2,156,900 |
| 5 | Niue | 10.0562 | Forest: 17,900 ha Population: 1,780 |
| 6 | Canada | 9.4265 | Forest: 346,975,800 ha Population: 36,808,497 |
| 7 | Russia | 5.5740 | Forest: 814,848,460 ha Population: 146,186,799 |
| 8 | Australia | 5.0692 | Forest: 125,367,000 ha Population: 24,731,038 |
| 9 | Bolivia | 4.7764 | Forest: 54,186,000 ha Population: 11,344,587 |
| 10 | Botswana | 4.6920 | Forest: 10,635,600 ha Population: 2,266,747 |
| 11 | Central African Republic | 4.6185 | Forest: 22,138,800 ha Population: 4,793,511 |
| 12 | Congo | 4.1680 | Forest: 22,303,200 ha Population: 5,351,011 |
| 13 | Finland | 4.0335 | Forest: 22,218,000 ha Population: 5,508,396 |
| 14 | Mongolia | 3.9809 | Forest: 12,358,240 ha Population: 3,104,364 |
| 15 | Bhutan | 3.6784 | Forest: 2,774,770 ha Population: 754,335 |
| 16 | Papua New Guinea | 3.6556 | Forest: 33,553,400 ha Population: 9,178,714 |
| 17 | Belize | 3.6341 | Forest: 1,356,260 ha Population: 373,202 |
| 18 | Solomon Islands | 3.1703 | Forest: 2,173,800 ha Population: 685,672 |
| 19 | New Caledonia | 2.9590 | Forest: 839,000 ha Population: 283,546 |
| 20 | Sweden | 2.7911 | Forest: 28,073,000 ha Population: 10,057,862 |
| 21 | Zambia | 2.7694 | Forest: 48,301,800 ha Population: 17,441,320 |
| 22 | Laos | 2.7272 | Forest: 19,139,750 ha Population: 7,018,147 |
| 23 | Namibia | 2.7008 | Forest: 6,770,600 ha Population: 2,506,853 |
| 24 | Brazil | 2.4014 | Forest: 491,570,000 ha Population: 204,703,445 |
| 25 | Peru | 2.3508 | Forest: 73,637,800 ha Population: 31,324,637 |
| 26 | Paraguay | 2.3147 | Forest: 14,672,200 ha Population: 6,338,660 |
| 27 | Norway | 2.2961 | Forest: 12,116,000 ha Population: 5,276,802 |
| 28 | Palau | 2.2625 | Forest: 40,300 ha Population: 17,812 |
| 29 | New Zealand | 2.1095 | Forest: 10,152,400 ha Population: 4,812,752 |
| 30 | Angola | 1.9053 | Forest: 57,606,400 ha Population: 30,234,839 |
| 31 | DR Congo | 1.7449 | Forest: 151,955,200 ha Population: 87,083,398 |
| 32 | Latvia | 1.7280 | Forest: 3,356,800 ha Population: 1,942,594 |
| 33 | Estonia | 1.6936 | Forest: 2,231,200 ha Population: 1,317,425 |
| 34 | Vanuatu | 1.5799 | Forest: 440,000 ha Population: 278,507 |
| 35 | Venezuela | 1.5166 | Forest: 46,354,200 ha Population: 30,565,323 |
| 36 | Western Sahara | 1.3786 | Forest: 707,000 ha Population: 512,843 |
| 37 | Montenegro | 1.3336 | Forest: 827,000 ha Population: 620,114 |
| 38 | Mozambique | 1.3323 | Forest: 37,527,200 ha Population: 28,166,393 |
| 39 | Bahamas | 1.3189 | Forest: 515,000 ha Population: 390,485 |
| 40 | Colombia | 1.2144 | Forest: 58,448,300 ha Population: 48,131,078 |
Scatter — forest area per capita vs GDP per capita (Top 20)
Each point is one of the Top 20 countries by forest per person. The x-axis uses GDP per capita (current US$) as a rough income proxy; the y-axis is forest area per capita. This view often reveals “two worlds”: high-income boreal countries with strong institutions, and lower-income tropical or mixed-biome countries where forest outcomes depend heavily on land-use incentives and enforcement. GDP values are approximate (rounded to the nearest few hundred/thousand) and reflect the most recent annual data commonly available.
What the ranking means (and what it does not)
Data verification status
The page framing and methodology are now aligned with the latest publicly available World Bank forest series (through 2023), but the longer draft ranking still contains embedded rows that need recalculation. Until the ranking is rebuilt from one clean forest-area export and one matching population series, the page should be read as an analytical draft rather than a final publication-ready table.
A “forest per person” ranking can be read in two ways at once: as a resource endowment indicator and as a pressure indicator. High forest area per capita suggests that, in pure spatial terms, a country has a large forest estate relative to its population. That can be an advantage for biodiversity and climate mitigation potential, and it can support forestry, tourism, and ecosystem services.
But the metric is not a direct measure of forest quality, intactness, or sustainability. It does not tell you whether forests are primary or planted, whether they are fragmented, or how rapidly forest cover is changing. Two countries can rank similarly and still face very different risks: illegal logging, agricultural expansion, wildfire, pests, or weak enforcement.
How to use forest area per capita responsibly
Treat the ranking as a starting point for deeper questions. If a country ranks high, ask: is its forest estate stable over time? How much is protected? What share is managed for production vs conservation? If a country ranks low, ask: is it genuinely forest-scarce, or is it densely populated with forests concentrated in protected areas or remote regions?
For comparative work, pairing this metric with forest-change indicators (net loss/gain), protected-area share, and governance proxies gives a far more complete picture than any single ranking can provide.
Policy takeaway (key implications)
- High forest per capita is an opportunity, not a guarantee. Countries with large forest endowments can translate this into climate and biodiversity benefits only with credible land-use rules, enforcement, and long-term planning.
- Low forest per capita does not mean “no forest policy”. In dense countries, small changes in forest area can have outsized effects on recreation, heat mitigation, and ecosystem services—especially near cities.
- Income is not destiny. The scatter view shows both high-income and lower-income countries among forest-abundant leaders. Outcomes diverge based on incentives (timber/agriculture), tenure rights, protected areas, and monitoring capacity.
- Communications matter. “Forest per person” is an intuitive statistic for public debate, but it should be presented with context: definitions, year coverage, and complementary indicators of forest change and quality.
Note: Values in this article are rounded and compiled for comparability. The forest-area side of the ranking is based on the latest public World Bank series, which currently runs through 2023. Table 1 and the upper segment look directionally plausible, but the longer ranking block still requires a full source-based rerank before it should be treated as final. For official reporting, always consult the original datasets and country metadata.
Primary data sources and technical notes
The ranking is derived from widely used international statistical series. Forest area per capita is computed by combining forest area with population. GDP per capita is used only for the scatter comparison and is shown as an approximate, rounded value.
World Bank — World Development Indicators (WDI): Forest area (sq. km), code AG.LND.FRST.K2. Forest area definition and annual country series used as the base forest numerator.
World Bank — WDI metadata: Forest area definition. Short definition clarifies what is included/excluded (e.g., excludes agroforestry systems and urban parks).
World Bank — WDI: Population, total, code SP.POP.TOTL. Mid-year population estimates used as the denominator.
FAO — Global Forest Resources Assessment (FRA) 2025. The latest global FRA framework is now available and is the more current umbrella reference for concepts, reporting architecture and forest-resource context.
FAO FRA 2025 — Terms and definitions. Use the latest FRA terminology reference when explaining what counts as forest and how international reporting categories are distinguished.
World Bank — WDI: GDP per capita (current US$), code NY.GDP.PCAP.CD. Used as a simple income proxy for the scatter comparison. This chart is illustrative rather than causal, so the GDP series should be read as context, not as an explanation by itself.
Related rankings
More StatRanker pages connected by topic, category or ranking theme.
Countries by Forest Area per Person ТОП-100, 2026
Open rankingStatRanker (Website)
administrator
