

Inflation Time Machine: Was Life Really Cheaper in 2000?
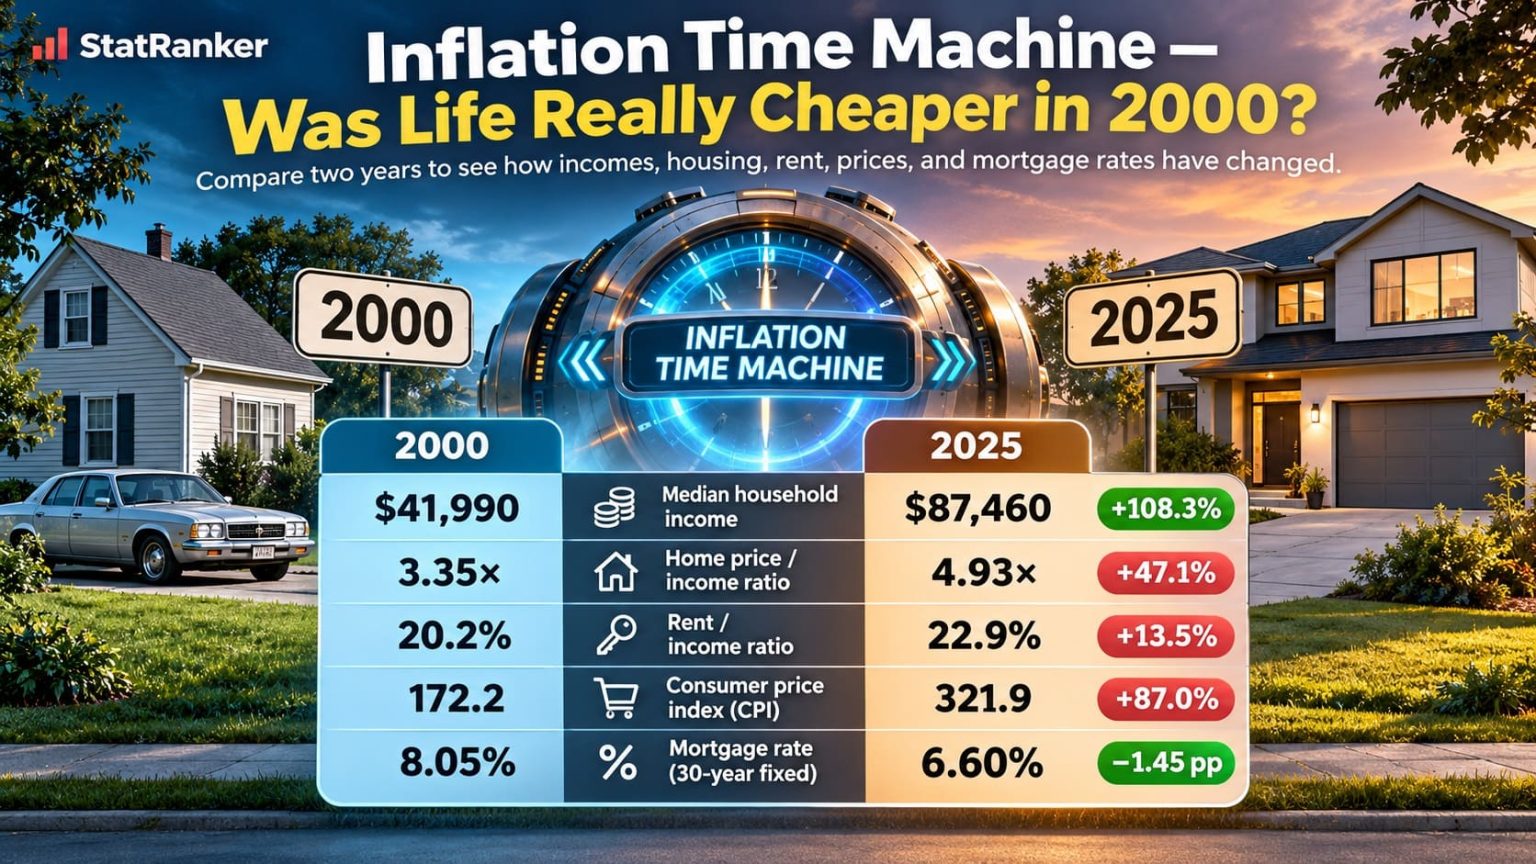
Compare the Cost of Living Across Two Years
Select any two years to compare U.S. household income, inflation, housing, rent and mortgage rates. Enter your own income to see how the results change for you.
The comparison uses 26 years of historical data from Census, BLS, FHFA and Freddie Mac. Housing and rent affordability measures are index-based estimates, not actual home prices or monthly rent. Sources checked November 8, 2026.
Choose two years
Annual U.S. data make it possible to compare the same measures across years. Leave personal-income fields empty to use Census median household income for both years.
Optional: compare your own household income
Personal inputs stay in your browser and are not sent to a server. Enter both incomes to calculate your own change.
2000 vs 2025: the detailed comparison
Official historical observations and calculated affordability indicators for the selected years.
| Metric | 2000 | 2025 | Change |
|---|---|---|---|
| Household incomeCensus annual median, current US$ | $41,990 | $87,460 | +108.3% |
| Consumer Price Index (CPI-U)BLS annual all-items average, 1982–84=100 | 172.2 | 321.9 | +86.9% |
| FHFA purchase-only home-price indexAverage of four quarterly observations; 1991 Q1=100 | 140.44 | 430.42 | +206.5% |
| Rent CPIBLS rent of primary residence; 1982–84=100 | 183.90 | 434.89 | +136.5% |
| 30-year fixed mortgage rateFreddie Mac published annual averages (2000-2024); PennyCalc 2025 mean from Freddie Mac weekly PMMS | 8.05% | 6.60% | -1.45 pp |
| Home price / income pressureRelative index, From year = 100; calculated | 100.0 | 147.1 | +47.1% |
| Rent price / income pressureRelative index, From year = 100; calculated | 100.0 | 113.5 | +13.5% |
| Mortgage-adjusted payment / incomeFixed 30-year amortization, index-based loan; calculated | 100.0 | 127.5 | +27.5% |
National median income doubled, but indexed home prices increased by more than three times from 2000 to 2025.
Chart: 2000 to 2025 value ratios (2000 = 1.00x)
Every bar compares the To-year value with the From-year value, expressed as a multiplier (From year = 1.00x). The mortgage-payment bar uses the two selected annual PMMS-derived rate inputs for a loan scaled by FHFA home-price growth; it does not reflect actual loan balances.
2000 vs 2025: the affordability snapshot
Higher indexed home-price pressure, after accounting for household income growth.
Relative rent-price index pressure, not a dollar rent-to-income burden.
Fixed 30-year repayment proxy, indexed home value and income, principal and interest only.
Income growth after adjusting for broad CPI-U inflation.
Positive home/rent/payment pressure means relatively harder to afford; positive purchasing-power change means higher CPI-adjusted income. No modeled dollar home price or dollar rent is claimed.
How the calculator works
Methodology and data quality
Income and broad inflation
Median household income is U.S. Census Bureau MEHOINUSA646N, nominal current U.S. dollars for each calendar year. FRED’s September 2026 revision gives $83,160 for 2024 (previous vintage: $83,730) and $87,460 for 2025. The Census 2025 report’s 2024 comparator of $85,210 is inflation-adjusted to 2025 dollars and must not be substituted for the nominal series. Headline CPI is the BLS CPI-U all-items national annual average, unadjusted for seasonality (1982–84=100), displayed with one decimal. Neither is a wage rate for an individual worker.
House prices and rent prices
Home prices use the FHFA PONHPIM226N national purchase-only house-price index, not seasonally adjusted (1991 Q1=100); each annual value is the unweighted mean of Q1, Q2, Q3 and Q4 for that year. Rent uses BLS CUUS0000SEHA rent-of-primary-residence CPI, the equal mean of the two half-year averages for 2000–2024. For 2025 it uses the published 434.889 annual mean because missing October collection makes a simple two-half average unreliable.
Mortgage rate and repayment model
The underlying series is Freddie Mac PMMS for U.S. 30-year fixed-rate mortgages (FRED MORTGAGE30US). For 2000–2024, the annual rate inputs are Freddie Mac's published annual averages as reproduced in PennyCalc's historical table (25 official_value source-year observations). For 2025, the 6.60% annual rate is PennyCalc-calculated from official weekly Freddie Mac PMMS observations in calendar year 2025 (one calculated_value observation). Its published method is arithmetic mean = sum of dated weekly PMMS readings / number of dated weekly PMMS readings; PennyCalc rounds the result to two percentage-point decimals. StatRanker did not recompute all weekly observations, and does not label PennyCalc's 2025 calculation as a Freddie Mac official annual publication. Freddie Mac changed its PMMS collection method on November 17, 2022, from a lender survey to mortgage application data; that limits strict comparability. Published annual series and independently recomputed weekly averages can differ slightly because of aggregation rules or rounding; conflicting inputs are not blended.
Source roles and status
Four independent primary numeric publishers: U.S. Census Bureau (nominal income), BLS (headline CPI-U and rent CPI), FHFA (quarterly purchase-only home-price index), Freddie Mac (PMMS). FRED and Minneapolis Fed distribute the original series; PennyCalc reproduces historical Freddie Mac annual averages and publishes its own 2025 aggregation. They are not counted as additional original publishers. Numeric source status (130 source-year observations): 78 official_value = 26 Census income + 26 BLS CPI-U + one BLS 2025 annual rent CPI + 25 published annual Freddie Mac 30-year mortgage averages for 2000–2024; 52 calculated_value = 26 annual FHFA averages (four observed quarters each) + 25 BLS rent means (two observed half-years each) + one PennyCalc 2025 mortgage mean (weekly source). Separately, the 26 ranking indices are all StatRanker calculated_value from FHFA and Census inputs, not new source observations. Source priority is original official series, then institutional distributors and separately identified industry aggregates; no conflicting values are averaged. BLS's 2025 CPI FAQ, Freddie Mac's collection-method note and Census's annual release are validation or methodology sources, not additional annual rows.
Equations
Percent change = (Value[To] / Value[From] - 1) x 100
Home pressure index = 100 x (FHFA_HPI[To] / FHFA_HPI[From]) / (Income[To] / Income[From])
Rent pressure index = 100 x (Rent_CPI[To] / Rent_CPI[From]) / (Income[To] / Income[From])
Monthly factor(r) = (r/1200) / (1 - (1 + r/1200)^(-360)); r = annual rate in percent
Mortgage payment pressure = Home pressure x MonthlyFactor(Rate[To]) / MonthlyFactor(Rate[From])
Income purchasing-power index is 100 times the income ratio divided by the CPI-U ratio. If two positive personal-income entries are supplied, the selected-year calculations use them instead of the Census medians; the national year ranking remains based on Census income. The mortgage scenario assumes the same down-payment percentage and loan term in both years, a loan principal proportional to the FHFA index and no changes in taxes, insurance, HOA fees, loan costs or household composition.
Source-conflict rule: if alternative reports differ on a yearly mortgage-rate average because of differing weekly/monthly weighting, period coverage or rounding (for example, historical 2022–2023 tables), this page keeps its documented 2000–2024 Freddie Mac annual values reproduced by PennyCalc and does not average or substitute unrelated calculations. The 2025 PennyCalc rate is labeled calculated_value. Revised inputs require a documented comparison of definitions before replacement.
October 2025 CPI treatment: BLS could not collect the usual October 2025 consumer-price and rent samples and applied its documented carry-forward imputation. Most October CPI index values remained unpublished; for affected series, BLS calculated 2025 annual averages from 11 published monthly index values. These official published BLS annual values are used as observed source data, without additional October imputation or interpolation by StatRanker.
Scope and exclusions: only 2000–2025 U.S. full-year observations are included. No 2026 values, forecasts, or sampled city prices are used. StatRanker does not add its own October 2025 CPI imputations or interpolations; the published BLS 2025 CPI indices reflect BLS data-handling procedures, including carry-forward imputation of missing October price and rent observations. The data do not measure average asking rent, median transaction price, state-level variation, actual mortgage eligibility, take-home pay or the household budget share spent on housing. Agencies may revise historical series; datasets are tied to the stated source vintages.
2024 incomes use the revised nominal Census series, not the inflation-adjusted 2024 comparator reported in 2025-dollar terms by Census. The annual mortgage series is sourced through PennyCalc: Freddie Mac-published annual averages for 2000–2024 and a PennyCalc weekly-data calculation for 2025. No original weekly-rate dataset is reproduced or recomputed by this calculator.
Published CPI-U annual values are used at one-decimal-place input precision, so no extra precision is inferred. Income is in whole dollars; FHFA quarterly and rent-index means retain the unrounded precision of their specified inputs before final displays. Home/rent indices display two decimals in comparisons; annual mortgage rate inputs display two percentage-point decimals; derived relative pressure displays one decimal. Rank order uses four-decimal raw computed values, not the rounded labels.
View historical values and source notes (26 years)
Main ranking: which U.S. years had the highest home-price pressure?
The 26-year series is ranked by FHFA purchase-only home-price appreciation relative to Census median household income, with 2000 normalized to 100. Use the controls to search by year or sort the existing rows. Ranking is fixed to the full-sample pressure score; personal-income inputs do not rewrite the historical dataset.
Top 10 and Top 20 refer to the original 26-year ranking. Applying a decade filter can result in no matches.
26 years; 26 calculated ranking values; 2000–2025
No matching years. Select Show: All 26, adjust the decade, or clear the year search.
| Rank | Year | Home / income index | Median income | Source / method note |
|---|---|---|---|---|
| 1 | 2022 | 152.3calculated_value; base 2000 | $74,580Census 2022; official_value | FHFA 2022 HPI 379.863 (Q1–Q4 mean); BLS 2022 CPI 292.7 (official_value), rent 370.199 (mean of half-years, calculated_value); Freddie Mac published 2022 annual 30-year PMMS average 5.34% (official_value, reproduced in PennyCalc); original survey: Freddie Mac PMMS. Rank formula: 100 x (HPI / 2000 HPI) / (Census income / 2000 income). |
| 2 | 2024 | 150.3calculated_value; base 2000 | $83,160Census 2024; official_value | FHFA 2024 HPI 418.090 (Q1–Q4 mean); BLS 2024 CPI 313.7 (official_value), rent 420.060 (mean of half-years, calculated_value); Freddie Mac published 2024 annual 30-year PMMS average 6.72% (official_value, reproduced in PennyCalc); original survey: Freddie Mac PMMS. Rank formula: 100 x (HPI / 2000 HPI) / (Census income / 2000 income). |
| 3 | 2023 | 147.3calculated_value; base 2000 | $80,610Census 2023; official_value | FHFA 2023 HPI 397.147 (Q1–Q4 mean); BLS 2023 CPI 304.7 (official_value), rent 399.642 (mean of half-years, calculated_value); Freddie Mac published 2023 annual 30-year PMMS average 6.81% (official_value, reproduced in PennyCalc); original survey: Freddie Mac PMMS. Rank formula: 100 x (HPI / 2000 HPI) / (Census income / 2000 income). |
| 4 | 2025 | 147.1calculated_value; base 2000 | $87,460Census 2025; official_value | FHFA 2025 HPI 430.418 (Q1–Q4 mean); BLS 2025 CPI 321.9 (official_value), rent 434.889 (published annual, official_value); Freddie Mac PMMS weekly observations, 2025; PennyCalc annual mean 6.60% (calculated_value: arithmetic sum of 2025 weekly rates / number of dated weekly readings, rounded to 2 decimals). Rank formula: 100 x (HPI / 2000 HPI) / (Census income / 2000 income). |
| 5 | 2021 | 141.6calculated_value; base 2000 | $70,780Census 2021; official_value | FHFA 2021 HPI 335.283 (Q1–Q4 mean); BLS 2021 CPI 271.0 (official_value), rent 349.135 (mean of half-years, calculated_value); Freddie Mac published 2021 annual 30-year PMMS average 2.96% (official_value, reproduced in PennyCalc); original survey: Freddie Mac PMMS. Rank formula: 100 x (HPI / 2000 HPI) / (Census income / 2000 income). |
| 6 | 2006 | 137.2calculated_value; base 2000 | $48,200Census 2006; official_value | FHFA 2006 HPI 221.125 (Q1–Q4 mean); BLS 2006 CPI 201.6 (official_value), rent 225.100 (mean of half-years, calculated_value); Freddie Mac published 2006 annual 30-year PMMS average 6.41% (official_value, reproduced in PennyCalc); original survey: Freddie Mac PMMS. Rank formula: 100 x (HPI / 2000 HPI) / (Census income / 2000 income). |
| 7 | 2005 | 134.9calculated_value; base 2000 | $46,330Census 2005; official_value | FHFA 2005 HPI 208.972 (Q1–Q4 mean); BLS 2005 CPI 195.3 (official_value), rent 217.350 (mean of half-years, calculated_value); Freddie Mac published 2005 annual 30-year PMMS average 5.87% (official_value, reproduced in PennyCalc); original survey: Freddie Mac PMMS. Rank formula: 100 x (HPI / 2000 HPI) / (Census income / 2000 income). |
| 8 | 2007 | 131.5calculated_value; base 2000 | $50,230Census 2007; official_value | FHFA 2007 HPI 220.882 (Q1–Q4 mean); BLS 2007 CPI 207.3 (official_value), rent 234.679 (mean of half-years, calculated_value); Freddie Mac published 2007 annual 30-year PMMS average 6.34% (official_value, reproduced in PennyCalc); original survey: Freddie Mac PMMS. Rank formula: 100 x (HPI / 2000 HPI) / (Census income / 2000 income). |
| 9 | 2004 | 127.6calculated_value; base 2000 | $44,330Census 2004; official_value | FHFA 2004 HPI 189.173 (Q1–Q4 mean); BLS 2004 CPI 188.9 (official_value), rent 211.050 (mean of half-years, calculated_value); Freddie Mac published 2004 annual 30-year PMMS average 5.84% (official_value, reproduced in PennyCalc); original survey: Freddie Mac PMMS. Rank formula: 100 x (HPI / 2000 HPI) / (Census income / 2000 income). |
| 10 | 2020 | 126.5calculated_value; base 2000 | $68,010Census 2020; official_value | FHFA 2020 HPI 287.743 (Q1–Q4 mean); BLS 2020 CPI 258.8 (official_value), rent 341.468 (mean of half-years, calculated_value); Freddie Mac published 2020 annual 30-year PMMS average 3.11% (official_value, reproduced in PennyCalc); original survey: Freddie Mac PMMS. Rank formula: 100 x (HPI / 2000 HPI) / (Census income / 2000 income). |
| 11 | 2008 | 120.5calculated_value; base 2000 | $50,300Census 2008; official_value | FHFA 2008 HPI 202.798 (Q1–Q4 mean); BLS 2008 CPI 215.3 (official_value), rent 243.271 (mean of half-years, calculated_value); Freddie Mac published 2008 annual 30-year PMMS average 6.03% (official_value, reproduced in PennyCalc); original survey: Freddie Mac PMMS. Rank formula: 100 x (HPI / 2000 HPI) / (Census income / 2000 income). |
| 12 | 2018 | 120.3calculated_value; base 2000 | $63,180Census 2018; official_value | FHFA 2018 HPI 254.243 (Q1–Q4 mean); BLS 2018 CPI 251.1 (official_value), rent 319.289 (mean of half-years, calculated_value); Freddie Mac published 2018 annual 30-year PMMS average 4.54% (official_value, reproduced in PennyCalc); original survey: Freddie Mac PMMS. Rank formula: 100 x (HPI / 2000 HPI) / (Census income / 2000 income). |
| 13 | 2003 | 119.3calculated_value; base 2000 | $43,320Census 2003; official_value | FHFA 2003 HPI 172.893 (Q1–Q4 mean); BLS 2003 CPI 184.0 (official_value), rent 205.550 (mean of half-years, calculated_value); Freddie Mac published 2003 annual 30-year PMMS average 5.83% (official_value, reproduced in PennyCalc); original survey: Freddie Mac PMMS. Rank formula: 100 x (HPI / 2000 HPI) / (Census income / 2000 income). |
| 14 | 2017 | 117.2calculated_value; base 2000 | $61,140Census 2017; official_value | FHFA 2017 HPI 239.735 (Q1–Q4 mean); BLS 2017 CPI 245.1 (official_value), rent 308.142 (mean of half-years, calculated_value); Freddie Mac published 2017 annual 30-year PMMS average 3.99% (official_value, reproduced in PennyCalc); original survey: Freddie Mac PMMS. Rank formula: 100 x (HPI / 2000 HPI) / (Census income / 2000 income). |
| 15 | 2019 | 116.2calculated_value; base 2000 | $68,700Census 2019; official_value | FHFA 2019 HPI 266.942 (Q1–Q4 mean); BLS 2019 CPI 255.7 (official_value), rent 331.124 (mean of half-years, calculated_value); Freddie Mac published 2019 annual 30-year PMMS average 3.94% (official_value, reproduced in PennyCalc); original survey: Freddie Mac PMMS. Rank formula: 100 x (HPI / 2000 HPI) / (Census income / 2000 income). |
| 16 | 2009 | 114.5calculated_value; base 2000 | $49,780Census 2009; official_value | FHFA 2009 HPI 190.618 (Q1–Q4 mean); BLS 2009 CPI 214.5 (official_value), rent 248.811 (mean of half-years, calculated_value); Freddie Mac published 2009 annual 30-year PMMS average 5.04% (official_value, reproduced in PennyCalc); original survey: Freddie Mac PMMS. Rank formula: 100 x (HPI / 2000 HPI) / (Census income / 2000 income). |
| 17 | 2016 | 114.4calculated_value; base 2000 | $59,040Census 2016; official_value | FHFA 2016 HPI 225.930 (Q1–Q4 mean); BLS 2016 CPI 240.0 (official_value), rent 296.820 (mean of half-years, calculated_value); Freddie Mac published 2016 annual 30-year PMMS average 3.65% (official_value, reproduced in PennyCalc); original survey: Freddie Mac PMMS. Rank formula: 100 x (HPI / 2000 HPI) / (Census income / 2000 income). |
| 18 | 2014 | 113.5calculated_value; base 2000 | $53,660Census 2014; official_value | FHFA 2014 HPI 203.615 (Q1–Q4 mean); BLS 2014 CPI 236.7 (official_value), rent 276.162 (mean of half-years, calculated_value); Freddie Mac published 2014 annual 30-year PMMS average 4.17% (official_value, reproduced in PennyCalc); original survey: Freddie Mac PMMS. Rank formula: 100 x (HPI / 2000 HPI) / (Census income / 2000 income). |
| 19 | 2002 | 113.3calculated_value; base 2000 | $42,410Census 2002; official_value | FHFA 2002 HPI 160.637 (Q1–Q4 mean); BLS 2002 CPI 179.9 (official_value), rent 199.700 (mean of half-years, calculated_value); Freddie Mac published 2002 annual 30-year PMMS average 6.54% (official_value, reproduced in PennyCalc); original survey: Freddie Mac PMMS. Rank formula: 100 x (HPI / 2000 HPI) / (Census income / 2000 income). |
| 20 | 2015 | 113.2calculated_value; base 2000 | $56,520Census 2015; official_value | FHFA 2015 HPI 214.055 (Q1–Q4 mean); BLS 2015 CPI 237.0 (official_value), rent 286.032 (mean of half-years, calculated_value); Freddie Mac published 2015 annual 30-year PMMS average 3.85% (official_value, reproduced in PennyCalc); original survey: Freddie Mac PMMS. Rank formula: 100 x (HPI / 2000 HPI) / (Census income / 2000 income). |
| 21 | 2010 | 112.2calculated_value; base 2000 | $49,280Census 2010; official_value | FHFA 2010 HPI 185.005 (Q1–Q4 mean); BLS 2010 CPI 218.1 (official_value), rent 249.386 (mean of half-years, calculated_value); Freddie Mac published 2010 annual 30-year PMMS average 4.69% (official_value, reproduced in PennyCalc); original survey: Freddie Mac PMMS. Rank formula: 100 x (HPI / 2000 HPI) / (Census income / 2000 income). |
| 22 | 2013 | 108.4calculated_value; base 2000 | $53,590Census 2013; official_value | FHFA 2013 HPI 194.273 (Q1–Q4 mean); BLS 2013 CPI 233.0 (official_value), rent 267.724 (mean of half-years, calculated_value); Freddie Mac published 2013 annual 30-year PMMS average 3.98% (official_value, reproduced in PennyCalc); original survey: Freddie Mac PMMS. Rank formula: 100 x (HPI / 2000 HPI) / (Census income / 2000 income). |
| 23 | 2012 | 106.5calculated_value; base 2000 | $51,020Census 2012; official_value | FHFA 2012 HPI 181.760 (Q1–Q4 mean); BLS 2012 CPI 229.6 (official_value), rent 260.367 (mean of half-years, calculated_value); Freddie Mac published 2012 annual 30-year PMMS average 3.66% (official_value, reproduced in PennyCalc); original survey: Freddie Mac PMMS. Rank formula: 100 x (HPI / 2000 HPI) / (Census income / 2000 income). |
| 24 | 2001 | 106.3calculated_value; base 2000 | $42,230Census 2001; official_value | FHFA 2001 HPI 150.115 (Q1–Q4 mean); BLS 2001 CPI 177.1 (official_value), rent 192.100 (mean of half-years, calculated_value); Freddie Mac published 2001 annual 30-year PMMS average 6.97% (official_value, reproduced in PennyCalc); original survey: Freddie Mac PMMS. Rank formula: 100 x (HPI / 2000 HPI) / (Census income / 2000 income). |
| 25 | 2011 | 105.7calculated_value; base 2000 | $50,050Census 2011; official_value | FHFA 2011 HPI 176.988 (Q1–Q4 mean); BLS 2011 CPI 224.9 (official_value), rent 253.638 (mean of half-years, calculated_value); Freddie Mac published 2011 annual 30-year PMMS average 4.45% (official_value, reproduced in PennyCalc); original survey: Freddie Mac PMMS. Rank formula: 100 x (HPI / 2000 HPI) / (Census income / 2000 income). |
| 26 | 2000 | 100.0calculated_value; base 2000 | $41,990Census 2000; official_value | FHFA 2000 HPI 140.438 (Q1–Q4 mean); BLS 2000 CPI 172.2 (official_value), rent 183.900 (mean of half-years, calculated_value); Freddie Mac published 2000 annual 30-year PMMS average 8.05% (official_value, reproduced in PennyCalc); original survey: Freddie Mac PMMS. Rank formula: 100 x (HPI / 2000 HPI) / (Census income / 2000 income). |
All rows are dated 2000–2025; the ranked value is calculated_value. The source-method column identifies source organization, observation year and annual transformation. The source links and methodological caveats appear below. Without JavaScript the complete table remains visible.
Official data sources and verification
Sources
U.S. Census Bureau via FRED
Role: numeric_source. Census annual nominal median household income, series MEHOINUSA646N, 2000–2025. Uses the September 2026 revision ($83,160 for 2024; $87,460 for 2025), not the old 2025 publication vintage. The Census 2025 report also gives a $85,210 inflation-adjusted comparator for 2024 in 2025 dollars; that is a different unit.
https://fred.stlouisfed.org/series/MEHOINUSA646NBLS CPI-U annual values via Minneapolis Fed
Role: numeric_source. Published U.S. headline CPI-U annual average, 2000–2025 (displayed to one decimal). CPI inflation multipliers and real-income comparison.
https://www.minneapolisfed.org/about-us/monetary-policy/inflation-calculator/consumer-price-index-1913-BLS rent CPI via FRED
Role: numeric_source. Rent of primary residence series CUUS0000SEHA (two semiannual averages per year) for 2000–2024; CUUR0000SEHA published annual average for 2025. Values are indices, not rent amounts.
https://fred.stlouisfed.org/data/CUUS0000SEHAFederal Housing Finance Agency via FRED
Role: numeric_source. Purchase-only national home-price index PONHPIM226N, quarterly unadjusted observations, averaged over each year. FHFA HPI methodology is the comparison's housing reference.
https://fred.stlouisfed.org/data/PONHPIM226NFreddie Mac Primary Mortgage Market Survey
Role: numeric_source (original published weekly and 2000–2024 annual figures) / methodology_source. Freddie Mac is the original publisher of PMMS. Annual values for 2000–2024 are presented as Freddie Mac-published averages reproduced by PennyCalc; the 2025 annual mean is instead calculated by PennyCalc from Freddie Mac weekly readings. The PMMS archive documents underlying observations and the November 2022 methodology break.
https://www.freddiemac.com/pmms/pmms_archivesPennyCalc historical annual mortgage rates
Role: validation_source / secondary distribution of official 2000–2024 rates; numeric_source for calculated 2025 annual mean. PennyCalc explicitly distinguishes Freddie Mac-published annual averages through 2024 from its own 2025 weekly-data aggregation. Its 2025 formula is the arithmetic mean of Freddie Mac PMMS weekly observations dated 2025, rounded to two decimals. The 26 inputs in this calculator are taken from this published table; none is claimed to be freshly recomputed by StatRanker. PennyCalc is not a fifth primary publishing organization.
https://pennycalc.com/mortgage-rates/history/Freddie Mac method-change research note
Role: methodology_source. Documents the PMMS change implemented on November 17, 2022. Not used as an annual numeric source.
https://www.freddiemac.com/research/insight/20221103-freddie-macs-newly-enhanced-mortgage-rate-surveyBLS 2025 CPI data-collection FAQ
Role: validation_source / methodology_source. BLS documents carry-forward imputation of uncollected October 2025 consumer-price and rent samples, limited publication of October index levels, and calculation of affected 2025 annual CPI averages from 11 published monthly index values. These procedures are BLS methods, not extra estimates introduced by StatRanker.
https://www.bls.gov/cpi/additional-resources/2025-federal-government-shutdown-impact-cpi-faq.htmCensus Income in the United States: 2025
Role: validation_source / methodology_source. The September 2026 release confirms the 2025 median and uses inflation-adjusted 2025-dollar comparators for earlier years, which must not be mixed with the nominal FRED series.
https://www.census.gov/library/publications/2026/demo/p60-289.htmlRelated rankings
Closely related StatRanker ranking and data pages selected by topic, entity scope and category. Fewer links are shown when strong matches are limited.