

Poverty Rate by State 2026: Latest Census SPM Ranking
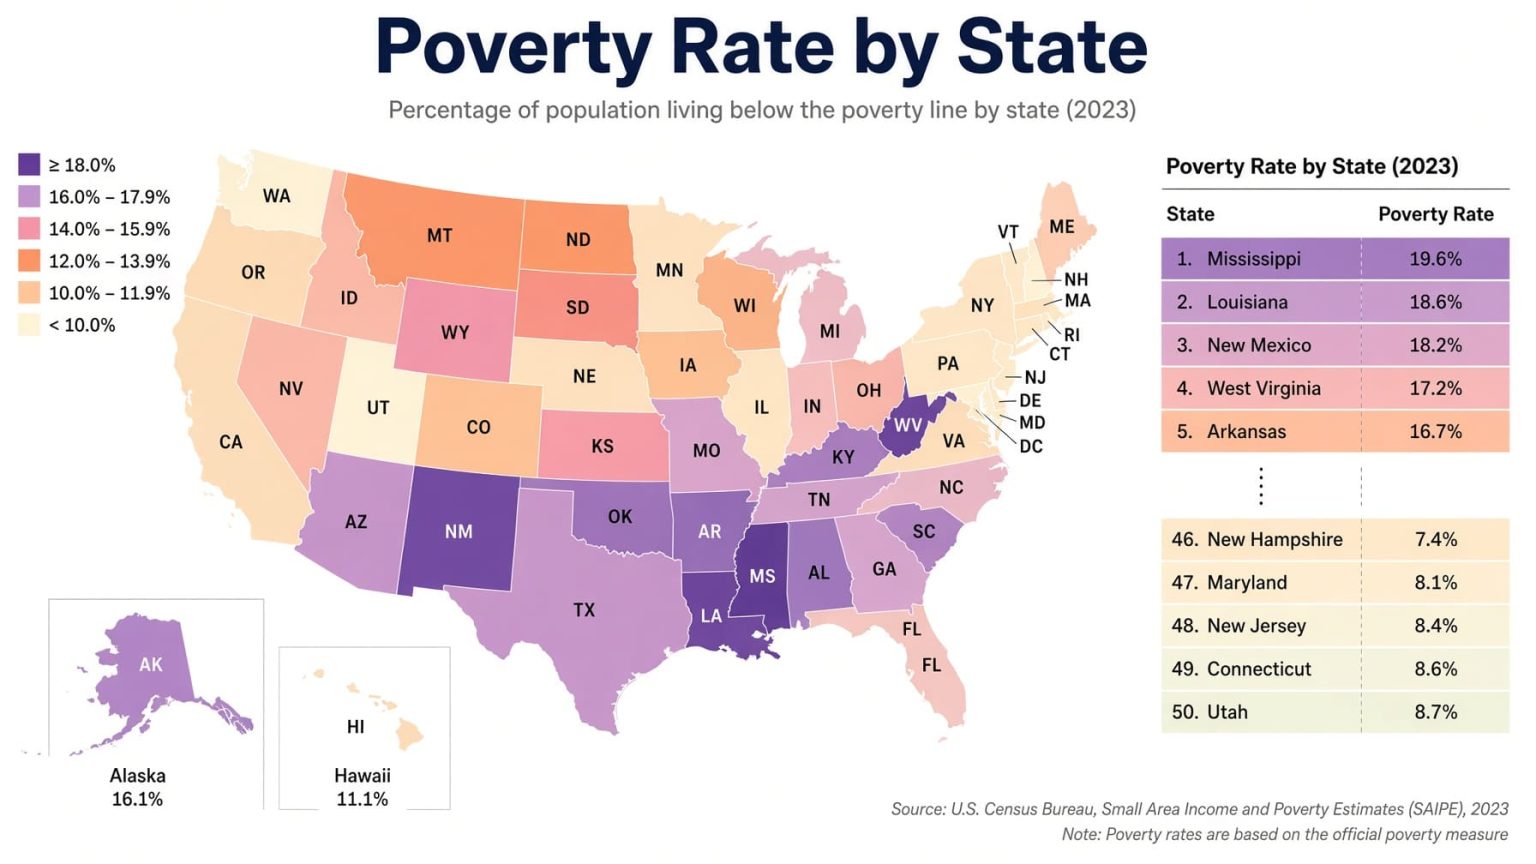
Latest Census Supplemental Poverty Measure Ranking by State
Louisiana has the highest Supplemental Poverty Measure rate among the 50 states in the latest complete Census state SPM dataset, at 19.0%. California follows at 17.8%, Mississippi at 16.8% and Florida at 16.4%. Maine has the lowest published state SPM rate at 6.4%.
This is a 2026 snapshot based on the latest available Census data, not a forecast of poverty in 2026. The values are CPS ASEC three-year averages for 2023–2025. Census recommends three-year averages for state analysis because individual-year CPS samples are smaller.
Metric: Supplemental Poverty Measure rate. Coverage: all 50 states. Unit: percent of people below the SPM threshold. Direction: higher rate ranks higher. Numeric source: U.S. Census Bureau Table 17. Status: 50 official_value rows. Retrieval date: October 7, 2026.
Why SPM is named explicitly: SPM and the Official Poverty Measure are different Census measures. The complete ranking below uses SPM consistently. Confirmed official-plus poverty figures are presented separately and are never mixed into the ranking.
Louisiana, rank #1.
Maine, rank #50.
StatRanker calculation from the 50 Census-published state point estimates.
Census national SPM / official-plus rates for 2023–2025.
2023–2025 · Census Table 17 · 50 official_value rows · one official numeric source.
What the Census state poverty ranking measures
The Supplemental Poverty Measure compares a family's or individual's available resources with an SPM threshold. Resources include cash income and qualifying noncash benefits and tax credits, then subtract taxes and necessary expenses such as medical out-of-pocket, work and child-care costs.
SPM thresholds also account for geographic housing-cost differences and whether a household rents, owns with a mortgage or owns without a mortgage. That is why an SPM state ranking can differ materially from a conventional Official Poverty Measure ranking.
The national three-year SPM rate for 2023–2025 was 13.0%. Thirteen states have published SPM point estimates above 13.0%, but Census statistical testing identifies only eight states as significantly above the national SPM rate.
How the official poverty measure differs
Census also reports an official-plus measure for direct comparison with SPM. Official-plus uses the official poverty methodology but includes unrelated individuals under age 15 so that its population universe aligns with SPM.
For 2023–2025, the national official-plus rate was 10.7%. Census highlights Louisiana at 19.6% and Mississippi at 17.6% among the highest official-plus state rates, while New Hampshire had the lowest at 5.4%.
| Entity | Official+ Rate | Confirmed Census Context |
|---|---|---|
| Louisiana | 19.6% | 2023–2025; Census-published official-plus value; among the highest state rates. |
| Mississippi | 17.6% | 2023–2025; Census-published official-plus value; among the highest state rates. |
| United States | 10.7% | 2023–2025 national official-plus benchmark. |
| New Hampshire | 5.4% | 2023–2025; lowest official-plus state rate highlighted by Census. |
Census identifies 11 states with official-plus poverty rates statistically above the 10.7% national benchmark: Alabama, Arkansas, Georgia, Kentucky, Louisiana, Mississippi, New Mexico, North Carolina, Oklahoma, Texas and West Virginia. Unverified row-level official-plus values are not inferred for the remaining states.
Top 10 states by Supplemental Poverty Measure rate
Louisiana leads the latest complete state SPM ranking at 19.0%. California is second at 17.8%, Mississippi third at 16.8% and Florida fourth at 16.4%. Equal published Census point estimates share a rank.
| Rank | State | SPM Rate | Region / Source & Method Note |
|---|---|---|---|
| 1 | Louisiana | 19.0% | South; official_value; U.S. Census Bureau Table 17; 2023–2025 SPM average. |
| 2 | California | 17.8% | West; official_value; U.S. Census Bureau Table 17; 2023–2025 SPM average. |
| 3 | Mississippi | 16.8% | South; official_value; U.S. Census Bureau Table 17; 2023–2025 SPM average. |
| 4 | Florida | 16.4% | South; official_value; U.S. Census Bureau Table 17; 2023–2025 SPM average. |
| 5 | Nevada | 15.3% | West; official_value; U.S. Census Bureau Table 17; 2023–2025 SPM average. |
| 6 | New York | 15.1% | Northeast; official_value; U.S. Census Bureau Table 17; 2023–2025 SPM average. |
| 7 (tie) | Alabama | 14.4% | South; official_value; U.S. Census Bureau Table 17; 2023–2025 SPM average; tied with Texas. |
| 7 (tie) | Texas | 14.4% | South; official_value; U.S. Census Bureau Table 17; 2023–2025 SPM average; tied with Alabama. |
| 9 | Georgia | 14.0% | South; official_value; U.S. Census Bureau Table 17; 2023–2025 SPM average. |
| 10 | Arizona | 13.7% | West; official_value; U.S. Census Bureau Table 17; 2023–2025 SPM average. |
States through rank 20: 22 states because of a three-way tie
Rank 20 is shared by Oklahoma, South Carolina and Tennessee at 11.1%. The chart therefore includes all 22 states through the rank-20 cutoff instead of arbitrarily excluding states with the same published Census point estimate.
Methodology
Metric and unit
Supplemental Poverty Measure rate, expressed as the percent of people below the applicable SPM threshold. Higher published Census point estimates rank higher.
Snapshot and retrieval
2026 snapshot based on Census data released September 15, 2026. State estimates are three-year averages for 2023–2025. Retrieval date: October 7, 2026.
Coverage
All 50 states. District of Columbia is excluded because the requested scope is states only. Missing or stale rows: none; every ranked state uses the same 2023–2025 period.
Status and provenance
All 50 ranking values are official_value because the Census Bureau directly publishes the SPM estimates in Table 17.
Ranks and ties
Ranks are based on the published Census point estimate. Equal published values receive the same rank. Alphabetical order is used only to display entities within a tie and does not change rank.
Conflict handling
No competing numeric estimates are averaged. Census Table 17 controls the ranking; validation sources are used only to check transcription.
StatRanker-calculated metrics use the 50 confirmed Census state point estimates. Unweighted mean = 565.3 ÷ 50 = 11.306%, displayed as 11.31%. Median = (10.8% + 10.7%) ÷ 2 = 10.75%. High-low gap = 19.0% − 6.4% = 12.6 percentage points. High-low ratio = 19.0 ÷ 6.4 = 2.97.
These calculations are descriptive StatRanker calculations and are not Census-published national estimates. The official national three-year SPM rate is 13.0%, which reflects population weighting and should not be replaced by the unweighted average of state rates.
Census recommends three-year CPS ASEC averages for state analysis because individual-year state samples are smaller. Statistical uncertainty remains: differences between neighboring state point estimates do not necessarily indicate statistically significant differences.
No calculated_value, official_forecast or modeled_projection is used in the ranking. The page does not estimate 2026 state poverty rates and does not combine values from different years, surveys or poverty measures.
SPM does not measure wealth, assets or every form of material hardship. It also must not be interpreted as the same metric as the Official Poverty Measure or the standard ACS poverty rate.
All 50 states ranked by latest Census SPM poverty rate
Every row below uses U.S. Census Bureau Table 17, the 2023–2025 three-year period and official_value status. Equal published values share a rank. Selecting “Top 20 cutoff” can therefore display more than 20 states when several states share rank 20.
| Rank | State | SPM Rate | Region / Source & Method Note |
|---|---|---|---|
| 1 | Louisiana | 19.0% | South; official_value; U.S. Census Bureau Table 17; 2023–2025 SPM average. |
| 2 | California | 17.8% | West; official_value; U.S. Census Bureau Table 17; 2023–2025 SPM average. |
| 3 | Mississippi | 16.8% | South; official_value; U.S. Census Bureau Table 17; 2023–2025 SPM average. |
| 4 | Florida | 16.4% | South; official_value; U.S. Census Bureau Table 17; 2023–2025 SPM average. |
| 5 | Nevada | 15.3% | West; official_value; U.S. Census Bureau Table 17; 2023–2025 SPM average. |
| 6 | New York | 15.1% | Northeast; official_value; U.S. Census Bureau Table 17; 2023–2025 SPM average. |
| 7 (tie) | Alabama | 14.4% | South; official_value; U.S. Census Bureau Table 17; 2023–2025 SPM average; tied with Texas. |
| 7 (tie) | Texas | 14.4% | South; official_value; U.S. Census Bureau Table 17; 2023–2025 SPM average; tied with Alabama. |
| 9 | Georgia | 14.0% | South; official_value; U.S. Census Bureau Table 17; 2023–2025 SPM average. |
| 10 | Arizona | 13.7% | West; official_value; U.S. Census Bureau Table 17; 2023–2025 SPM average. |
| 11 | North Carolina | 13.5% | South; official_value; U.S. Census Bureau Table 17; 2023–2025 SPM average. |
| 12 (tie) | Kentucky | 13.2% | South; official_value; U.S. Census Bureau Table 17; 2023–2025 SPM average; tied with New Mexico. |
| 12 (tie) | New Mexico | 13.2% | West; official_value; U.S. Census Bureau Table 17; 2023–2025 SPM average; tied with Kentucky. |
| 14 | Arkansas | 12.8% | South; official_value; U.S. Census Bureau Table 17; 2023–2025 SPM average. |
| 15 | Massachusetts | 12.5% | Northeast; official_value; U.S. Census Bureau Table 17; 2023–2025 SPM average. |
| 16 (tie) | New Jersey | 12.1% | Northeast; official_value; U.S. Census Bureau Table 17; 2023–2025 SPM average; tied with West Virginia. |
| 16 (tie) | West Virginia | 12.1% | South; official_value; U.S. Census Bureau Table 17; 2023–2025 SPM average; tied with New Jersey. |
| 18 | Hawaii | 11.7% | West; official_value; U.S. Census Bureau Table 17; 2023–2025 SPM average. |
| 19 | Illinois | 11.6% | Midwest; official_value; U.S. Census Bureau Table 17; 2023–2025 SPM average. |
| 20 (tie) | Oklahoma | 11.1% | South; official_value; U.S. Census Bureau Table 17; 2023–2025 SPM average; three-way tie at rank 20. |
| 20 (tie) | South Carolina | 11.1% | South; official_value; U.S. Census Bureau Table 17; 2023–2025 SPM average; three-way tie at rank 20. |
| 20 (tie) | Tennessee | 11.1% | South; official_value; U.S. Census Bureau Table 17; 2023–2025 SPM average; three-way tie at rank 20. |
| 23 | Oregon | 11.0% | West; official_value; U.S. Census Bureau Table 17; 2023–2025 SPM average. |
| 24 | Maryland | 10.9% | South; official_value; U.S. Census Bureau Table 17; 2023–2025 SPM average. |
| 25 | Colorado | 10.8% | West; official_value; U.S. Census Bureau Table 17; 2023–2025 SPM average. |
| 26 | Pennsylvania | 10.7% | Northeast; official_value; U.S. Census Bureau Table 17; 2023–2025 SPM average. |
| 27 (tie) | Michigan | 10.6% | Midwest; official_value; U.S. Census Bureau Table 17; 2023–2025 SPM average; three-way tie. |
| 27 (tie) | Rhode Island | 10.6% | Northeast; official_value; U.S. Census Bureau Table 17; 2023–2025 SPM average; three-way tie. |
| 27 (tie) | Virginia | 10.6% | South; official_value; U.S. Census Bureau Table 17; 2023–2025 SPM average; three-way tie. |
| 30 | Washington | 10.5% | West; official_value; U.S. Census Bureau Table 17; 2023–2025 SPM average. |
| 31 (tie) | Alaska | 10.4% | West; official_value; U.S. Census Bureau Table 17; 2023–2025 SPM average; tied with Connecticut. |
| 31 (tie) | Connecticut | 10.4% | Northeast; official_value; U.S. Census Bureau Table 17; 2023–2025 SPM average; tied with Alaska. |
| 33 | Indiana | 10.3% | Midwest; official_value; U.S. Census Bureau Table 17; 2023–2025 SPM average. |
| 34 (tie) | Ohio | 9.9% | Midwest; official_value; U.S. Census Bureau Table 17; 2023–2025 SPM average; tied with Utah. |
| 34 (tie) | Utah | 9.9% | West; official_value; U.S. Census Bureau Table 17; 2023–2025 SPM average; tied with Ohio. |
| 36 | Montana | 9.5% | West; official_value; U.S. Census Bureau Table 17; 2023–2025 SPM average. |
| 37 (tie) | Idaho | 9.4% | West; official_value; U.S. Census Bureau Table 17; 2023–2025 SPM average; tied with Missouri. |
| 37 (tie) | Missouri | 9.4% | Midwest; official_value; U.S. Census Bureau Table 17; 2023–2025 SPM average; tied with Idaho. |
| 39 (tie) | Delaware | 8.9% | South; official_value; U.S. Census Bureau Table 17; 2023–2025 SPM average; three-way tie. |
| 39 (tie) | North Dakota | 8.9% | Midwest; official_value; U.S. Census Bureau Table 17; 2023–2025 SPM average; three-way tie. |
| 39 (tie) | Vermont | 8.9% | Northeast; official_value; U.S. Census Bureau Table 17; 2023–2025 SPM average; three-way tie. |
| 42 | Wyoming | 8.7% | West; official_value; U.S. Census Bureau Table 17; 2023–2025 SPM average. |
| 43 | Iowa | 8.3% | Midwest; official_value; U.S. Census Bureau Table 17; 2023–2025 SPM average. |
| 44 | Kansas | 8.1% | Midwest; official_value; U.S. Census Bureau Table 17; 2023–2025 SPM average. |
| 45 (tie) | New Hampshire | 8.0% | Northeast; official_value; U.S. Census Bureau Table 17; 2023–2025 SPM average; tied with South Dakota. |
| 45 (tie) | South Dakota | 8.0% | Midwest; official_value; U.S. Census Bureau Table 17; 2023–2025 SPM average; tied with New Hampshire. |
| 47 (tie) | Minnesota | 7.9% | Midwest; official_value; U.S. Census Bureau Table 17; 2023–2025 SPM average; tied with Wisconsin. |
| 47 (tie) | Wisconsin | 7.9% | Midwest; official_value; U.S. Census Bureau Table 17; 2023–2025 SPM average; tied with Minnesota. |
| 49 | Nebraska | 7.5% | Midwest; official_value; U.S. Census Bureau Table 17; 2023–2025 SPM average. |
| 50 | Maine | 6.4% | Northeast; official_value; U.S. Census Bureau Table 17; 2023–2025 SPM average. |
Key findings from the latest state poverty data
Key Insight
Louisiana's 19.0% SPM rate is 12.6 percentage points above Maine's 6.4%. The highest published state rate is about 2.97 times the lowest.
Notable Pattern
Thirteen states have SPM point estimates above the 13.0% national rate, but Census identifies only eight states as statistically significantly above the national benchmark.
Regional / Source Concentration
Six of the 10 displayed Top-10 states are in the Census South, equal to 60%. The West contributes three, the Northeast one and the Midwest none.
Outlier
California ranks #2 by SPM at 17.8%, while Census reports that its official-plus rate was not statistically above the 10.7% national official-plus benchmark. The contrast shows how strongly poverty-measure choice can affect state comparisons.
What the ranking means
This ranking answers a specific question: which states have the highest and lowest poverty rates when poverty is measured with the Census Supplemental Poverty Measure. It should not be interpreted as a ranking of ACS poverty rates or as a synthetic estimate of poverty in calendar year 2026.
Census found SPM significantly higher than official-plus poverty in 26 states and the District of Columbia, significantly lower in five states and not statistically different in the remaining 19 states. That difference is why the measures are kept separate here.
Ranking positions are based on Census-published point estimates. States separated by small differences may not be statistically distinguishable, and equal published values receive the same rank.
Download the Poverty Rate by State 2026: Latest Census SPM Ranking dataset
Poverty Rate by State 2026: Latest Census SPM Ranking
50 ranked entries · Excel + CSV + methodology + sources + chart · Snapshot: 2026 snapshot using official U.S. Census Bureau 2023-2025 SPM three-year state averages · Version 1.0
The archive includes machine-readable data, methodology and source documentation. Quick human verification is required before the ZIP is delivered. Full Data Pack downloads require a free account. Free accounts can download 1 different Data Pack every 30 days; re-downloading the same pack does not use another slot. Annual Data Access provides unlimited manual downloads while annual access is active.
Download Excel + CSV Data PackFAQ
Which state has the highest Census SPM poverty rate?
Louisiana ranks first at 19.0% in the Census 2023–2025 three-year Supplemental Poverty Measure estimates.
Which state has the lowest SPM poverty rate?
Maine has the lowest published state SPM rate at 6.4%.
Are these actual 2026 poverty rates?
No. This is a 2026 snapshot of data released September 15, 2026. The state estimates are three-year averages for 2023–2025.
Why are three-year averages used?
Census recommends three-year CPS ASEC averages for state-level analysis to improve statistical reliability because individual-year state samples are smaller.
Is SPM the same as the Official Poverty Measure?
No. SPM includes taxes, tax credits, noncash benefits and necessary expenses and adjusts thresholds for geographic housing costs. The Official Poverty Measure is based on pre-tax money income and nationally defined thresholds.
What is official-plus poverty?
Official-plus uses the official poverty methodology but includes unrelated individuals under age 15 so Census can directly compare its population universe with SPM.
Why do several states share a rank?
Equal Census-published point estimates receive the same rank. For example, Alabama and Texas both have 14.4% and share rank 7.
Why does the rank-20 chart show 22 states?
Oklahoma, South Carolina and Tennessee all have 11.1% and share rank 20. The cutoff preserves the full tie instead of arbitrarily removing states with the same published value.
Why might another website show a different poverty rate?
Other pages may use ACS poverty rates, CPS official poverty, official-plus or SPM. These are different datasets or poverty measures and should not be mixed.
Sources
U.S. Census Bureau — Table 17
Primary numeric source for all 50 state SPM values and the common 2023–2025 reference period.
https://www2.census.gov/programs-surveys/demo/tables/p60/290/table_17_spm_opm_state.xlsx
U.S. Census Bureau — Poverty in the United States: 2025
Official September 2026 release page for the poverty report and accompanying tables.
https://www.census.gov/data/tables/2026/demo/income-poverty/p60-290.html
U.S. Census Bureau — States With Highest Poverty Rates Clustered in the South
Used for official-plus context, national benchmarks, statistical comparisons and Census guidance on three-year state averages.
https://www.census.gov/library/stories/2026/09/comparing-opm-spm.html
PolicyEngine — 2025 Supplemental Poverty Measure
Independent transcription validation of Census Table 17 state SPM values. Census remains the controlling numeric source.
https://www.policyengine.org/us/research/2025-supplemental-poverty-measure
U.S. Census Bureau — 2026 CPS ASEC Technical Documentation
Methodology, weighting, sampling and nonsampling error documentation.
https://www2.census.gov/programs-surveys/cps/techdocs/cpsmar26.pdf
Related rankings
Closely related StatRanker ranking and data pages selected by topic, entity scope and category. Fewer links are shown when strong matches are limited.
