

U.S. States by Alcohol-Impaired Driving Fatality Rate — 2026 Snapshot
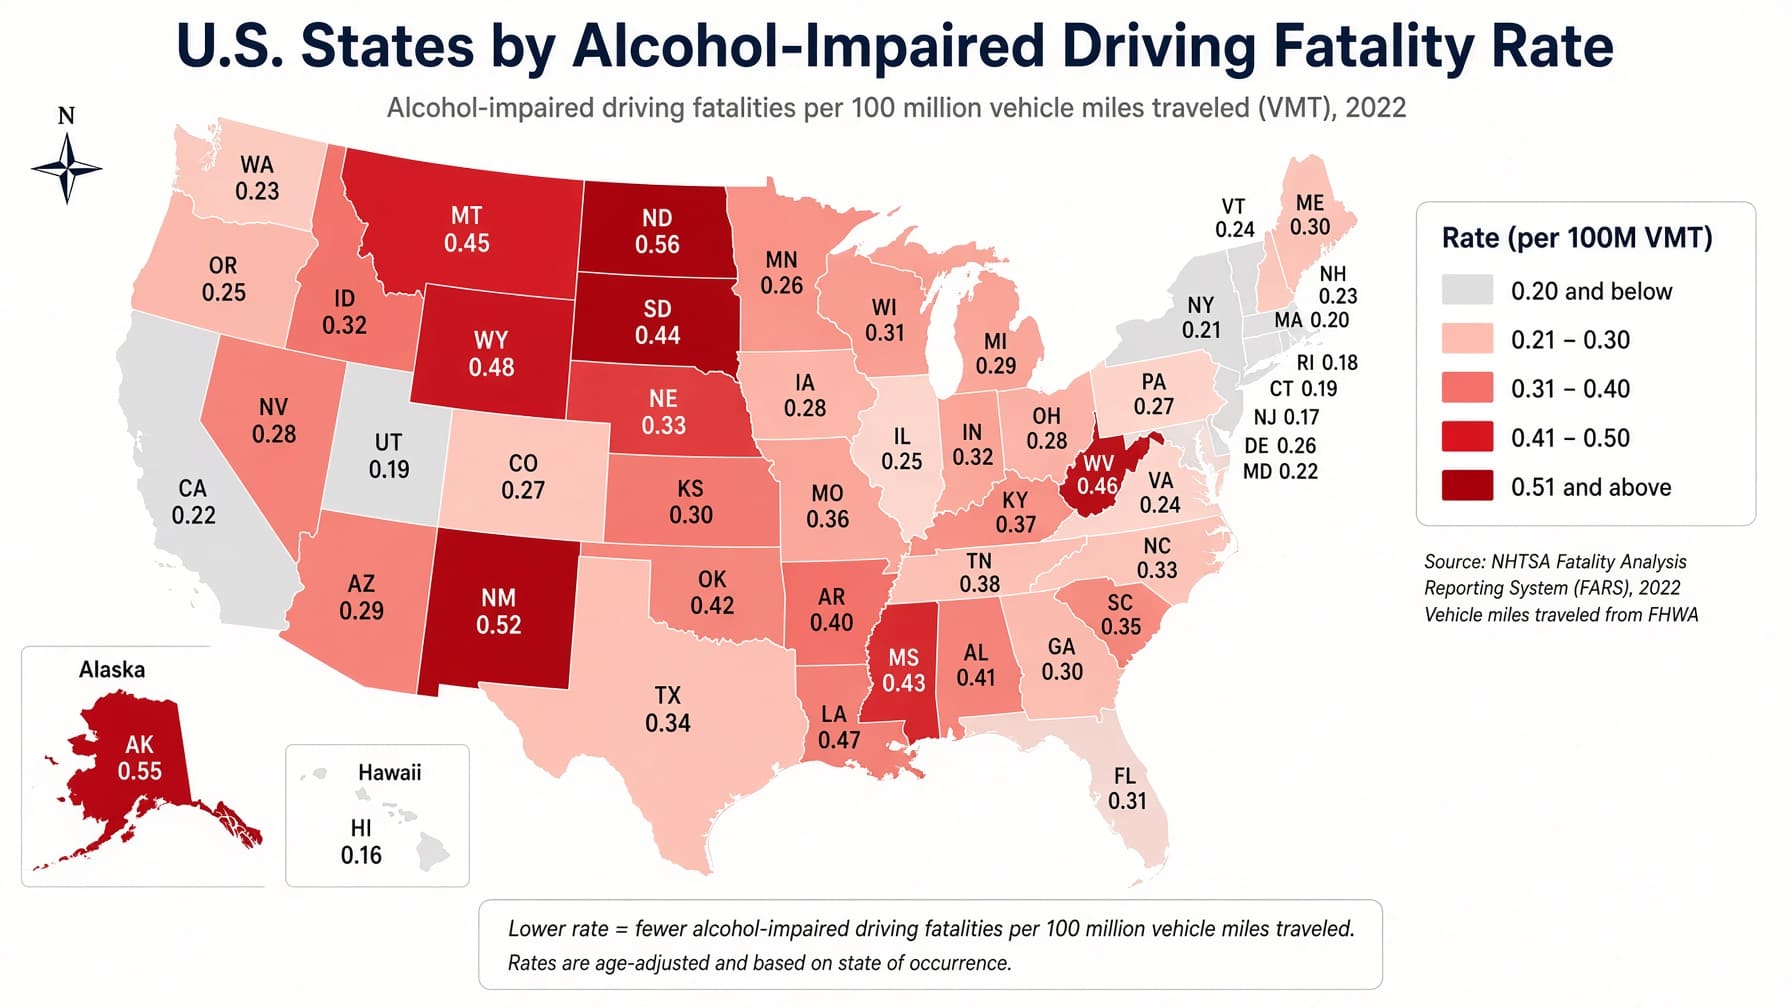
U.S. States by Alcohol-Impaired Driving Fatality Rate
South Carolina had the highest alcohol-impaired-driving fatality rate among the 50 states in NHTSA's 2024 data, at 0.67 fatalities per 100 million vehicle miles traveled. Massachusetts had the lowest rate at 0.16, while the national rate was 0.36.
This 2026 snapshot uses NHTSA's July 2026 State Alcohol-Impaired-Driving Estimates: 2024 Data. The metric counts fatalities in crashes involving at least one driver or motorcycle operator with a blood alcohol concentration of .08 g/dL or higher and relates them to the amount of vehicle travel in each state.
Source type: U.S. federal road-safety statistics. Coverage: 50 states. Unit: fatalities per 100 million vehicle miles traveled. Direction: higher rate ranks higher. All 50 state rates are published by NHTSA; none are projections or independently modeled state estimates.
Continue exploring
More StatRanker pages connected by topic, category or ranking theme.
U.S. States by Large-Truck Crash Fatality Rate: 2026 Snapshot
Open rankingU.S. States by Motorcycle Fatality Rate, 2026 Snapshot
Open rankingTop 10 Airports by Cargo Volume, 2026
Open rankingSouth Carolina, per 100 million VMT.
Massachusetts, per 100 million VMT.
NHTSA's published national rate for 2024.
Median of the 50 state rates shown in this table.
The District of Columbia and Puerto Rico are not included in the state ranking.
NHTSA Traffic Safety Facts, DOT HS 813 813, published July 2026.
What the alcohol-impaired driving fatality rate measures
The rate compares alcohol-impaired-driving fatalities with total vehicle travel. Using vehicle miles traveled rather than population helps account for differences in how much driving occurs in each state.
NHTSA reported 11,904 alcohol-impaired-driving fatalities nationwide in 2024, equal to 30% of all U.S. traffic fatalities. The classification means that a crash involved at least one driver with a BAC of .08 g/dL or higher; it does not by itself establish that alcohol caused the crash.
Not every driver involved in a fatal crash has a known BAC test result. Where BAC is missing, NHTSA uses an established multiple-imputation method rather than treating the BAC as zero or simply excluding the driver. Testing completeness also differs among states, which matters when rates are separated by only a few hundredths of a point.
This ranking does not measure DUI arrests, alcohol consumption, insurance premiums, civil liability or personal-injury claim frequency. Utah also requires special care in interpretation: its per se BAC limit for most drivers is .05 g/dL, while NHTSA uses .08 g/dL as the uniform statistical threshold for this national measure.
Top 10 states by alcohol-impaired driving fatality rate
South Carolina leads at 0.67 fatalities per 100 million VMT, followed by Arizona at 0.59. Montana and Texas are tied at 0.54. When states have the same NHTSA-published rate, alphabetical order is used only to keep the display consistent; it does not indicate a measurable difference between the tied states.
Top 10 of 50 states, NHTSA 2024
| Rank | State | Rate | Region / note |
|---|---|---|---|
| 1 | South Carolina | 0.67 | Region 4 · NHTSA 2024 · published VMT-based estimate. |
| 2 | Arizona | 0.59 | Region 9 · NHTSA 2024 · published VMT-based estimate. |
| 3 | Montana | 0.54 | Region 8 · NHTSA 2024 · published VMT-based estimate. |
| 4 | Texas | 0.54 | Region 6 · NHTSA 2024 · published VMT-based estimate. |
| 5 | Nevada | 0.49 | Region 9 · NHTSA 2024 · published VMT-based estimate. |
| 6 | Oklahoma | 0.48 | Region 6 · NHTSA 2024 · published VMT-based estimate. |
| 7 | Oregon | 0.48 | Region 10 · NHTSA 2024 · published VMT-based estimate. |
| 8 | West Virginia | 0.45 | Region 3 · NHTSA 2024 · published VMT-based estimate. |
| 9 | Tennessee | 0.42 | Region 4 · NHTSA 2024 · published VMT-based estimate. |
| 10 | Mississippi | 0.41 | Region 6 · NHTSA 2024 · published VMT-based estimate. |
Unit: fatalities per 100 million vehicle miles traveled. NHTSA publishes the state rates to two decimal places.
Top 20 state fatality rates
The chart uses the same NHTSA-published rates shown in the ranking table. South Carolina's 0.67 rate provides the scale for the bars.
The national rate was 0.36 per 100 million VMT. Idaho matched that national figure, while each state above it in the table had a higher published rate.
Methodology
Metric and unit
The metric is alcohol-impaired-driving fatalities per 100 million vehicle miles traveled. NHTSA defines an alcohol-impaired driver as a driver or motorcycle operator with a BAC of .08 g/dL or higher.
Data year
The state estimates cover 2024. NHTSA published the state fact sheet in July 2026, so this page is labeled as a 2026 snapshot based on 2024 data rather than as a 2026 fatality forecast.
How the figures are reported
All 50 state rates appear directly in NHTSA DOT HS 813 813. StatRanker does not reconstruct, forecast or substitute the state rates.
Data sources
NHTSA identifies the FARS 2024 Annual Report File as the fatality source and Federal Highway Administration vehicle miles traveled as the denominator source.
Source hierarchy: NHTSA DOT HS 813 813 controls every state value and rank on this page. FARS 2024 ARF and FHWA VMT are the underlying datasets identified by NHTSA. Supporting NHTSA and FHWA pages listed below are used for definitions, methodological context and source documentation; they do not replace the published state rates.
Coverage and missing values: all 50 states have a published rate in the NHTSA source, so no missing state values were filled, estimated by StatRanker or borrowed from another dataset. The District of Columbia and Puerto Rico are outside this 50-state ranking.
Conflicts and assumptions: no conflicting secondary-source rates were averaged or substituted. Rates are reproduced as NHTSA publishes them to two decimal places. States with the same published rate are ordered alphabetically only to create a stable display sequence.
BAC methodology: some drivers do not have a known alcohol-test result. In those cases, NHTSA uses multiple imputation to estimate BAC rather than automatically classifying the driver as sober or excluding the record. The model uses crash, driver and vehicle characteristics. Because the share of known BAC results differs among states, very small differences in published rates deserve cautious interpretation.
Ranking direction is descending: a higher fatality rate ranks higher. The metric does not measure DUI arrests, alcohol consumption, insurance premiums, legal liability, personal-injury claims or the probability that a particular motorist will crash.
All 50 U.S. states ranked
Search for a state, filter by NHTSA region, or change the sort order. The default ranking runs from the highest alcohol-impaired-driving fatality rate to the lowest.
Alcohol-impaired-driving fatalities per 100 million VMT, 2024
| Rank | State | Rate | Region / note |
|---|---|---|---|
| 1 | South Carolina | 0.67 | Region 4 · NHTSA 2024 · published VMT-based estimate. |
| 2 | Arizona | 0.59 | Region 9 · NHTSA 2024 · published VMT-based estimate. |
| 3 | Montana | 0.54 | Region 8 · NHTSA 2024 · published VMT-based estimate. |
| 4 | Texas | 0.54 | Region 6 · NHTSA 2024 · published VMT-based estimate. |
| 5 | Nevada | 0.49 | Region 9 · NHTSA 2024 · published VMT-based estimate. |
| 6 | Oklahoma | 0.48 | Region 6 · NHTSA 2024 · published VMT-based estimate. |
| 7 | Oregon | 0.48 | Region 10 · NHTSA 2024 · published VMT-based estimate. |
| 8 | West Virginia | 0.45 | Region 3 · NHTSA 2024 · published VMT-based estimate. |
| 9 | Tennessee | 0.42 | Region 4 · NHTSA 2024 · published VMT-based estimate. |
| 10 | Mississippi | 0.41 | Region 6 · NHTSA 2024 · published VMT-based estimate. |
| 11 | South Dakota | 0.41 | Region 8 · NHTSA 2024 · published VMT-based estimate. |
| 12 | California | 0.40 | Region 9 · NHTSA 2024 · published VMT-based estimate. |
| 13 | New Mexico | 0.40 | Region 6 · NHTSA 2024 · published VMT-based estimate. |
| 14 | Arkansas | 0.39 | Region 7 · NHTSA 2024 · published VMT-based estimate. |
| 15 | Washington | 0.39 | Region 10 · NHTSA 2024 · published VMT-based estimate. |
| 16 | Alabama | 0.38 | Region 4 · NHTSA 2024 · published VMT-based estimate. |
| 17 | Colorado | 0.37 | Region 8 · NHTSA 2024 · published VMT-based estimate. |
| 18 | Kansas | 0.37 | Region 7 · NHTSA 2024 · published VMT-based estimate. |
| 19 | Ohio | 0.37 | Region 5 · NHTSA 2024 · published VMT-based estimate. |
| 20 | Idaho | 0.36 | Region 10 · NHTSA 2024 · published VMT-based estimate. |
| 21 | Iowa | 0.35 | Region 7 · NHTSA 2024 · published VMT-based estimate. |
| 22 | Louisiana | 0.35 | Region 6 · NHTSA 2024 · published VMT-based estimate. |
| 23 | Wyoming | 0.35 | Region 8 · NHTSA 2024 · published VMT-based estimate. |
| 24 | Connecticut | 0.34 | Region 1 · NHTSA 2024 · published VMT-based estimate. |
| 25 | Kentucky | 0.34 | Region 3 · NHTSA 2024 · published VMT-based estimate. |
| 26 | Nebraska | 0.34 | Region 7 · NHTSA 2024 · published VMT-based estimate. |
| 27 | North Carolina | 0.34 | Region 3 · NHTSA 2024 · published VMT-based estimate. |
| 28 | Vermont | 0.33 | Region 1 · NHTSA 2024 · published VMT-based estimate. |
| 29 | Delaware | 0.32 | Region 3 · NHTSA 2024 · published VMT-based estimate. |
| 30 | Hawaii | 0.32 | Region 9 · NHTSA 2024 · published VMT-based estimate. |
| 31 | Illinois | 0.32 | Region 5 · NHTSA 2024 · published VMT-based estimate. |
| 32 | Maine | 0.32 | Region 1 · NHTSA 2024 · published VMT-based estimate. |
| 33 | Missouri | 0.32 | Region 7 · NHTSA 2024 · published VMT-based estimate. |
| 34 | Florida | 0.31 | Region 4 · NHTSA 2024 · published VMT-based estimate. |
| 35 | Michigan | 0.31 | Region 5 · NHTSA 2024 · published VMT-based estimate. |
| 36 | Pennsylvania | 0.30 | Region 2 · NHTSA 2024 · published VMT-based estimate. |
| 37 | Maryland | 0.29 | Region 3 · NHTSA 2024 · published VMT-based estimate. |
| 38 | New Hampshire | 0.28 | Region 1 · NHTSA 2024 · published VMT-based estimate. |
| 39 | Virginia | 0.28 | Region 3 · NHTSA 2024 · published VMT-based estimate. |
| 40 | Wisconsin | 0.28 | Region 5 · NHTSA 2024 · published VMT-based estimate. |
| 41 | Georgia | 0.27 | Region 4 · NHTSA 2024 · published VMT-based estimate. |
| 42 | North Dakota | 0.27 | Region 8 · NHTSA 2024 · published VMT-based estimate. |
| 43 | New York | 0.25 | Region 2 · NHTSA 2024 · published VMT-based estimate. |
| 44 | Rhode Island | 0.25 | Region 1 · NHTSA 2024 · published VMT-based estimate. |
| 45 | Alaska | 0.24 | Region 10 · NHTSA 2024 · published VMT-based estimate. |
| 46 | Indiana | 0.24 | Region 5 · NHTSA 2024 · published VMT-based estimate. |
| 47 | Utah | 0.20 | Region 8 · NHTSA 2024 · published VMT-based estimate. |
| 48 | New Jersey | 0.19 | Region 2 · NHTSA 2024 · published VMT-based estimate. |
| 49 | Minnesota | 0.18 | Region 5 · NHTSA 2024 · published VMT-based estimate. |
| 50 | Massachusetts | 0.16 | Region 1 · NHTSA 2024 · published VMT-based estimate. |
All rates are published by NHTSA. Fatality estimates use FARS 2024 ARF data, including statistically imputed BAC values when test results are unavailable; the VMT denominator comes from FHWA.
What stands out in the ranking
Highest rate
South Carolina's rate of 0.67 is 0.08 above Arizona and about 86% above the national rate of 0.36.
Geographic spread
The four highest states are spread across four NHTSA regions: South Carolina, Arizona, Montana and Texas. The highest rates are therefore not confined to one part of the country.
Top-10 concentration
Region 6 accounts for Texas, Oklahoma and Mississippi in the Top 10, while Region 4 contributes South Carolina and Tennessee.
Lowest rate
Massachusetts is lowest at 0.16. The gap between South Carolina and Massachusetts is 0.51 fatalities per 100 million VMT.
How to read the ranking
A higher rate means a state recorded more fatalities in crashes involving an alcohol-impaired driver relative to the amount of driving in that state. Because the denominator is VMT, the measure is designed around road exposure rather than population size.
The table does not identify the cause of differences between states. Road design, travel patterns, driver demographics, vehicle mix, enforcement, alcohol use and BAC-testing practices may all vary, but this ranking alone cannot isolate their effects.
Small numerical gaps deserve particular caution. For states separated by 0.01 or 0.02, differences in BAC testing and statistical imputation can make the apparent rank gap less informative than the ordered list suggests.
The rates also should not be used as substitutes for DUI-law comparisons, insurance pricing, civil-liability analysis or personal-injury claim statistics. Those questions require different datasets and state-specific legal or insurance information.
FAQ
Which state has the highest alcohol-impaired-driving fatality rate?
South Carolina ranks first in NHTSA's 2024 state data at 0.67 fatalities per 100 million vehicle miles traveled.
Which state has the lowest rate?
Massachusetts has the lowest state rate at 0.16 fatalities per 100 million VMT.
Are these 2026 fatality rates?
No. The figures cover 2024. They appear here as a 2026 snapshot because NHTSA published the state estimates in July 2026.
What does alcohol-impaired mean in the NHTSA data?
For this measure, NHTSA classifies a driver or motorcycle operator as alcohol-impaired when BAC is .08 g/dL or higher.
Why is vehicle travel used instead of population?
Vehicle miles traveled provide a measure of driving exposure. A population-based rate answers a different question and should not be compared directly with this VMT-based ranking.
Does NHTSA have a BAC test result for every driver?
No. When a BAC result is unavailable, NHTSA uses a multiple-imputation method to estimate BAC from other characteristics in the crash record.
Why is Utah evaluated at .08 when its legal limit is .05?
NHTSA uses .08 g/dL as the uniform statistical threshold for this national alcohol-impaired-driving measure, even though Utah's per se legal threshold for most drivers is .05 g/dL.
Is the national rate the average of all state rates?
No. The national 0.36 rate is calculated from national fatalities and national vehicle miles traveled. It is not the simple arithmetic mean of the 50 state rates.
Sources
NHTSA — State Alcohol-Impaired-Driving Estimates: 2024 Data
Controlling source for the 50 state rates, national rate, BAC definition, methodology and testing limitations. DOT HS 813 813, July 2026.
https://crashstats.nhtsa.dot.gov/Api/Public/ViewPublication/813813
ROSA P — U.S. Department of Transportation repository
Official U.S. DOT repository record for the same NHTSA Traffic Safety Facts publication.
NHTSA — Fatality Analysis Reporting System
Methodological context for FARS, the nationwide census of fatal motor-vehicle traffic crashes used in NHTSA fatality reporting.
https://www.nhtsa.gov/research-data/fatality-analysis-reporting-system-fars
Federal Highway Administration — Highway Statistics 2024, Table VM-2
Official state vehicle-miles-traveled reference. FHWA VMT provides the travel-exposure denominator identified by NHTSA.
https://www.fhwa.dot.gov/policyinformation/statistics/2024/vm2.cfm
Related rankings
More StatRanker pages connected by topic, category or ranking theme.
Top 50 Airports by International Passenger Traffic, 2026
Open rankingTop 50 Airports by Passenger Traffic, 2026
Open rankingUS States by EV Chargers per 100,000 People
Open rankingLargest Car Manufacturers by Vehicle Sales: 2026 Snapshot
Open ranking
StatRanker (Website)
administrator
