

U.S. States by Large-Truck Crash Fatality Rate: 2026 Snapshot
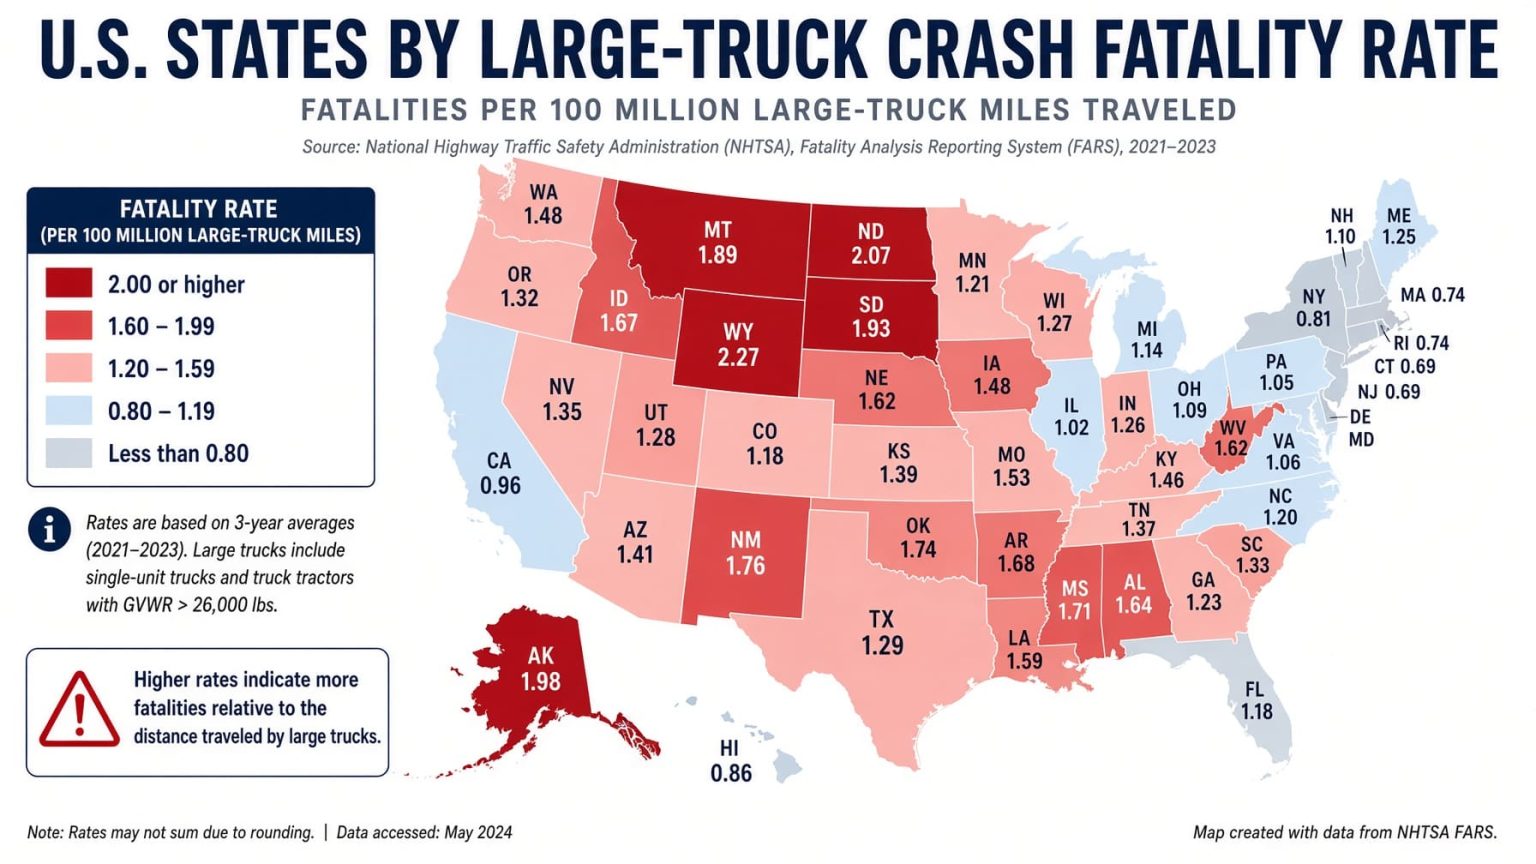
U.S. States by Large-Truck Crash Fatality Rate: 2026 Snapshot Based on 2024 Data
New Mexico ranks first at 3.95 fatalities per 100,000 residents, followed by Wyoming at 3.75 and Mississippi at 3.49.
This ranking combines two official federal data sources. NHTSA provides the number of people killed in crashes involving large trucks, while the U.S. Census Bureau provides state population estimates. The same calculation is then applied to every state.
This is a compiled research dataset based on 2 sources, with the underlying fatality and population figures shown for every state. All 50 rows are calculated rates; 0 are directly published state rates, 0 are forecasts, and 0 are modeled projections.
The ranking covers all 50 U.S. states and compares fatalities in crashes involving large trucks per 100,000 residents. Higher rates rank higher. This is a 2026 snapshot based on 2024 crash and population data.
New Mexico: 84 fatalities and a revised 2024 population of 2,126,774.
Hawaii: 2 fatalities and a revised 2024 population of 1,434,952.
Half of the states rank above this rate and half rank below it.
NHTSA recorded 5,339 fatalities across the 50 states included in this ranking.
NHTSA 2024 crash data and revised Census 2024 population estimates, presented in this 2026 ranking.
About the 2024 data: NHTSA currently identifies the 2024 FARS data used here as its Annual Report File. These figures may be revised when the agency releases the corresponding Final File, so individual state totals and rates could change slightly later.
Overview: what the rate measures
This ranking compares the number of people killed in traffic crashes involving at least one large truck with each state's population. Rates are shown per 100,000 residents so states of very different sizes can be compared on a consistent basis.
NHTSA reports 5,340 fatalities nationwide in 2024, including one fatality in the District of Columbia. This ranking covers only the 50 states, whose totals add up to 5,339 fatalities.
For this NHTSA dataset, a large truck is a medium or heavy truck with a gross vehicle weight rating above 10,000 pounds, excluding buses and motor homes. Both commercial and non-commercial vehicles can be included.
NHTSA assigns each fatal crash to the state where it occurred. The population figure, however, represents people who live in that state. The rate therefore describes where fatal truck crashes occurred relative to population size; it is not a measure of the personal risk faced by state residents.
Population is also not a direct measure of large-truck traffic exposure. This ranking does not adjust for truck mileage, freight flows, road mileage, registered trucks, or interstate through-traffic.
Top 10 states by large-truck crash fatality rate
Seven states have rates above 3 fatalities per 100,000 residents. The Top 10 includes four Southern states, three Western states, and three Midwestern states; no Northeastern state appears in the Top 10.
Fatalities in crashes involving large trucks per 100,000 residents, 2024
| Rank | State | Rate / 100k | How the rate was calculated |
|---|---|---|---|
| 1 | New Mexico | 3.95 | West. Calculated from 84 fatalities reported by NHTSA for 2024 and a Census 2024 population estimate of 2,126,774. |
| 2 | Wyoming | 3.75 | West. Calculated from 22 fatalities reported by NHTSA for 2024 and a Census 2024 population estimate of 586,722. |
| 3 | Mississippi | 3.49 | South. Calculated from 103 fatalities reported by NHTSA for 2024 and a Census 2024 population estimate of 2,950,172. |
| 4 | South Dakota | 3.45 | Midwest. Calculated from 32 fatalities reported by NHTSA for 2024 and a Census 2024 population estimate of 927,110. |
| 5 | Arkansas | 3.33 | South. Calculated from 103 fatalities reported by NHTSA for 2024 and a Census 2024 population estimate of 3,096,080. |
| 6 | Nebraska | 3.04 | Midwest. Calculated from 61 fatalities reported by NHTSA for 2024 and a Census 2024 population estimate of 2,005,591. |
| 7 | North Dakota | 3.03 | Midwest. Calculated from 24 fatalities reported by NHTSA for 2024 and a Census 2024 population estimate of 793,387. |
| 8 | Oklahoma | 2.78 | South. Calculated from 114 fatalities reported by NHTSA for 2024 and a Census 2024 population estimate of 4,097,758. |
| 9 | Montana | 2.73 | West. Calculated from 31 fatalities reported by NHTSA for 2024 and a Census 2024 population estimate of 1,137,557. |
| 10 | Alabama | 2.61 | South. Calculated from 135 fatalities reported by NHTSA for 2024 and a Census 2024 population estimate of 5,163,055. |
States are ranked using the full calculated rate. Values shown in the table are rounded to two decimal places.
Chart: Top 20 states by large-truck crash fatality rate
The chart uses the same state rates as the ranking table. New Mexico has the highest rate and therefore sets the full chart scale.
Methodology
This compiled research dataset combines NHTSA fatal-crash data with U.S. Census Bureau population estimates. The same calculation is applied to every state so the results can be compared consistently.
How states are ranked
States are ranked by fatalities in crashes involving large trucks per 100,000 residents. A higher rate receives a higher position.
Data year
Both the fatality counts and population figures refer to 2024. The page is presented as a 2026 snapshot using those observed 2024 figures.
Coverage
All 50 U.S. states are included. The District of Columbia and Puerto Rico are excluded because this ranking is limited to states.
Data sources
NHTSA supplies the state fatality counts. The U.S. Census Bureau supplies the population estimates. No commercial source determines the ranking.
Calculation: the number of people killed in large-truck crashes is divided by the state's 2024 population and multiplied by 100,000.
How the rates were produced: NHTSA does not publish this exact population-based state ranking. StatRanker calculates each rate from NHTSA's published fatality count and the Census Bureau's published population estimate using the same formula for every state.
About the 2024 FARS data: NHTSA currently identifies the 2024 figures as its Annual Report File. The agency can revise an Annual Report File when the corresponding Final File is released, so this ranking may need a future data update.
What counts as a large truck: in the NHTSA source used here, the category covers medium and heavy trucks with a gross vehicle weight rating above 10,000 pounds, excluding buses and motor homes. Both commercial and non-commercial vehicles can qualify.
Comparability over time: NHTSA changed its vehicle-classification approach beginning with 2020 data. For that reason, this page does not combine the current definition with older pre-2020 figures to create a long-term trend.
Why Census Vintage 2025 is used: Vintage 2025 contains the Census Bureau's revised estimate of each state's July 1, 2024 population. Using the newer estimate series keeps the population figures current without mixing different data years.
Data completeness: all 50 states have both a 2024 NHTSA fatality count and a 2024 Census population estimate. No missing values were estimated and no conflicting figures were averaged.
Rounding: states are ranked using the full calculated rate, while the table displays two decimal places. This matters for very close results such as Idaho and Texas, which both display 2.30 but have slightly different unrounded rates.
What this ranking does not measure: it does not establish fault or negligence, measure carrier safety, count all truck crashes, or adjust for truck mileage, freight activity, registered trucks, or road mileage. One-year rates can also move sharply in states with small populations or small fatality counts.
Main ranking: all 50 states
Search by state, filter by Census region or data type, change the sort order, or limit the view to the Top 10 or Top 20.
U.S. states ranked by fatalities in large-truck crashes per 100,000 residents, 2024
| Rank | State | Rate / 100k | How the rate was calculated |
|---|---|---|---|
| 1 | New Mexico | 3.95 | West. Calculated from 84 fatalities reported by NHTSA for 2024 and a Census 2024 population estimate of 2,126,774. |
| 2 | Wyoming | 3.75 | West. Calculated from 22 fatalities reported by NHTSA for 2024 and a Census 2024 population estimate of 586,722. |
| 3 | Mississippi | 3.49 | South. Calculated from 103 fatalities reported by NHTSA for 2024 and a Census 2024 population estimate of 2,950,172. |
| 4 | South Dakota | 3.45 | Midwest. Calculated from 32 fatalities reported by NHTSA for 2024 and a Census 2024 population estimate of 927,110. |
| 5 | Arkansas | 3.33 | South. Calculated from 103 fatalities reported by NHTSA for 2024 and a Census 2024 population estimate of 3,096,080. |
| 6 | Nebraska | 3.04 | Midwest. Calculated from 61 fatalities reported by NHTSA for 2024 and a Census 2024 population estimate of 2,005,591. |
| 7 | North Dakota | 3.03 | Midwest. Calculated from 24 fatalities reported by NHTSA for 2024 and a Census 2024 population estimate of 793,387. |
| 8 | Oklahoma | 2.78 | South. Calculated from 114 fatalities reported by NHTSA for 2024 and a Census 2024 population estimate of 4,097,758. |
| 9 | Montana | 2.73 | West. Calculated from 31 fatalities reported by NHTSA for 2024 and a Census 2024 population estimate of 1,137,557. |
| 10 | Alabama | 2.61 | South. Calculated from 135 fatalities reported by NHTSA for 2024 and a Census 2024 population estimate of 5,163,055. |
| 11 | South Carolina | 2.53 | South. Calculated from 139 fatalities reported by NHTSA for 2024 and a Census 2024 population estimate of 5,490,316. |
| 12 | Tennessee | 2.36 | South. Calculated from 171 fatalities reported by NHTSA for 2024 and a Census 2024 population estimate of 7,251,291. |
| 13 | Missouri | 2.31 | Midwest. Calculated from 144 fatalities reported by NHTSA for 2024 and a Census 2024 population estimate of 6,243,544. |
| 14 | Idaho | 2.30 | West. Calculated from 46 fatalities reported by NHTSA for 2024 and a Census 2024 population estimate of 2,000,872. |
| 15 | Texas | 2.30 | South. Calculated from 720 fatalities reported by NHTSA for 2024 and a Census 2024 population estimate of 31,318,578. |
| 16 | West Virginia | 2.26 | South. Calculated from 40 fatalities reported by NHTSA for 2024 and a Census 2024 population estimate of 1,767,402. |
| 17 | Kansas | 2.23 | Midwest. Calculated from 66 fatalities reported by NHTSA for 2024 and a Census 2024 population estimate of 2,965,252. |
| 18 | Indiana | 2.09 | Midwest. Calculated from 145 fatalities reported by NHTSA for 2024 and a Census 2024 population estimate of 6,934,754. |
| 19 | Maine | 2.06 | Northeast. Calculated from 29 fatalities reported by NHTSA for 2024 and a Census 2024 population estimate of 1,408,438. |
| 20 | Louisiana | 2.04 | South. Calculated from 94 fatalities reported by NHTSA for 2024 and a Census 2024 population estimate of 4,614,878. |
| 21 | Oregon | 1.95 | West. Calculated from 83 fatalities reported by NHTSA for 2024 and a Census 2024 population estimate of 4,265,324. |
| 22 | Kentucky | 1.88 | South. Calculated from 86 fatalities reported by NHTSA for 2024 and a Census 2024 population estimate of 4,584,046. |
| 23 | North Carolina | 1.85 | South. Calculated from 205 fatalities reported by NHTSA for 2024 and a Census 2024 population estimate of 11,052,061. |
| 24 | Arizona | 1.85 | West. Calculated from 140 fatalities reported by NHTSA for 2024 and a Census 2024 population estimate of 7,556,424. |
| 25 | Iowa | 1.80 | Midwest. Calculated from 58 fatalities reported by NHTSA for 2024 and a Census 2024 population estimate of 3,230,454. |
| 26 | Georgia | 1.76 | South. Calculated from 197 fatalities reported by NHTSA for 2024 and a Census 2024 population estimate of 11,204,208. |
| 27 | Colorado | 1.75 | West. Calculated from 105 fatalities reported by NHTSA for 2024 and a Census 2024 population estimate of 5,988,502. |
| 28 | Florida | 1.52 | South. Calculated from 353 fatalities reported by NHTSA for 2024 and a Census 2024 population estimate of 23,265,838. |
| 29 | Wisconsin | 1.49 | Midwest. Calculated from 89 fatalities reported by NHTSA for 2024 and a Census 2024 population estimate of 5,957,168. |
| 30 | Ohio | 1.47 | Midwest. Calculated from 174 fatalities reported by NHTSA for 2024 and a Census 2024 population estimate of 11,860,621. |
| 31 | Utah | 1.40 | West. Calculated from 49 fatalities reported by NHTSA for 2024 and a Census 2024 population estimate of 3,502,983. |
| 32 | Minnesota | 1.40 | Midwest. Calculated from 81 fatalities reported by NHTSA for 2024 and a Census 2024 population estimate of 5,797,405. |
| 33 | Virginia | 1.38 | South. Calculated from 122 fatalities reported by NHTSA for 2024 and a Census 2024 population estimate of 8,819,642. |
| 34 | Alaska | 1.36 | West. Calculated from 10 fatalities reported by NHTSA for 2024 and a Census 2024 population estimate of 736,537. |
| 35 | Nevada | 1.32 | West. Calculated from 43 fatalities reported by NHTSA for 2024 and a Census 2024 population estimate of 3,253,543. |
| 36 | Pennsylvania | 1.28 | Northeast. Calculated from 167 fatalities reported by NHTSA for 2024 and a Census 2024 population estimate of 13,045,848. |
| 37 | Illinois | 1.17 | Midwest. Calculated from 148 fatalities reported by NHTSA for 2024 and a Census 2024 population estimate of 12,703,033. |
| 38 | Michigan | 1.11 | Midwest. Calculated from 112 fatalities reported by NHTSA for 2024 and a Census 2024 population estimate of 10,099,962. |
| 39 | Delaware | 1.05 | South. Calculated from 11 fatalities reported by NHTSA for 2024 and a Census 2024 population estimate of 1,050,123. |
| 40 | Maryland | 1.02 | South. Calculated from 64 fatalities reported by NHTSA for 2024 and a Census 2024 population estimate of 6,245,314. |
| 41 | California | 0.99 | West. Calculated from 391 fatalities reported by NHTSA for 2024 and a Census 2024 population estimate of 39,364,774. |
| 42 | Washington | 0.93 | West. Calculated from 74 fatalities reported by NHTSA for 2024 and a Census 2024 population estimate of 7,927,958. |
| 43 | New Hampshire | 0.92 | Northeast. Calculated from 13 fatalities reported by NHTSA for 2024 and a Census 2024 population estimate of 1,408,518. |
| 44 | Connecticut | 0.90 | Northeast. Calculated from 33 fatalities reported by NHTSA for 2024 and a Census 2024 population estimate of 3,674,449. |
| 45 | New Jersey | 0.73 | Northeast. Calculated from 69 fatalities reported by NHTSA for 2024 and a Census 2024 population estimate of 9,506,354. |
| 46 | Vermont | 0.62 | Northeast. Calculated from 4 fatalities reported by NHTSA for 2024 and a Census 2024 population estimate of 646,521. |
| 47 | New York | 0.58 | Northeast. Calculated from 117 fatalities reported by NHTSA for 2024 and a Census 2024 population estimate of 20,001,419. |
| 48 | Rhode Island | 0.45 | Northeast. Calculated from 5 fatalities reported by NHTSA for 2024 and a Census 2024 population estimate of 1,110,415. |
| 49 | Massachusetts | 0.43 | Northeast. Calculated from 31 fatalities reported by NHTSA for 2024 and a Census 2024 population estimate of 7,138,560. |
| 50 | Hawaii | 0.14 | West. Calculated from 2 fatalities reported by NHTSA for 2024 and a Census 2024 population estimate of 1,434,952. |
No states match the selected filters.
This compiled research dataset uses NHTSA's 2024 state fatality counts and the Census Bureau's revised July 1, 2024 population estimates. Rates are calculated before rounding, which is why states displaying the same two-decimal rate can still have different ranks.
Insights from the 50-state ranking
Key Insight
New Mexico ranks first at 3.95 fatalities per 100,000 residents. Its rate is about 0.20 deaths per 100,000 higher than Wyoming's.
Notable Pattern
Seven states have rates above 3.00: New Mexico, Wyoming, Mississippi, South Dakota, Arkansas, Nebraska, and North Dakota.
Regional Concentration
The Top 10 includes four Southern states, three Western states, and three Midwestern states. Maine is the highest-ranked Northeastern state at No. 19.
Outlier
Hawaii ranks last at 0.14 based on only 2 fatalities. With such a small count, even one additional fatality would noticeably change its one-year rate.
How to interpret the ranking
The table compares the location of fatal large-truck crashes with state population size. It does not identify the state with the greatest absolute number of deaths. Texas recorded 720 fatalities, the highest state count in the NHTSA table, but ranks 15th after population normalization.
NHTSA and the Census Bureau publish the underlying figures, while the rate shown here is calculated from those figures. Readers should therefore treat it as a transparent StatRanker calculation rather than an official NHTSA rate.
Population is only one way to compare states. A different analysis could compare fatalities with truck mileage, registered trucks, freight volumes, or total road mileage. Those measures answer different questions and could produce a different ranking.
Large-truck involvement also does not establish fault. A fatality is counted because a large truck was involved in the qualifying traffic crash, not because NHTSA determined that a truck driver, motor carrier, or another road user caused the crash.
Download the U.S. States by Large-Truck Crash Fatality Rate: 2026 Snapshot dataset
U.S. States by Large-Truck Crash Fatality Rate: 2026 Snapshot
50 ranked entries · Excel + CSV + methodology + sources + chart · Snapshot: 2024 NHTSA FARS large-truck fatalities + Census population / 2026 snapshot · Version 1.0
The archive includes machine-readable data, methodology and source documentation. Quick human verification is required before the ZIP is delivered. Full Data Pack downloads require a free account. Free accounts can download 1 different Data Pack every 30 days; re-downloading the same pack does not use another slot. Annual Data Access provides unlimited manual downloads while annual access is active.
Download Excel + CSV Data PackFAQ
Which state has the highest large-truck crash fatality rate?
New Mexico ranks first at 3.95 fatalities per 100,000 residents, based on 84 fatalities and a revised 2024 population estimate of 2,126,774.
Are these official NHTSA fatality rates?
No. NHTSA publishes the number of fatalities, and the Census Bureau publishes state population estimates. StatRanker calculates the per-100,000 rate from those published figures using the same formula for every state.
Are the 2024 FARS figures final?
No. The NHTSA publication used here identifies 2024 as the FARS Annual Report File. NHTSA may revise these figures when the corresponding Final File is released.
Who is included in the fatality count?
The total can include large-truck occupants, occupants of other vehicles, and nonoccupants. The measure is not limited to truck drivers or truck passengers.
What counts as a large truck?
For the NHTSA source used here, a large truck is a medium or heavy truck with a gross vehicle weight rating greater than 10,000 pounds, excluding buses and motor homes. Both commercial and non-commercial vehicles can qualify.
Does the state rate describe residents killed?
Not necessarily. FARS assigns the crash to the state where it occurred, while the population figure represents state residents. A person killed in a crash may therefore live in another state.
Why use Census Vintage 2025 for a 2024 rate?
Because Vintage 2025 contains the Census Bureau's revised estimate of each state's July 1, 2024 population. The crash counts and population figures still refer to the same year: 2024.
Why does Idaho rank above Texas when both display 2.30?
The ranking uses unrounded rates. Idaho's value is fractionally higher than Texas's, even though both round to 2.30 when shown to two decimal places.
Sources
This compiled research dataset uses two official U.S. federal sources: NHTSA for fatality counts and the U.S. Census Bureau for population estimates.
NHTSA — Large Trucks: 2024 Data, DOT HS 813 816
Used for the number of people killed in crashes involving large trucks in each state in 2024. Table 7 contains the state figures used in this ranking and identifies the 2024 data as FARS Annual Report File data.
https://crashstats.nhtsa.dot.gov/Api/Public/ViewPublication/813816
U.S. Census Bureau — NST-EST2025-POP
Used for revised July 1, 2024 state population estimates. These figures are used to convert the NHTSA fatality counts into rates per 100,000 residents.
https://www2.census.gov/programs-surveys/popest/tables/2020-2025/state/totals/NST-EST2025-POP.xlsx
Related rankings
Closely related StatRanker ranking and data pages selected by topic, entity scope and category. Fewer links are shown when strong matches are limited.
