


Population by Country 2026: UN Population Projection and Full Ranking
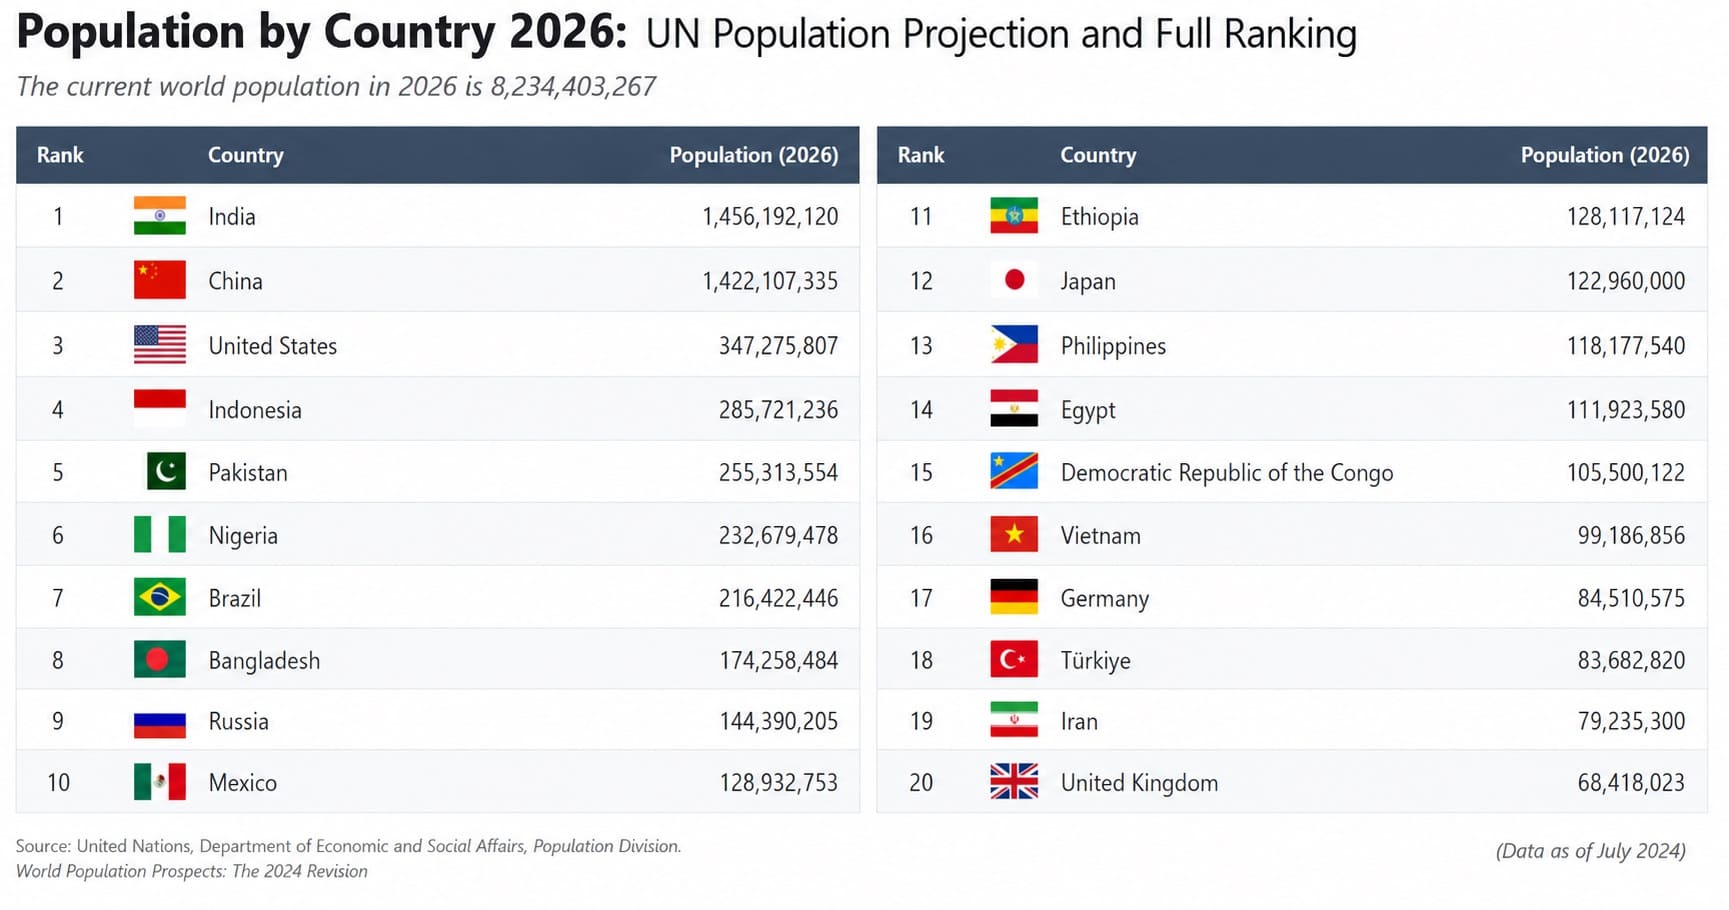
How to read the 2026 global population ranking
India is projected to have the world’s largest population in mid-2026 at about 1.477 billion people, followed by China at about 1.413 billion and the United States at about 349.0 million. The UN world total is about 8.301 billion.
The ranking uses the United Nations World Population Prospects 2024 medium-variant projections. It compares total resident population across the locations classified by the UN as countries or areas and excludes regional, income-group and other aggregate rows.
Source: UN DESA Population Division, World Population Prospects 2024 compact demographic indicators. Data retrieved July 12, 2026. The figures are medium-variant projections rather than census counts.
Continue exploring
More StatRanker rankings on population structure, growth and demographic change.
World Population Trends: Growth, Decline, and Projections for 2050
Open rankingTop 100 Countries by Urbanization Rate (% Urban Population), 2025
Open rankingTop 100 Countries by Population Growth Rate, 2025
Open rankingIndia ranks first in the UN projection for 1 July 2026.
India is projected to exceed China by about 63.7 million people.
UN world-row projection for mid-2026.
Countries and areas in the UN dataset; aggregates are excluded.
What the population metric measures
Total population is the number of residents living in a country or area at a specified date. This ranking uses the UN mid-year measure for 2026, both sexes combined. A higher rank means a larger resident population; it does not indicate better economic or social performance.
The UN uses the term “country or area” because the dataset includes sovereign states, territories and other separately reported locations. The table follows that coverage and does not combine those rows with world or regional totals.
India and China together account for 34.8% of the UN world total, while the first ten entries account for 56.6%. Sixteen locations exceed 100 million residents.
What this metric does not show
Population size is not population growth, density, urbanization, age structure, citizenship, economic output or living standards. A large population can be growing quickly, growing slowly or declining.
Top 20 projected populations in 2026
India and China are the only entries above one billion. The next-largest population, the United States, is less than one quarter of India’s total. Asia accounts for 10 of the Top 20 entries, Africa for 5, Europe for 2, Latin America and the Caribbean for 2, and Northern America for 1.
Why population differs between countries
Population size reflects accumulated demographic history, not a single year of births or migration. Four forces explain most of the differences in the ranking and most changes over time.
Demographic momentum
A country with a large young population can keep growing even after fertility falls because many people are entering the ages when families are formed. The UN identifies this age-structure momentum as the main driver of global population growth through mid-century.
Fertility
Countries with more births per woman usually add population faster, especially when large cohorts are already in the reproductive ages. Persistently low fertility can eventually produce population decline unless migration offsets it.
Mortality and longevity
Lower child and adult mortality increases the number of people surviving through each age group. Longer life expectancy also raises population at older ages, although ageing can coincide with slow or negative overall growth.
International migration
Net immigration can support growth in countries with low fertility, while sustained emigration can reduce or delay growth. Migration assumptions are often the most volatile part of short-term national projections, especially during conflicts or economic shocks.
Full ranking of 237 countries and areas
Search by official or common name, filter by UN continental region, change the sort order or restrict the table to the original Top 10 or Top 20 ranks.
The source values are reported in thousands. Display labels are converted to B, M or K units and rounded only after the ranking is calculated.
Showing 237 of 237 entries.
Projected resident population in mid-2026; values rounded for display
| Rank | Entity | Population | Region |
|---|---|---|---|
| 1 | India | 1.477B | Asia |
| 2 | China | 1.413B | Asia |
| 3 | United States of America | 349.035M | Northern America |
| 4 | Indonesia | 287.887M | Asia |
| 5 | Pakistan | 259.300M | Asia |
| 6 | Nigeria | 242.432M | Africa |
| 7 | Brazil | 213.563M | Latin America and the Caribbean |
| 8 | Bangladesh | 177.818M | Asia |
| 9 | Russian Federation | 143.394M | Europe |
| 10 | Ethiopia | 138.902M | Africa |
| 11 | Mexico | 132.998M | Latin America and the Caribbean |
| 12 | Japan | 122.428M | Asia |
| 13 | Egypt | 120.101M | Africa |
| 14 | Philippines | 117.724M | Asia |
| 15 | Democratic Republic of the Congo | 116.452M | Africa |
| 16 | Viet Nam | 102.177M | Asia |
| 17 | Iran (Islamic Republic of) | 93.168M | Asia |
| 18 | Türkiye | 87.926M | Asia |
| 19 | Germany | 83.644M | Europe |
| 20 | United Republic of Tanzania | 72.564M | Africa |
| 21 | Thailand | 71.560M | Asia |
| 22 | United Kingdom | 69.932M | Europe |
| 23 | France | 66.746M | Europe |
| 24 | South Africa | 65.453M | Africa |
| 25 | Italy | 58.926M | Europe |
| 26 | Kenya | 58.636M | Africa |
| 27 | Myanmar | 55.185M | Asia |
| 28 | Colombia | 53.936M | Latin America and the Caribbean |
| 29 | Sudan | 53.283M | Africa |
| 30 | Uganda | 52.761M | Africa |
| 31 | Republic of Korea | 51.600M | Asia |
| 32 | Algeria | 48.028M | Africa |
| 33 | Iraq | 48.007M | Asia |
| 34 | Spain | 47.851M | Europe |
| 35 | Argentina | 46.004M | Latin America and the Caribbean |
| 36 | Afghanistan | 45.047M | Asia |
| 37 | Yemen | 42.962M | Asia |
| 38 | Canada | 40.468M | Northern America |
| 39 | Angola | 40.215M | Africa |
| 40 | Ukraine | 39.536M | Europe |
| 41 | Morocco | 38.762M | Africa |
| 42 | Poland | 37.843M | Europe |
| 43 | Uzbekistan | 37.724M | Asia |
| 44 | Mozambique | 36.640M | Africa |
| 45 | Malaysia | 36.385M | Asia |
| 46 | Ghana | 35.698M | Africa |
| 47 | Saudi Arabia | 35.166M | Asia |
| 48 | Peru | 34.922M | Latin America and the Caribbean |
| 49 | Madagascar | 33.522M | Africa |
| 50 | Côte d'Ivoire | 33.494M | Africa |
| 51 | Cameroon | 30.641M | Africa |
| 52 | Nepal | 29.629M | Asia |
| 53 | Niger | 28.815M | Africa |
| 54 | Venezuela (Bolivarian Republic of) | 28.634M | Latin America and the Caribbean |
| 55 | Australia | 27.227M | Oceania |
| 56 | Dem. People's Republic of Korea | 26.634M | Asia |
| 57 | Syrian Arab Republic | 26.472M | Asia |
| 58 | Mali | 25.932M | Africa |
| 59 | Burkina Faso | 24.602M | Africa |
| 60 | Sri Lanka | 23.348M | Asia |
| 61 | China, Taiwan Province of China | 23.011M | Asia |
| 62 | Malawi | 22.786M | Africa |
| 63 | Zambia | 22.522M | Africa |
| 64 | Chad | 21.560M | Africa |
| 65 | Kazakhstan | 21.084M | Asia |
| 66 | Somalia | 20.306M | Africa |
| 67 | Chile | 19.946M | Latin America and the Caribbean |
| 68 | Senegal | 19.367M | Africa |
| 69 | Guatemala | 18.968M | Latin America and the Caribbean |
| 70 | Romania | 18.801M | Europe |
| 71 | Netherlands | 18.449M | Europe |
| 72 | Ecuador | 18.445M | Latin America and the Caribbean |
| 73 | Cambodia | 18.051M | Asia |
| 74 | Zimbabwe | 17.274M | Africa |
| 75 | Guinea | 15.442M | Africa |
| 76 | Benin | 15.170M | Africa |
| 77 | Rwanda | 14.890M | Africa |
| 78 | Burundi | 14.729M | Africa |
| 79 | Bolivia (Plurinational State of) | 12.749M | Latin America and the Caribbean |
| 80 | South Sudan | 12.436M | Africa |
| 81 | Tunisia | 12.415M | Africa |
| 82 | Haiti | 12.038M | Latin America and the Caribbean |
| 83 | Belgium | 11.775M | Europe |
| 84 | Dominican Republic | 11.610M | Latin America and the Caribbean |
| 85 | Jordan | 11.590M | Asia |
| 86 | United Arab Emirates | 11.575M | Asia |
| 87 | Honduras | 11.185M | Latin America and the Caribbean |
| 88 | Tajikistan | 10.979M | Asia |
| 89 | Papua New Guinea | 10.948M | Oceania |
| 90 | Cuba | 10.893M | Latin America and the Caribbean |
| 91 | Sweden | 10.701M | Europe |
| 92 | Czechia | 10.528M | Europe |
| 93 | Azerbaijan | 10.455M | Asia |
| 94 | Portugal | 10.395M | Europe |
| 95 | Togo | 9.931M | Africa |
| 96 | Greece | 9.897M | Europe |
| 97 | Israel | 9.648M | Asia |
| 98 | Hungary | 9.586M | Europe |
| 99 | Austria | 9.107M | Europe |
| 100 | Switzerland | 9.008M | Europe |
| 101 | Sierra Leone | 8.997M | Africa |
| 102 | Belarus | 8.937M | Europe |
| 103 | Lao People's Democratic Republic | 7.974M | Asia |
| 104 | Turkmenistan | 7.737M | Asia |
| 105 | Libya | 7.540M | Africa |
| 106 | Kyrgyzstan | 7.400M | Asia |
| 107 | China, Hong Kong SAR | 7.379M | Asia |
| 108 | Nicaragua | 7.097M | Latin America and the Caribbean |
| 109 | Paraguay | 7.095M | Latin America and the Caribbean |
| 110 | Bulgaria | 6.668M | Europe |
| 111 | Serbia | 6.642M | Europe |
| 112 | Congo | 6.638M | Africa |
| 113 | El Salvador | 6.391M | Latin America and the Caribbean |
| 114 | Denmark | 6.024M | Europe |
| 115 | Singapore | 5.906M | Asia |
| 116 | Lebanon | 5.897M | Asia |
| 117 | Liberia | 5.854M | Africa |
| 118 | Central African Republic | 5.699M | Africa |
| 119 | State of Palestine | 5.693M | Asia |
| 120 | Oman | 5.671M | Asia |
| 121 | Norway | 5.653M | Europe |
| 122 | Finland | 5.622M | Europe |
| 123 | Mauritania | 5.461M | Africa |
| 124 | Slovakia | 5.451M | Europe |
| 125 | Ireland | 5.357M | Europe |
| 126 | New Zealand | 5.287M | Oceania |
| 127 | Costa Rica | 5.175M | Latin America and the Caribbean |
| 128 | Kuwait | 5.103M | Asia |
| 129 | Panama | 4.626M | Latin America and the Caribbean |
| 130 | Croatia | 3.822M | Europe |
| 131 | Georgia | 3.805M | Asia |
| 132 | Eritrea | 3.683M | Africa |
| 133 | Mongolia | 3.557M | Asia |
| 134 | Uruguay | 3.383M | Latin America and the Caribbean |
| 135 | Puerto Rico | 3.223M | Latin America and the Caribbean |
| 136 | Qatar | 3.174M | Asia |
| 137 | Namibia | 3.153M | Africa |
| 138 | Bosnia and Herzegovina | 3.114M | Europe |
| 139 | Republic of Moldova | 2.961M | Europe |
| 140 | Armenia | 2.931M | Asia |
| 141 | Gambia | 2.884M | Africa |
| 142 | Jamaica | 2.833M | Latin America and the Caribbean |
| 143 | Lithuania | 2.797M | Europe |
| 144 | Albania | 2.751M | Europe |
| 145 | Gabon | 2.647M | Africa |
| 146 | Botswana | 2.603M | Africa |
| 147 | Lesotho | 2.389M | Africa |
| 148 | Guinea-Bissau | 2.298M | Africa |
| 149 | Slovenia | 2.115M | Europe |
| 150 | Equatorial Guinea | 1.984M | Africa |
| 151 | Latvia | 1.836M | Europe |
| 152 | North Macedonia | 1.804M | Europe |
| 153 | Bahrain | 1.676M | Asia |
| 154 | Kosovo (under UNSC res. 1244) | 1.667M | Europe |
| 155 | Trinidad and Tobago | 1.513M | Latin America and the Caribbean |
| 156 | Timor-Leste | 1.437M | Asia |
| 157 | Cyprus | 1.382M | Asia |
| 158 | Estonia | 1.331M | Europe |
| 159 | Eswatini | 1.270M | Africa |
| 160 | Mauritius | 1.265M | Africa |
| 161 | Djibouti | 1.199M | Africa |
| 162 | Fiji | 937.3K | Oceania |
| 163 | Comoros | 899.0K | Africa |
| 164 | Réunion | 886.3K | Africa |
| 165 | Solomon Islands | 858.3K | Oceania |
| 166 | Guyana | 840.9K | Latin America and the Caribbean |
| 167 | Bhutan | 802.2K | Asia |
| 168 | China, Macao SAR | 723.2K | Asia |
| 169 | Luxembourg | 687.4K | Europe |
| 170 | Suriname | 645.3K | Latin America and the Caribbean |
| 171 | Montenegro | 626.2K | Europe |
| 172 | Western Sahara | 610.8K | Africa |
| 173 | Malta | 549.0K | Europe |
| 174 | Maldives | 531.5K | Asia |
| 175 | Cabo Verde | 529.6K | Africa |
| 176 | Brunei Darussalam | 469.8K | Asia |
| 177 | Belize | 428.6K | Latin America and the Caribbean |
| 178 | Bahamas | 404.6K | Latin America and the Caribbean |
| 179 | Iceland | 402.3K | Europe |
| 180 | Guadeloupe | 372.5K | Latin America and the Caribbean |
| 181 | Mayotte | 347.5K | Africa |
| 182 | Vanuatu | 342.6K | Oceania |
| 183 | Martinique | 337.7K | Latin America and the Caribbean |
| 184 | French Guiana | 318.9K | Latin America and the Caribbean |
| 185 | New Caledonia | 297.9K | Oceania |
| 186 | French Polynesia | 283.1K | Oceania |
| 187 | Barbados | 282.7K | Latin America and the Caribbean |
| 188 | Sao Tome and Principe | 245.0K | Africa |
| 189 | Samoa | 220.5K | Oceania |
| 190 | Curaçao | 185.4K | Latin America and the Caribbean |
| 191 | Saint Lucia | 180.5K | Latin America and the Caribbean |
| 192 | Guam | 170.2K | Oceania |
| 193 | Kiribati | 138.4K | Oceania |
| 194 | Seychelles | 135.0K | Africa |
| 195 | Grenada | 117.4K | Latin America and the Caribbean |
| 196 | Micronesia (Fed. States of) | 114.2K | Oceania |
| 197 | Aruba | 108.2K | Latin America and the Caribbean |
| 198 | Jersey | 104.1K | Europe |
| 199 | Tonga | 103.3K | Oceania |
| 200 | Saint Vincent and the Grenadines | 99.2K | Latin America and the Caribbean |
| 201 | Antigua and Barbuda | 94.6K | Latin America and the Caribbean |
| 202 | Isle of Man | 84.1K | Europe |
| 203 | Andorra | 83.8K | Europe |
| 204 | United States Virgin Islands | 83.4K | Latin America and the Caribbean |
| 205 | Cayman Islands | 77.2K | Latin America and the Caribbean |
| 206 | Dominica | 65.5K | Latin America and the Caribbean |
| 207 | Guernsey | 64.6K | Europe |
| 208 | Bermuda | 64.5K | Northern America |
| 209 | Faroe Islands | 56.5K | Europe |
| 210 | Greenland | 55.6K | Northern America |
| 211 | Turks and Caicos Islands | 47.1K | Latin America and the Caribbean |
| 212 | Saint Kitts and Nevis | 47.0K | Latin America and the Caribbean |
| 213 | American Samoa | 45.3K | Oceania |
| 214 | Sint Maarten (Dutch part) | 44.4K | Latin America and the Caribbean |
| 215 | Northern Mariana Islands | 42.9K | Oceania |
| 216 | Gibraltar | 40.9K | Europe |
| 217 | Liechtenstein | 40.4K | Europe |
| 218 | British Virgin Islands | 39.9K | Latin America and the Caribbean |
| 219 | Monaco | 38.1K | Europe |
| 220 | Marshall Islands | 35.1K | Oceania |
| 221 | San Marino | 33.6K | Europe |
| 222 | Bonaire, Sint Eustatius and Saba | 31.9K | Latin America and the Caribbean |
| 223 | Saint Martin (French part) | 23.9K | Latin America and the Caribbean |
| 224 | Palau | 17.6K | Oceania |
| 225 | Anguilla | 14.8K | Latin America and the Caribbean |
| 226 | Cook Islands | 12.8K | Oceania |
| 227 | Nauru | 12.1K | Oceania |
| 228 | Saint Barthélemy | 11.6K | Latin America and the Caribbean |
| 229 | Wallis and Futuna Islands | 11.1K | Oceania |
| 230 | Tuvalu | 9.4K | Oceania |
| 231 | Saint Pierre and Miquelon | 5.5K | Northern America |
| 232 | Saint Helena | 5.1K | Africa |
| 233 | Montserrat | 4.3K | Latin America and the Caribbean |
| 234 | Falkland Islands (Malvinas) | 3.5K | Latin America and the Caribbean |
| 235 | Tokelau | 2.7K | Oceania |
| 236 | Niue | 1.8K | Oceania |
| 237 | Holy See | 506 | Europe |
Methodology and limitations
The ranking uses the “Total Population, as of 1 July (thousands)” field for 2026 from the Medium variant sheet in the UN World Population Prospects 2024 compact demographic indicators workbook. All included records have the UN type “Country/Area”. World and other aggregate rows are excluded.
Dates and projection period
The target date is 1 July 2026. In WPP 2024, the projection period begins on 1 January 2024 from the UN’s estimated population by age and sex.
How the UN projects population
The cohort-component method advances the population by age and sex while applying assumptions for fertility, mortality and net international migration. In simplified form: future population equals current population plus births, minus deaths, plus net migration.
Ranking and rounding
Rows are sorted from the largest 2026 value to the smallest. The workbook values are reported in thousands and converted for display. The UN world total comes from the published world row rather than a sum of rounded location values.
What the projection can change
Later UN revisions may alter both historical estimates and future projections when new censuses, birth and death registrations, surveys or migration evidence become available. Uncertainty is generally greater for countries affected by conflict, displacement or weak statistical systems.
The medium variant is the UN’s central projection path, not a guarantee or a census count. It is especially useful for a near-term global comparison, but small differences between neighboring ranks should not be treated as exact. Country and area names follow UN usage; those designations do not imply a position on legal status, sovereignty or boundaries.
What stands out in the 2026 ranking
India and China contain more than one third of humanity
Together, the two largest populations represent 34.8% of the UN world total. India’s projected lead is about 63.7 million people.
The Top 10 remain highly concentrated
The ten largest countries or areas account for 56.6% of the world population, showing how strongly global population is concentrated in a relatively small group.
Asia dominates the top, while Africa supplies many fast-growing giants
Asia holds half of the Top 20 positions. Africa has five, including Nigeria, Ethiopia, Egypt, the Democratic Republic of the Congo and Tanzania.
The largest 30-month shifts point in opposite directions
Between the UN values for 1 January 2024 and 1 July 2026, India shows the largest absolute increase at about 32.2 million, while China shows the largest decline at about 8.0 million. These are 30-month changes, not annual growth rates.
How to use this ranking responsibly
Use the table to compare the scale of resident populations at one common date. It is useful for market-size context, infrastructure planning, education and health-system capacity, environmental pressure and geopolitical comparison.
Do not use rank alone as a measure of growth or future opportunity. For that, compare population growth rates, fertility, age structure and migration. A country can be very large and shrinking, or relatively small and growing rapidly.
The smallest entries require extra care because modest numerical changes can produce large percentage swings. The table follows the UN country-or-area classification, so territories and other separately reported locations should not be interpreted as equivalent to sovereign states.
Frequently asked questions
What is the projected world population in 2026?
The UN WPP 2024 medium variant projects about 8.301 billion people worldwide in mid-2026.
Which country has the largest population in 2026?
India ranks first at about 1.477 billion people, followed by China at about 1.413 billion.
Has India overtaken China in population?
Yes. In the mid-2026 projection, India is about 63.7 million people larger than China.
How many countries have more than 100 million people?
Sixteen countries or areas exceed 100 million residents in this 2026 projection. Viet Nam is the last entry above that threshold.
Are these census counts?
No. They are UN medium-variant projections produced from demographic estimates and assumptions about births, deaths and migration. They should not be read as exact administrative counts.
Why does the ranking contain 237 entries?
World Population Prospects includes sovereign states, territories and other separately reported locations. Regional and global aggregates are excluded from the ranking.
How reliable is a 2026 population projection?
A near-term projection is generally more stable than a projection several decades ahead, but it can still change when new census, registration or migration data become available. Uncertainty is higher in places affected by conflict, displacement or limited statistical coverage.
Why can a low-fertility country still grow?
Demographic momentum can sustain growth when a large generation enters childbearing ages. Net immigration and longer life expectancy can also offset low fertility.
Related population rankings
Compare population with land area rather than total headcount alone.
See which populations are expanding or shrinking fastest.
Compare births per woman, one of the main drivers of long-term population change.
Explore how international migration changes national population totals.
Sources
UN World Population Prospects 2024
Open the official WPP portalOfficial overview of the 2024 Revision, its 237-country-or-area coverage and available downloads.
Compact demographic indicators workbook
Download WPP2024_GEN_F01_DEMOGRAPHIC_INDICATORS_COMPACT.xlsxPrimary table source: Medium variant, total population as of 1 July 2026, file GEN/01/REV1. Retrieved July 12, 2026.
WPP 2024 methodology report
Read the UN methodology reportExplains the cohort-component framework, fertility, mortality, migration assumptions and projection uncertainty.
WPP 2024 summary of results
Read the summary reportProvides global demographic context, key findings and interpretation of the 2024 Revision.
Related rankings
More StatRanker rankings on population structure, growth and demographic change.
Top 100 Countries by Prison Population Rate in 2025
Open rankingAging World: Top 10 Countries by Share of Population Aged 65+, 2025
Open rankingWorld Population by Country (2025): Top 100 Most Populous Nations Ranked
Open rankingTOP 20 Countries with Fastest Population Aging (2015–2025)
Open ranking
StatRanker (Website)
administrator
