

Top 100 Countries by Employment Rate, 2026
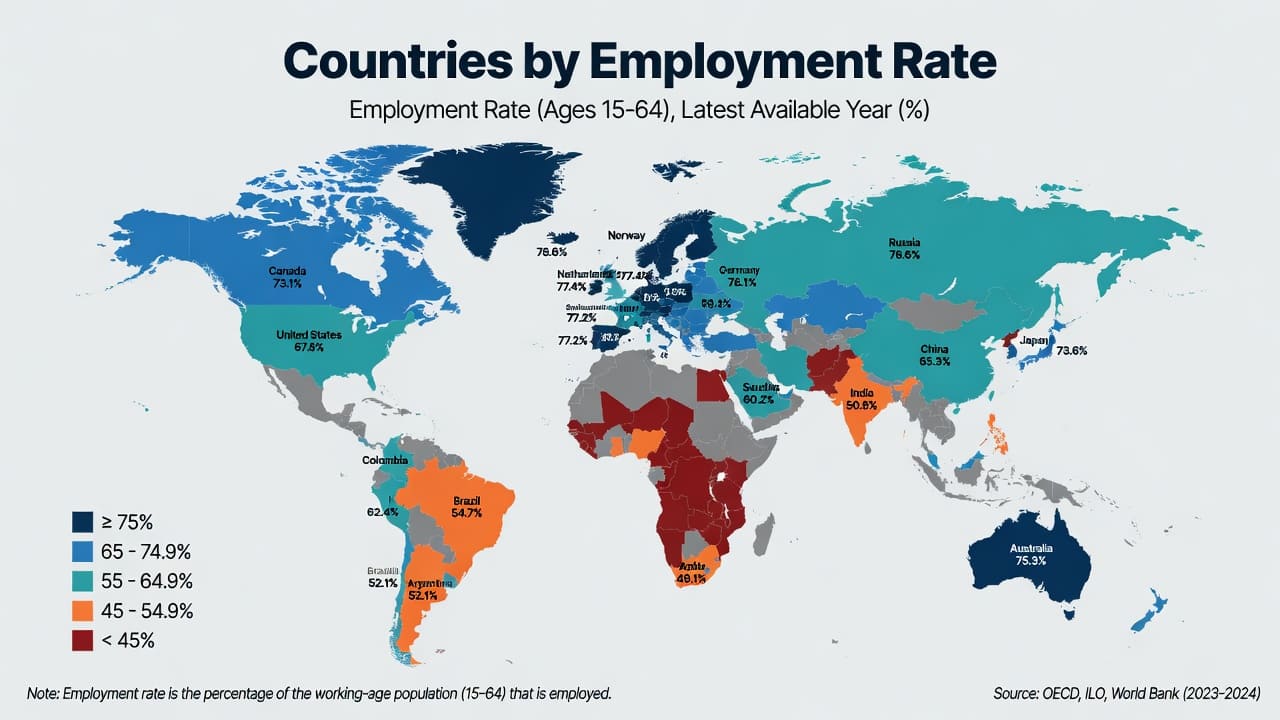
How much of the adult population is employed?
Qatar leads this Top 100 with an employment-to-population ratio of 86.9%, followed by Solomon Islands at 83.1% and Madagascar at 82.9%. The indicator measures the share of people aged 15 and older who are employed, including paid employment and self-employment under the ILO statistical definition.
The ranking uses the 2025 values officially disseminated by the World Bank for indicator SL.EMP.TOTL.SP.ZS. These are ILO modelled estimates, not a collection of direct national survey observations and not projections created for this page.
Every ranked value comes from World Bank indicator SL.EMP.TOTL.SP.ZS, based on ILO modelled estimates. Higher percentages rank higher.
Continue exploring
More StatRanker pages connected by topic, category or ranking theme.
Qatar is 3.8 percentage points above the second-ranked country.
Mongolia sets the 56.6% cutoff for inclusion in this Top 100.
Calculated from the 100 underlying values before display rounding.
Percent of the population aged 15+; all ranked observations refer to 2025.
What the employment-to-population ratio means
Employment-to-population ratio = employed persons aged 15+ ÷ total population aged 15+ × 100. A value of 65% means that about 65 of every 100 people in that age group are employed.
The denominator includes employed people, unemployed people and people outside the labour force. That is why this measure is not the opposite of the unemployment rate: unemployment uses the labour force as its denominator, while this ratio uses the entire population aged 15 and older.
A higher result means a larger employed share of the broad adult population. It does not by itself show whether jobs are formal, secure, productive, full-time or well paid. It also does not measure earnings, hours, underemployment, worker protection or living standards.
The ten highest employment ratios in the table
The ten highest values span the Gulf, Pacific island economies, East Africa and Southeast Asia, showing that similar employment ratios can emerge from very different labour-market structures.
| Global rank | Country | Rate | World Bank region |
|---|---|---|---|
| 1 | Qatar | 86.9% | Middle East, North Africa, Afghanistan and Pakistan |
| 2 | Solomon Islands | 83.1% | East Asia and Pacific |
| 3 | Madagascar | 82.9% | Sub-Saharan Africa |
| 4 | Tanzania | 82.4% | Sub-Saharan Africa |
| 5 | Cambodia | 82.2% | East Asia and Pacific |
| 6 | Nigeria | 80.0% | Sub-Saharan Africa |
| 7 | Niger | 79.4% | Sub-Saharan Africa |
| 8 | Korea, Dem. People's Rep. | 79.2% | East Asia and Pacific |
| 9 | Uganda | 77.8% | Sub-Saharan Africa |
| 10 | Burundi | 77.5% | Sub-Saharan Africa |
Ranks use the unrounded values in descending order. Displayed percentages are rounded to one decimal place.
Top 20 compared on one scale
Qatar is the only entry above 85%. The twentieth-ranked country, Moldova, stands at 71.2%, leaving a 15.7-point gap between the first and twentieth positions.
Methodology, dates and coverage rules
The World Bank metadata identifies this as the date it accessed the ILO modelled-estimates source.
The ranking uses the World Development Indicators release available on this date.
All ranked values refer to 2025; 2026 is the publication snapshot year.
Metric and ranking
World Bank indicator SL.EMP.TOTL.SP.ZS is sorted from the highest raw value to the lowest. Rounding is applied only after rank assignment.
Estimate type
The values are ILO modelled estimates disseminated through World Bank WDI. They combine harmonized national labour statistics with model-based estimates where comparable observations are incomplete.
Geographic eligibility
The eligible universe is the 193 United Nations member states. World Bank aggregates and economy entries that are not UN member states are removed before ranking.
Regions
Regional labels follow the World Bank FY2027 all-income classification, including the current name “Middle East, North Africa, Afghanistan and Pakistan.”
Exact geographic exclusions applied before ranking
All World Bank aggregate rows were removed, including world, regional, income, lending and other grouped totals. The UN-member-state rule also removes these World Bank economy labels when present in the indicator download: American Samoa; Aruba; Bermuda; British Virgin Islands; Cayman Islands; Channel Islands; Curaçao; Faroe Islands; French Polynesia; Gibraltar; Greenland; Guam; Hong Kong SAR, China; Isle of Man; Kosovo; Macao SAR, China; New Caledonia; Northern Mariana Islands; Puerto Rico; Sint Maarten (Dutch part); St. Martin (French part); Taiwan, China; Turks and Caicos Islands; Virgin Islands (U.S.); and West Bank and Gaza. Countries without a numeric 2025 value are not eligible for the ranked list.
How ties and missing values are handled
Ranks are assigned from the unrounded numeric values. If two raw values were exactly equal, they would retain adjacent positions in source order; no rounded display value is used to break a tie. Missing observations are not filled by this page.
Uncertainty and revisions in ILO modelled estimates
ILOEST combines nationally reported labour statistics with imputed observations produced through econometric models. The ILO warns that country estimates based on limited national information have a high degree of uncertainty and should not be treated as observed survey data.
Historical values can change between editions when countries publish new information, source databases are revised, methodological breaks are identified or the ILO updates its models. Comparisons should therefore cite the indicator, observation year and data-release date.
National statistical offices may publish different figures because they can use another age range, population benchmark, survey period or labour definition. ILOEST prioritizes consistent international comparison across countries and years.
Top 100 countries by employment-to-population ratio
Search by country, filter by World Bank region, change the display order or limit the visible results.
Showing 100 of 100 matching countries.
| Global rank | Country | Rate | World Bank region |
|---|---|---|---|
| 1 | Qatar | 86.9% | Middle East, North Africa, Afghanistan and Pakistan |
| 2 | Solomon Islands | 83.1% | East Asia and Pacific |
| 3 | Madagascar | 82.9% | Sub-Saharan Africa |
| 4 | Tanzania | 82.4% | Sub-Saharan Africa |
| 5 | Cambodia | 82.2% | East Asia and Pacific |
| 6 | Nigeria | 80.0% | Sub-Saharan Africa |
| 7 | Niger | 79.4% | Sub-Saharan Africa |
| 8 | Korea, Dem. People's Rep. | 79.2% | East Asia and Pacific |
| 9 | Uganda | 77.8% | Sub-Saharan Africa |
| 10 | Burundi | 77.5% | Sub-Saharan Africa |
| 11 | United Arab Emirates | 76.9% | Middle East, North Africa, Afghanistan and Pakistan |
| 12 | Bolivia | 76.3% | Latin America & the Caribbean |
| 13 | Benin | 75.1% | Sub-Saharan Africa |
| 14 | Liberia | 74.4% | Sub-Saharan Africa |
| 15 | Eritrea | 73.7% | Sub-Saharan Africa |
| 16 | Mozambique | 73.5% | Sub-Saharan Africa |
| 17 | Iceland | 72.2% | Europe and Central Asia |
| 18 | Kuwait | 71.8% | Middle East, North Africa, Afghanistan and Pakistan |
| 19 | Viet Nam | 71.7% | East Asia and Pacific |
| 20 | Moldova | 71.2% | Europe and Central Asia |
| 21 | Bahrain | 69.7% | Middle East, North Africa, Afghanistan and Pakistan |
| 22 | Peru | 69.1% | Latin America & the Caribbean |
| 23 | Central African Republic | 68.8% | Sub-Saharan Africa |
| 24 | Singapore | 67.7% | East Asia and Pacific |
| 25 | Burkina Faso | 67.6% | Sub-Saharan Africa |
| 26 | Jamaica | 67.3% | Latin America & the Caribbean |
| 27 | Bahamas, The | 67.0% | Latin America & the Caribbean |
| 28 | Paraguay | 66.9% | Latin America & the Caribbean |
| 29 | New Zealand | 66.8% | East Asia and Pacific |
| 30 | Ethiopia | 66.2% | Sub-Saharan Africa |
| 31 | Thailand | 66.2% | East Asia and Pacific |
| 32 | Oman | 66.2% | Middle East, North Africa, Afghanistan and Pakistan |
| 33 | Timor-Leste | 65.9% | East Asia and Pacific |
| 34 | Indonesia | 65.8% | East Asia and Pacific |
| 35 | Cote d'Ivoire | 65.5% | Sub-Saharan Africa |
| 36 | Lao PDR | 65.3% | East Asia and Pacific |
| 37 | Mali | 65.1% | Sub-Saharan Africa |
| 38 | Netherlands | 64.6% | Europe and Central Asia |
| 39 | Kazakhstan | 64.5% | Europe and Central Asia |
| 40 | Angola | 64.2% | Sub-Saharan Africa |
| 41 | Australia | 63.8% | East Asia and Pacific |
| 42 | Kenya | 63.7% | Sub-Saharan Africa |
| 43 | Cyprus | 63.7% | Europe and Central Asia |
| 44 | Malaysia | 63.6% | East Asia and Pacific |
| 45 | Switzerland | 63.5% | Europe and Central Asia |
| 46 | Israel | 63.2% | Middle East, North Africa, Afghanistan and Pakistan |
| 47 | Saudi Arabia | 63.1% | Middle East, North Africa, Afghanistan and Pakistan |
| 48 | Guinea-Bissau | 63.1% | Sub-Saharan Africa |
| 49 | Cameroon | 62.8% | Sub-Saharan Africa |
| 50 | Nicaragua | 62.7% | Latin America & the Caribbean |
| 51 | Bhutan | 62.7% | South Asia |
| 52 | Korea, Rep. | 62.6% | East Asia and Pacific |
| 53 | Norway | 62.6% | Europe and Central Asia |
| 54 | Ecuador | 62.4% | Latin America & the Caribbean |
| 55 | Malta | 62.1% | Middle East, North Africa, Afghanistan and Pakistan |
| 56 | Japan | 61.9% | East Asia and Pacific |
| 57 | Ireland | 61.8% | Europe and Central Asia |
| 58 | St. Lucia | 61.8% | Latin America & the Caribbean |
| 59 | China | 61.6% | East Asia and Pacific |
| 60 | Dominican Republic | 61.5% | Latin America & the Caribbean |
| 61 | Congo, Dem. Rep. | 61.5% | Sub-Saharan Africa |
| 62 | Zimbabwe | 61.4% | Sub-Saharan Africa |
| 63 | Denmark | 61.3% | Europe and Central Asia |
| 64 | Brunei Darussalam | 60.8% | East Asia and Pacific |
| 65 | Panama | 60.8% | Latin America & the Caribbean |
| 66 | Maldives | 60.6% | South Asia |
| 67 | Belarus | 60.6% | Europe and Central Asia |
| 68 | Barbados | 60.5% | Latin America & the Caribbean |
| 69 | Uruguay | 60.1% | Latin America & the Caribbean |
| 70 | Canada | 60.1% | North America |
| 71 | El Salvador | 60.1% | Latin America & the Caribbean |
| 72 | Philippines | 60.0% | East Asia and Pacific |
| 73 | Mexico | 60.0% | Latin America & the Caribbean |
| 74 | Azerbaijan | 59.8% | Europe and Central Asia |
| 75 | Russian Federation | 59.8% | Europe and Central Asia |
| 76 | Estonia | 59.7% | Europe and Central Asia |
| 77 | Malawi | 59.4% | Sub-Saharan Africa |
| 78 | Brazil | 59.4% | Latin America & the Caribbean |
| 79 | United States | 59.1% | North America |
| 80 | Sweden | 59.0% | Europe and Central Asia |
| 81 | Chad | 58.8% | Sub-Saharan Africa |
| 82 | Lithuania | 58.7% | Europe and Central Asia |
| 83 | Czechia | 58.6% | Europe and Central Asia |
| 84 | United Kingdom | 58.5% | Europe and Central Asia |
| 85 | Germany | 58.3% | Europe and Central Asia |
| 86 | Zambia | 58.3% | Sub-Saharan Africa |
| 87 | Colombia | 58.1% | Latin America & the Caribbean |
| 88 | Guatemala | 58.1% | Latin America & the Caribbean |
| 89 | Hungary | 57.8% | Europe and Central Asia |
| 90 | Luxembourg | 57.6% | Europe and Central Asia |
| 91 | Argentina | 57.5% | Latin America & the Caribbean |
| 92 | Albania | 57.2% | Europe and Central Asia |
| 93 | Slovak Republic | 57.2% | Europe and Central Asia |
| 94 | Ghana | 56.8% | Sub-Saharan Africa |
| 95 | Austria | 56.8% | Europe and Central Asia |
| 96 | Chile | 56.7% | Latin America & the Caribbean |
| 97 | Togo | 56.7% | Sub-Saharan Africa |
| 98 | Poland | 56.6% | Europe and Central Asia |
| 99 | Bangladesh | 56.6% | South Asia |
| 100 | Mongolia | 56.6% | East Asia and Pacific |
Why employment rates differ between countries
The ratio reflects both demand for labour and the composition of the population aged 15 and older. The factors below help explain differences, but none of them should be treated as a complete explanation for a country’s rank without country-specific evidence.
Migration and working-age composition
Economies with large migrant-worker populations can have an unusually high share of working-age adults who are employed. The ILO publishes separate labour-migration statistics for this reason.
Informal and subsistence work
Employment counts people in paid work and self-employment, including work outside formal employment relationships. High employment can therefore coexist with vulnerable or precarious work.
Agriculture and sector structure
Countries with a large agricultural workforce may record broad participation in family farming or self-employment even when productivity and earnings are low.
Education and youth transitions
Longer participation in education can lower the employed share of younger adults, while early school-to-work transitions can raise it.
Retirement and social protection
Pension coverage, retirement age and income support affect whether older people remain in employment. These factors matter because the denominator has no upper age limit.
Care responsibilities and gender gaps
Unpaid care can keep people outside the labour force and reduce the overall ratio even when labour demand is strong.
Key findings from the Top 100
Qatar leads by 3.8 percentage points
Qatar’s 86.9% result is 3.8 percentage points above Solomon Islands and 4.0 points above Madagascar.
The median employment ratio is 62.7%
The mean is 64.9% and the median is 62.7%. Nicaragua ranks 50th at 62.7%, while Bhutan ranks 51st at the same displayed value.
Sub-Saharan Africa has 26 entries
Sub-Saharan Africa contributes 26 entries, followed by Europe and Central Asia with 24 and Latin America & the Caribbean with 19.
The Top 100 cutoff is 56.6%
Mongolia ranks 100th at 56.6%, setting the inclusion threshold for this table.
How to interpret the ranking
Use the table to compare the employed share of the population aged 15 and older within one internationally harmonized series. A high ratio shows broad employment participation, while job quality and earnings require separate indicators.
For a fuller assessment, compare the ratio with unemployment, labour-force participation, hours worked, earnings, informality, vulnerable employment, productivity and social-protection indicators. National survey releases remain important when a country-specific current estimate is needed.
Frequently asked questions
Which country ranks first?
Qatar ranks first at 86.9% in the 2025 value disseminated through World Bank WDI from the ILOEST series.
Are these 2026 employment rates?
No. The page is a 2026 publication snapshot using 2025 observations. The page does not calculate a separate 2026 forecast.
Are the values direct national survey results?
Not necessarily. ILOEST combines nationally reported observations with harmonized and imputed estimates to create internationally comparable country series.
Why can the ILO value differ from a national statistics office?
The ILO may apply international definitions, a common population benchmark, age adjustments, normalization and break corrections. National releases may use another age range, survey period or revision schedule.
Is employment rate the opposite of unemployment rate?
No. This ratio uses the full population aged 15 and older as its denominator. The unemployment rate uses the labour force.
What does the metric not measure?
It does not measure wages, working hours, productivity, job security, informality or living standards.
Sources
World Bank indicator and numeric series
Primary source for every ranked value, the indicator code, unit, observation years and the World Bank metadata date for access to ILOEST.
ILO indicator definition
Defines the employment-to-population ratio and the employment categories included in the numerator.
ILOEST methodology and revisions
Explains reported and imputed observations, econometric modelling, uncertainty, harmonization and revision of historical estimates.
Geography and interpretation references
World Bank regional classifications support the region filter. ILO and World Bank topic pages support the interpretation of migration, informality, agriculture, education, pensions and care responsibilities; they do not replace the numeric ranking source.
Related rankings
More StatRanker pages connected by topic, category or ranking theme.
Meat Consumption per Capita by Country 2026: FAOSTAT Food Balance Snapshot
Open rankingTomato Production by Country 2026: Official FAOSTAT 2024 Ranking
Open rankingApple Production by Country 2026: Official FAOSTAT 2024 Ranking
Open rankingSugarcane Production by Country 2026: Official FAOSTAT 2024 Ranking
Open ranking
StatRanker (Website)
administrator
