

Top 100 Countries by Tertiary Education Enrollment, 2026
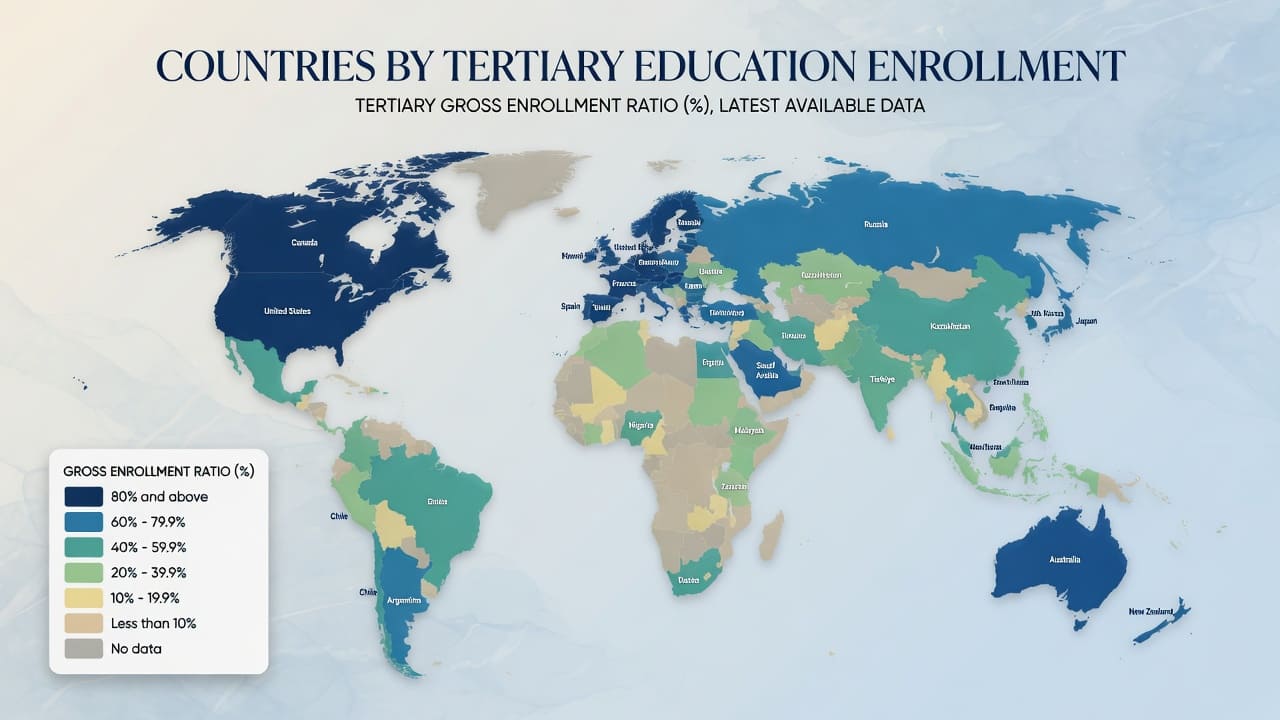
Participation in Tertiary Education Across 100 Countries
Greece leads with a gross tertiary enrollment ratio of 165.11%. The indicator compares all students enrolled in tertiary education with the population in the five-year age group immediately following upper secondary education.
The ratio can exceed 100% because students outside the reference age group are included. It measures participation, not the number of students and not education quality.
This 2026 update uses each country’s newest available value from 2021–2025 in the World Bank file released on July 1, 2026. UNESCO Institute for Statistics is the underlying data publisher, and World Bank WDI distributes the series.
Continue exploring
More StatRanker rankings on education outcomes, students and learning benchmarks.
Coverage: 100 sovereign countries plus Palestine where applicable. Unit: percent. Higher values rank higher. No values were projected to 2026.
Greece, 2023.
India, 2025.
Calculated from the 100 ranked values.
55 rows use 2024, 29 use 2023, 8 use 2025, 6 use 2022 and 2 use 2021.
What the Gross Tertiary Enrollment Ratio Measures
The indicator covers ISCED levels 5–8: short-cycle tertiary education, bachelor’s or equivalent programs, master’s or equivalent programs, and doctoral or equivalent programs. It divides total tertiary enrollment at all ages by the population in the five-year age group that follows upper secondary education, then multiplies by 100.
A value of 80% does not mean that 80% of the entire population is studying at a university. A value above 100% means that enrollment across all ages is larger than the narrower reference-age population used in the denominator.
The measure is useful for comparing participation but does not directly measure completion, educational attainment, teaching quality, affordability, research performance or graduate employment.
Ten Highest Gross Tertiary Enrollment Ratios
The leading values reflect broad participation across different ages and study pathways. They should not be interpreted as a ranking of university quality.
- 1Greece165.11%
- 2Cyprus120.88%
- 3Korea, Rep.111.85%
- 4Finland110.30%
- 5Chile110.18%
- 6Australia108.42%
- 7Argentina107.82%
- 8Turkiye105.89%
- 9Singapore97.29%
- 10Norway95.50%
Ranks use full-precision values; displayed ratios are rounded to two decimal places.
Top 20 Gross Tertiary Enrollment Ratios
Greece is a clear outlier, while the remaining leaders form a tighter group. Fourteen of the Top 20 entries are in Europe and Central Asia.
Why Gross Enrollment Ratios Differ Between Countries
Student age patterns
Adult learners, delayed entry, early entry and people returning to education increase enrollment without changing the five-year reference population.
Program length
Longer programs and students remaining enrolled for additional years can lift the ratio. The indicator does not fully adjust for differences in program duration.
International student flows
Students arriving from abroad are counted in enrollment, while the denominator is based on the resident reference-age population.
Reporting schedules
National reporting calendars, institutional coverage and data revisions differ. Small rank gaps deserve caution when observation years are not identical.
Explaining one country’s position requires additional evidence on student age, mobility, program duration and completion.
Method Used for the 2026 Ranking
Metric and direction
World Bank indicator SE.TER.ENRR, sourced from UNESCO UIS. Unit: percent. Higher values receive higher ranks.
Data update and observation years
The World Bank file was updated on July 1, 2026. For each country, the newest non-missing value from 2021–2025 was selected.
Country coverage
Sovereign countries and Palestine are eligible. Territories, regional aggregates and income-group aggregates are excluded.
Ranking and rounding
Countries are sorted by the full numeric value before display rounding. Regions are used only for filtering and do not affect rank.
Formula: total enrollment in tertiary education at ISCED levels 5–8, regardless of age, divided by the population in the five-year age group immediately following upper secondary education, multiplied by 100.
The World Bank spreadsheet provides country values but not separate UIS reporting flags for each row. The table therefore presents the values and years as distributed in WDI without adding a more specific reported, estimated or imputed classification.
Limitations: the metric does not standardize program duration across countries and should not be read as a measure of quality, completion or attainment.
Full Ranking of 100 Countries
Search for a country, select a region or change the display order.
Gross tertiary enrollment ratio, percent
| Rank | Country | Ratio | Year / region |
|---|---|---|---|
| 1 | Greece | 165.11% | 2023 · Europe & Central Asia |
| 2 | Cyprus | 120.88% | 2024 · Europe & Central Asia |
| 3 | Korea, Rep. | 111.85% | 2024 · East Asia & Pacific |
| 4 | Finland | 110.30% | 2024 · Europe & Central Asia |
| 5 | Chile | 110.18% | 2024 · Latin America & Caribbean |
| 6 | Australia | 108.42% | 2024 · East Asia & Pacific |
| 7 | Argentina | 107.82% | 2023 · Latin America & Caribbean |
| 8 | Turkiye | 105.89% | 2023 · Europe & Central Asia |
| 9 | Singapore | 97.29% | 2023 · East Asia & Pacific |
| 10 | Norway | 95.50% | 2024 · Europe & Central Asia |
| 11 | Spain | 93.77% | 2024 · Europe & Central Asia |
| 12 | Austria | 92.61% | 2024 · Europe & Central Asia |
| 13 | Georgia | 89.49% | 2025 · Europe & Central Asia |
| 14 | Ukraine | 87.19% | 2024 · Europe & Central Asia |
| 15 | Netherlands | 86.59% | 2023 · Europe & Central Asia |
| 16 | Albania | 84.15% | 2024 · Europe & Central Asia |
| 17 | Sweden | 84.00% | 2024 · Europe & Central Asia |
| 18 | Saudi Arabia | 83.88% | 2024 · Middle East & North Africa |
| 19 | Latvia | 82.92% | 2024 · Europe & Central Asia |
| 20 | Belgium | 82.15% | 2023 · Europe & Central Asia |
| 21 | Croatia | 81.18% | 2023 · Europe & Central Asia |
| 22 | Poland | 80.91% | 2024 · Europe & Central Asia |
| 23 | Malta | 80.53% | 2023 · Middle East & North Africa |
| 24 | United Kingdom | 80.41% | 2023 · Europe & Central Asia |
| 25 | Slovenia | 80.08% | 2023 · Europe & Central Asia |
| 26 | Uruguay | 79.95% | 2023 · Latin America & Caribbean |
| 27 | United States | 79.36% | 2022 · North America |
| 28 | Denmark | 78.96% | 2024 · Europe & Central Asia |
| 29 | Portugal | 77.68% | 2023 · Europe & Central Asia |
| 30 | Ireland | 77.59% | 2022 · Europe & Central Asia |
| 31 | Monaco | 77.48% | 2024 · Europe & Central Asia |
| 32 | New Zealand | 77.24% | 2024 · East Asia & Pacific |
| 33 | China | 76.88% | 2024 · East Asia & Pacific |
| 34 | Germany | 76.71% | 2024 · Europe & Central Asia |
| 35 | Iceland | 76.52% | 2023 · Europe & Central Asia |
| 36 | Canada | 76.27% | 2023 · North America |
| 37 | Italy | 75.95% | 2023 · Europe & Central Asia |
| 38 | Lithuania | 75.62% | 2024 · Europe & Central Asia |
| 39 | Fiji | 75.01% | 2024 · East Asia & Pacific |
| 40 | Moldova | 74.71% | 2024 · Europe & Central Asia |
| 41 | Switzerland | 73.54% | 2024 · Europe & Central Asia |
| 42 | Palau | 71.84% | 2024 · East Asia & Pacific |
| 43 | France | 71.53% | 2024 · Europe & Central Asia |
| 44 | Serbia | 70.58% | 2024 · Europe & Central Asia |
| 45 | Belarus | 70.11% | 2024 · Europe & Central Asia |
| 46 | Brazil | 69.73% | 2024 · Latin America & Caribbean |
| 47 | Bulgaria | 69.55% | 2024 · Europe & Central Asia |
| 48 | Mongolia | 69.04% | 2024 · East Asia & Pacific |
| 49 | Ecuador | 67.89% | 2023 · Latin America & Caribbean |
| 50 | Andorra | 67.68% | 2024 · Europe & Central Asia |
| 51 | Czechia | 66.73% | 2023 · Europe & Central Asia |
| 52 | Estonia | 65.67% | 2024 · Europe & Central Asia |
| 53 | Japan | 64.49% | 2023 · East Asia & Pacific |
| 54 | United Arab Emirates | 63.74% | 2024 · Middle East & North Africa |
| 55 | Hungary | 60.52% | 2024 · Europe & Central Asia |
| 56 | Russian Federation | 60.39% | 2024 · Europe & Central Asia |
| 57 | Uzbekistan | 59.81% | 2025 · Europe & Central Asia |
| 58 | Colombia | 59.29% | 2022 · Latin America & Caribbean |
| 59 | Iran, Islamic Rep. | 58.68% | 2022 · Middle East & North Africa |
| 60 | Bahrain | 58.37% | 2024 · Middle East & North Africa |
| 61 | Dominican Republic | 57.65% | 2024 · Latin America & Caribbean |
| 62 | San Marino | 57.55% | 2024 · Europe & Central Asia |
| 63 | Israel | 56.26% | 2024 · Middle East & North Africa |
| 64 | Montenegro | 55.17% | 2023 · Europe & Central Asia |
| 65 | Romania | 55.17% | 2023 · Europe & Central Asia |
| 66 | North Macedonia | 55.01% | 2023 · Europe & Central Asia |
| 67 | Slovak Republic | 54.47% | 2024 · Europe & Central Asia |
| 68 | Algeria | 54.43% | 2024 · Middle East & North Africa |
| 69 | Lebanon | 54.40% | 2023 · Middle East & North Africa |
| 70 | Kyrgyz Republic | 53.88% | 2025 · Europe & Central Asia |
| 71 | Panama | 53.69% | 2023 · Latin America & Caribbean |
| 72 | Kazakhstan | 52.86% | 2025 · Europe & Central Asia |
| 73 | Armenia | 52.77% | 2024 · Europe & Central Asia |
| 74 | Kuwait | 51.90% | 2021 · Middle East & North Africa |
| 75 | Barbados | 50.80% | 2025 · Latin America & Caribbean |
| 76 | Thailand | 49.08% | 2025 · East Asia & Pacific |
| 77 | Maldives | 48.50% | 2022 · South Asia |
| 78 | Mexico | 48.20% | 2024 · Latin America & Caribbean |
| 79 | Morocco | 48.18% | 2024 · Middle East & North Africa |
| 80 | Philippines | 47.41% | 2024 · East Asia & Pacific |
| 81 | Liechtenstein | 46.02% | 2021 · Europe & Central Asia |
| 82 | Mauritius | 45.78% | 2024 · Sub-Saharan Africa |
| 83 | Bosnia and Herzegovina | 45.50% | 2023 · Europe & Central Asia |
| 84 | Indonesia | 44.88% | 2023 · East Asia & Pacific |
| 85 | Palestine | 44.49% | 2023 · Middle East & North Africa |
| 86 | Cuba | 43.10% | 2024 · Latin America & Caribbean |
| 87 | Qatar | 43.02% | 2024 · Middle East & North Africa |
| 88 | Tonga | 42.86% | 2023 · East Asia & Pacific |
| 89 | Oman | 42.23% | 2024 · Middle East & North Africa |
| 90 | St. Vincent and the Grenadines | 41.50% | 2022 · Latin America & Caribbean |
| 91 | Azerbaijan | 41.34% | 2024 · Europe & Central Asia |
| 92 | Malaysia | 38.50% | 2024 · East Asia & Pacific |
| 93 | Tunisia | 38.12% | 2023 · Middle East & North Africa |
| 94 | Egypt, Arab Rep. | 38.04% | 2025 · Middle East & North Africa |
| 95 | Marshall Islands | 37.69% | 2024 · East Asia & Pacific |
| 96 | Viet Nam | 37.59% | 2024 · East Asia & Pacific |
| 97 | Brunei Darussalam | 36.42% | 2023 · East Asia & Pacific |
| 98 | Jordan | 35.92% | 2024 · Middle East & North Africa |
| 99 | Tajikistan | 35.64% | 2024 · Europe & Central Asia |
| 100 | India | 34.45% | 2025 · South Asia |
Patterns in the Top 100
Greece is the largest outlier
Greece stands 44.24 percentage points above Cyprus, the largest gap at the top of the table.
Eight ratios exceed 100%
Greece, Cyprus, Korea, Finland, Chile, Australia, Argentina and Türkiye all exceed 100% because enrollment includes students outside the reference age group.
Europe is strongly represented
Fifty-one entries are in Europe and Central Asia, including 14 of the Top 20. This is a count of ranked countries, not a regional enrollment rate.
Several countries use 2025 data
Georgia ranks 13th with 89.49%. The other 2025 entries are Uzbekistan, Kyrgyz Republic, Kazakhstan, Barbados, Thailand, Egypt and India.
How to Interpret a Country’s Position
A higher rank means a larger participation ratio, not a better tertiary education system. High values may reflect broad access, adult learning, longer study duration, repeat enrollment, international students or a relatively small reference-age population.
For a fuller comparison, use this indicator alongside attainment, completion rates, expenditure per student, equity measures and labor-market outcomes.
Small differences between neighboring countries should not be treated as proof of a meaningful current gap, particularly when their observation years differ.
Questions About Gross Tertiary Enrollment
Which country has the highest ratio?
Greece ranks first at 165.11%, using its 2023 value.
Are these values for 2026?
No. The page is a 2026 update based on the newest country values available from 2021–2025. No country value was projected forward.
Why can the ratio exceed 100%?
The numerator counts tertiary students of all ages, while the denominator contains only a five-year reference-age population.
Is this the share of adults with a university degree?
No. That is an attainment measure. Gross enrollment measures current participation.
Why do observation years differ?
National reporting schedules and international processing timelines vary. The year is shown for every country.
Does a higher rank mean better education quality?
No. The indicator does not directly measure teaching quality, completion, research, affordability or graduate employment.
How is Palestine labeled?
The table uses “Palestine” for World Bank economy code PSE, which is listed by the World Bank as “West Bank and Gaza.”
Data and Method Sources
World Bank indicator page
Indicator definition, source attribution and country series.
World Bank data file
Country values and years used in the ranking.
UNESCO UIS data resources
Primary publisher’s data archive and documentation.
UNESCO indicator metadata
Formula, interpretation and limitations.
Related rankings
More StatRanker rankings on education outcomes, students and learning benchmarks.
Average HO-3 Homeowners Insurance Premium by State (2026 Snapshot)
Open rankingMeat Consumption per Capita by Country 2026: FAOSTAT Food Balance Snapshot
Open rankingTomato Production by Country 2026: Official FAOSTAT 2024 Ranking
Open rankingApple Production by Country 2026: Official FAOSTAT 2024 Ranking
Open ranking
StatRanker (Website)
administrator
