

Top 100 Countries by Fixed Broadband Subscriptions per 100 People
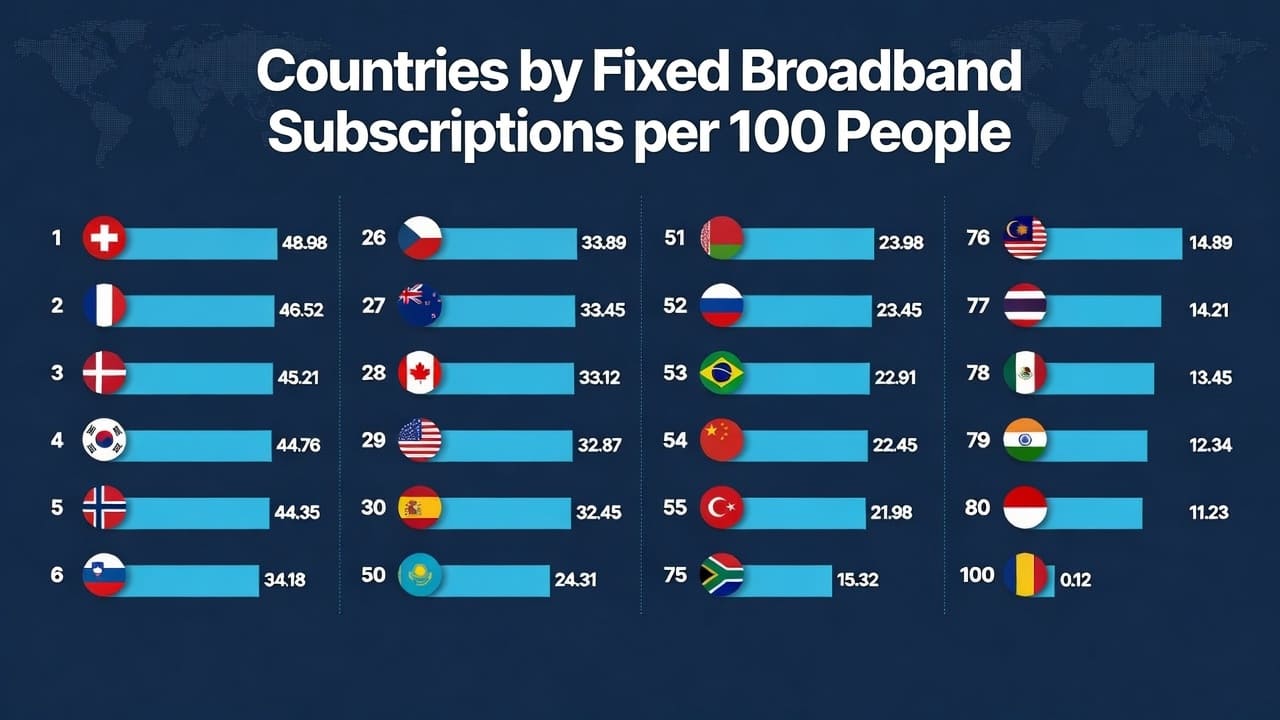
Countries with the highest fixed-line broadband penetration
This ranking compares fixed broadband connections relative to population using World Bank indicator IT.NET.BBND.P2, sourced from the International Telecommunication Union.
The table covers United Nations member states and the State of Palestine with a reported value for 2024. World Bank aggregates, dependent territories and special administrative regions are not included.
Unit: subscriptions per 100 people. Higher values rank higher. Coverage: 100 countries. Source accessed July 11, 2026.
Monaco ranks first in the 2024 comparison.
Half of the ranked countries are above this value and half are below it.
The gap between Monaco and Morocco.
All entries use data for the same reference year.
What this broadband indicator measures
The indicator counts fixed subscriptions to high-speed public Internet access and divides the total by population. Included technologies cover cable modem, DSL, fiber, satellite broadband and terrestrial fixed wireless connections. The ITU definition uses a downstream threshold of at least 256 kbit/s.
The result is not the percentage of people online or the share of households with broadband. A household connection can serve several people, while a business or public institution can hold several lines.
Mobile-cellular broadband is excluded. The measure is useful for comparing fixed-line adoption, but it does not describe connection speed, affordability, reliability, fiber coverage or rural access.
Top 10 countries by fixed broadband penetration
Monaco, Andorra and Liechtenstein occupy the first three positions. France is the highest-ranked large European economy, while Korea and China are the two East Asian countries in the first ten.
Top 10 countries, subscriptions per 100 people, 2024
| Rank | Country | Per 100 | World Bank region |
|---|---|---|---|
| 1 | Monaco | 55.68 | Europe & Central Asia |
| 2 | Andorra | 52.36 | Europe & Central Asia |
| 3 | Liechtenstein | 50.01 | Europe & Central Asia |
| 4 | France | 48.93 | Europe & Central Asia |
| 5 | Korea, Rep. | 47.80 | East Asia & Pacific |
| 6 | China | 47.19 | East Asia & Pacific |
| 7 | Switzerland | 47.02 | Europe & Central Asia |
| 8 | Germany | 45.61 | Europe & Central Asia |
| 9 | Portugal | 45.24 | Europe & Central Asia |
| 10 | Norway | 45.16 | Europe & Central Asia |
Ranks are based on the unrounded values. Display values are rounded to two decimal places.
Top 20 countries in the 2024 data
Bar length is scaled to Monaco, which has the highest value. Sweden is twentieth with 40.62 subscriptions per 100 people.
Methodology and coverage
Countries included
The ranking covers the 193 United Nations member states and the State of Palestine where a 2024 value is available.
Ranking method
Countries are ordered from the highest value to the lowest. Ranks use the original figures before rounding.
Source and unit
The figures come from World Bank WDI indicator IT.NET.BBND.P2, sourced from ITU. The unit is subscriptions per 100 people.
Regions
Regional labels follow the World Bank categories attached to each country in the dataset.
Territories and other reporting entities
World Bank aggregates, dependent territories, special administrative regions and Kosovo are outside the scope of this ranking.
See examples of excluded reporting entities
Examples include American Samoa, Aruba, Bermuda, British Virgin Islands, Cayman Islands, Curaçao, Faroe Islands, French Polynesia, Gibraltar, Greenland, Guam, Hong Kong SAR, China, Macao SAR, China, New Caledonia, Puerto Rico, Turks and Caicos Islands and the U.S. Virgin Islands.
Malta appears under Middle East & North Africa because the table retains the World Bank regional category attached to the country in the dataset.
Differences in national reporting can affect comparisons, particularly for fixed wireless, satellite, organizational accounts and multiple connections held by one subscriber.
Full ranking of 100 countries
Use the search and region filter to narrow the table. Top 10 and Top 20 show the highest values within the current selection.
Showing 100 countries
Fixed broadband connections per 100 people, 2024
| Rank | Country | Per 100 | World Bank region |
|---|---|---|---|
| 1 | Monaco | 55.68 | Europe & Central Asia |
| 2 | Andorra | 52.36 | Europe & Central Asia |
| 3 | Liechtenstein | 50.01 | Europe & Central Asia |
| 4 | France | 48.93 | Europe & Central Asia |
| 5 | Korea, Rep. | 47.80 | East Asia & Pacific |
| 6 | China | 47.19 | East Asia & Pacific |
| 7 | Switzerland | 47.02 | Europe & Central Asia |
| 8 | Germany | 45.61 | Europe & Central Asia |
| 9 | Portugal | 45.24 | Europe & Central Asia |
| 10 | Norway | 45.16 | Europe & Central Asia |
| 11 | Greece | 44.68 | Europe & Central Asia |
| 12 | Malta | 44.51 | Middle East & North Africa |
| 13 | Belgium | 44.23 | Europe & Central Asia |
| 14 | Saudi Arabia | 44.07 | Middle East & North Africa |
| 15 | Denmark | 43.39 | Europe & Central Asia |
| 16 | Netherlands | 42.98 | Europe & Central Asia |
| 17 | Canada | 42.52 | North America |
| 18 | United Kingdom | 42.16 | Europe & Central Asia |
| 19 | United Arab Emirates | 40.84 | Middle East & North Africa |
| 20 | Sweden | 40.62 | Europe & Central Asia |
| 21 | Luxembourg | 40.32 | Europe & Central Asia |
| 22 | Spain | 39.23 | Europe & Central Asia |
| 23 | Czechia | 38.87 | Europe & Central Asia |
| 24 | United States | 38.86 | North America |
| 25 | New Zealand | 38.05 | East Asia & Pacific |
| 26 | Cyprus | 37.56 | Europe & Central Asia |
| 27 | Hungary | 37.54 | Europe & Central Asia |
| 28 | Iceland | 37.52 | Europe & Central Asia |
| 29 | Australia | 36.48 | East Asia & Pacific |
| 30 | Finland | 36.48 | Europe & Central Asia |
| 31 | Belarus | 36.26 | Europe & Central Asia |
| 32 | Romania | 35.80 | Europe & Central Asia |
| 33 | Estonia | 35.35 | Europe & Central Asia |
| 34 | Uzbekistan | 34.74 | Europe & Central Asia |
| 35 | Slovenia | 34.23 | Europe & Central Asia |
| 36 | Slovak Republic | 33.81 | Europe & Central Asia |
| 37 | Serbia | 33.37 | Europe & Central Asia |
| 38 | Uruguay | 33.04 | Latin America & Caribbean |
| 39 | Montenegro | 32.31 | Europe & Central Asia |
| 40 | Ireland | 32.30 | Europe & Central Asia |
| 41 | Italy | 31.78 | Europe & Central Asia |
| 42 | Seychelles | 31.60 | Sub-Saharan Africa |
| 43 | Georgia | 30.42 | Europe & Central Asia |
| 44 | Austria | 30.13 | Europe & Central Asia |
| 45 | North Macedonia | 29.89 | Europe & Central Asia |
| 46 | Moldova | 29.63 | Europe & Central Asia |
| 47 | Croatia | 29.60 | Europe & Central Asia |
| 48 | St. Vincent and the Grenadines | 29.46 | Latin America & Caribbean |
| 49 | Bosnia and Herzegovina | 29.39 | Europe & Central Asia |
| 50 | Israel | 29.18 | Middle East & North Africa |
| 51 | Mauritius | 27.97 | Sub-Saharan Africa |
| 52 | Lithuania | 27.85 | Europe & Central Asia |
| 53 | Singapore | 27.81 | East Asia & Pacific |
| 54 | Russian Federation | 27.13 | Europe & Central Asia |
| 55 | Trinidad and Tobago | 27.03 | Latin America & Caribbean |
| 56 | Argentina | 26.10 | Latin America & Caribbean |
| 57 | Latvia | 25.75 | Europe & Central Asia |
| 58 | Poland | 25.36 | Europe & Central Asia |
| 59 | Bahamas, The | 25.27 | Latin America & Caribbean |
| 60 | Albania | 24.88 | Europe & Central Asia |
| 61 | Brazil | 24.08 | Latin America & Caribbean |
| 62 | Chile | 23.73 | Latin America & Caribbean |
| 63 | Viet Nam | 23.71 | East Asia & Pacific |
| 64 | Turkiye | 23.43 | Europe & Central Asia |
| 65 | Costa Rica | 23.29 | Latin America & Caribbean |
| 66 | Azerbaijan | 21.75 | Europe & Central Asia |
| 67 | Mexico | 21.74 | Latin America & Caribbean |
| 68 | Ukraine | 21.65 | Europe & Central Asia |
| 69 | Brunei Darussalam | 21.18 | East Asia & Pacific |
| 70 | Armenia | 20.31 | Europe & Central Asia |
| 71 | Maldives | 19.65 | South Asia |
| 72 | Suriname | 18.75 | Latin America & Caribbean |
| 73 | Iraq | 17.63 | Middle East & North Africa |
| 74 | Ecuador | 17.25 | Latin America & Caribbean |
| 75 | Colombia | 17.22 | Latin America & Caribbean |
| 76 | Bahrain | 16.99 | Middle East & North Africa |
| 77 | Jamaica | 15.98 | Latin America & Caribbean |
| 78 | Mongolia | 15.78 | East Asia & Pacific |
| 79 | Kazakhstan | 15.32 | Europe & Central Asia |
| 80 | Tunisia | 14.97 | Middle East & North Africa |
| 81 | Thailand | 14.89 | East Asia & Pacific |
| 82 | Malaysia | 13.55 | East Asia & Pacific |
| 83 | Algeria | 13.32 | Middle East & North Africa |
| 84 | Venezuela, RB | 12.94 | Latin America & Caribbean |
| 85 | El Salvador | 12.46 | Latin America & Caribbean |
| 86 | Bolivia | 12.07 | Latin America & Caribbean |
| 87 | Iran, Islamic Rep. | 12.06 | Middle East & North Africa |
| 88 | Qatar | 11.82 | Middle East & North Africa |
| 89 | Egypt, Arab Rep. | 11.69 | Middle East & North Africa |
| 90 | Peru | 11.68 | Latin America & Caribbean |
| 91 | Dominican Republic | 11.20 | Latin America & Caribbean |
| 92 | Oman | 11.06 | Middle East & North Africa |
| 93 | Nepal | 10.07 | South Asia |
| 94 | Sri Lanka | 8.47 | South Asia |
| 95 | Cabo Verde | 8.31 | Sub-Saharan Africa |
| 96 | West Bank and Gaza | 8.16 | Middle East & North Africa |
| 97 | Bangladesh | 8.09 | South Asia |
| 98 | Kyrgyz Republic | 7.80 | Europe & Central Asia |
| 99 | Botswana | 7.44 | Sub-Saharan Africa |
| 100 | Morocco | 7.30 | Middle East & North Africa |
Key findings from the ranking
Monaco is 27.10 points above the median
Monaco records 55.68 subscriptions per 100 people, compared with a median of 28.58 across the 100 countries.
Europe & Central Asia contributes 48 entries
The region accounts for nearly half of the table and has a median of 35.05 among the countries included.
Korea and China are both in the global Top 10
Korea ranks fifth at 47.80, while China ranks sixth at 47.19 subscriptions per 100 people.
Canada leads North America
Canada ranks seventeenth at 42.52, ahead of the United States in twenty-fourth place at 38.86.
Why broadband penetration differs between countries
Network history and competition
Countries with long-established cable, DSL or fiber networks often have more fixed connections. Competition between providers can also expand coverage and lower entry prices.
Mobile substitution
In mobile-first markets, households may rely on 4G or 5G rather than paying for a fixed line. This can produce a lower fixed-broadband value even when many people use the Internet.
Urban form and geography
Dense cities are generally cheaper to connect than remote settlements, islands or sparsely populated rural areas. Terrain and distance affect deployment costs.
Household and business demand
Larger households may share one connection among more people, while business hubs can record many organizational subscriptions.
Income and affordability
Household income, installation charges, monthly prices and device ownership influence whether a fixed connection is practical.
National reporting practices
Regulators may differ in how they classify fixed wireless, satellite, inactive lines and organizational accounts.
What a high ranking tells us
A high position indicates that a country has many fixed broadband connections relative to its population. It often reflects mature household connectivity, strong business demand, compact settlement patterns or long-established cable and fiber networks.
The ranking is best used to compare the prevalence of fixed connections in 2024. It should not be treated as a complete measure of digital development because countries can rely heavily on mobile networks and still have broad Internet access.
Download the Top 100 Countries by Fixed Broadband Subscriptions per 100 People dataset
Top 100 Countries by Fixed Broadband Subscriptions per 100 People
100 ranked entries · Excel + CSV + methodology + sources + chart · Snapshot: 2024 World Bank WDI / ITU fixed broadband · Version 1.0
The archive includes machine-readable data, methodology and source documentation. Quick human verification is required before the ZIP is delivered. Full Data Pack downloads require a free account. Free accounts can download 1 different Data Pack every 30 days; re-downloading the same pack does not use another slot. Annual Data Access provides unlimited manual downloads while annual access is active.
Download Excel + CSV Data PackFrequently asked questions
Which country ranks first?
Monaco ranks first with 55.68 fixed broadband subscriptions per 100 people in 2024.
Are these 2026 values?
No. This page is a 2026 snapshot based on World Bank and ITU data for 2024.
Why are some territories missing?
The ranking covers United Nations member states and the State of Palestine. Dependent territories, special administrative regions, Kosovo and World Bank aggregates are outside this scope.
Does one subscription represent one person?
No. One household connection can serve several people, while a business or institution can hold several subscriptions.
Does the indicator include mobile broadband?
No. The indicator covers fixed wired and fixed wireless access and excludes mobile-cellular broadband.
Does a higher value always mean better Internet?
No. The measure does not show speed, price, reliability, fiber availability, rural coverage or service quality.
Why can the value exceed 50 per 100 people?
The total includes household and organizational subscriptions, and one subscriber can hold more than one connection.
Sources
World Bank indicator IT.NET.BBND.P2
Country values, reference years and the World Bank presentation of the ITU series.
International Telecommunication Union DataHub
Indicator definition, technology coverage and international data context.
World Bank indicator metadata
Calculation basis, included technologies and exclusions.
United Nations member states
Reference list for the countries covered by the ranking.
Related rankings
Closely related StatRanker ranking and data pages selected by topic, entity scope and category. Fewer links are shown when strong matches are limited.
