

US Cities by Job Growth, 2026
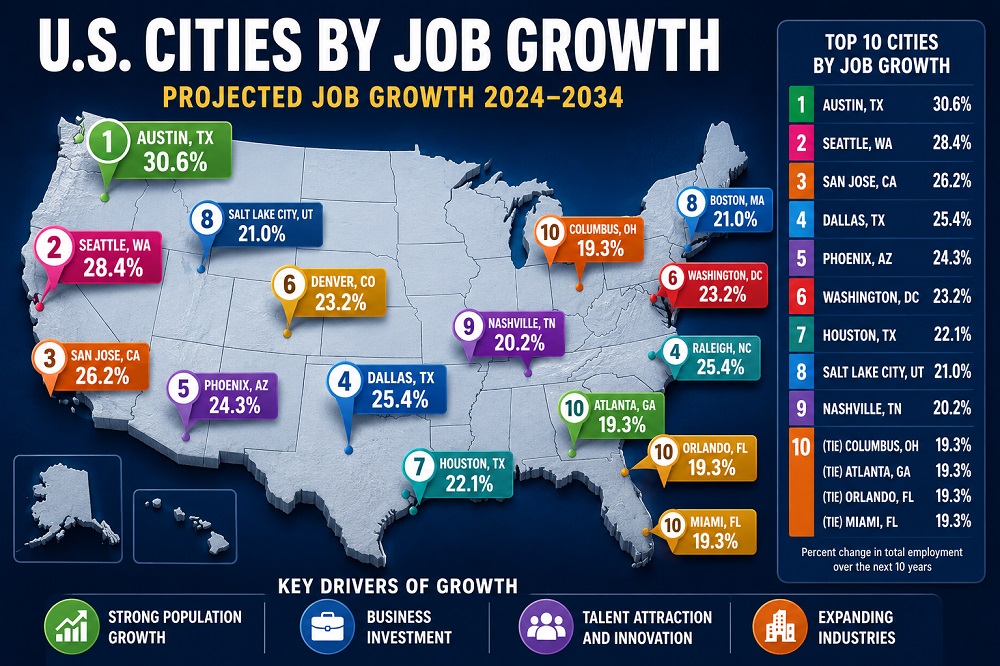
US Cities by Job Growth, 2026: Published BLS Metro Payroll Estimate Snapshot
This ranking compares U.S. metropolitan areas by published BLS over-the-year percent-change estimates for total nonfarm payroll employment. The snapshot compares April 2026 with April 2025, uses not seasonally adjusted BLS metro payroll data, and ranks positive published estimates from highest to lowest. The measured geography is metropolitan areas, not city-limit municipalities.
The source type is single official source: U.S. Bureau of Labor Statistics, Metropolitan Area Employment and Unemployment. The coverage is 20 positive published BLS payroll-change estimates. Unit is percent change, direction is descending, and all rows are official_value rows; there are no official_forecast or modeled_projection rows.
Important interpretation note: this is not a list of 20 statistically confirmed metro employment increases. In the April 2026 release, BLS reported over-the-year nonfarm payroll employment increases in 4 metropolitan areas, decreases in 4 areas, and essentially unchanged employment in 379 areas. This page ranks published positive estimates from the supplemental BLS table and marks the distinction in the methodology.
+4.1% total nonfarm payroll estimate, equal to +3.7 thousand jobs from April 2025 to April 2026.
The lowest listed positive estimate is +1.7%, shared by Fresno, Baton Rouge, Fort Collins-Loveland and Myrtle Beach.
Official BLS observed percent-change estimates for April 2026 versus April 2025.
20 official_value rows; 0 forecasts; 0 projections. BLS release summary identified 4 metro employment increases.
Overview
The indicator shows the published BLS over-the-year percent-change estimate in metro-area total nonfarm payroll employment. A higher value means the published estimate is higher relative to April 2025, but it does not automatically mean BLS classified the metro as a statistically significant employment increase.
The upper part of the snapshot includes smaller tourism and coastal markets, regional service hubs, and larger Sun Belt metros with stronger absolute payroll gains. Barnstable Town has the highest published percentage estimate, while Las Vegas has the largest absolute job gain among the 20 listed metros.
Top 10 positive published BLS payroll-change estimates
The Top 10 positive published estimates range from +4.1% in Barnstable Town to +2.3% in Athens-Clarke County. This table ranks the BLS percent-change estimates; it should not be read as a list of all statistically significant metro employment increases.
| Rank | Metro area | Value | Region / note |
|---|---|---|---|
| 1 | Barnstable Town, MA | +4.1% | Northeast; official_value; BLS; Apr 2025-Apr 2026; +3.7k jobs. |
| 2 | Merced, CA | +3.5% | West; official_value; BLS; Apr 2025-Apr 2026; +2.6k jobs. |
| 3 | Traverse City, MI | +3.4% | Midwest; official_value; BLS; Apr 2025-Apr 2026; +2.4k jobs. |
| 4 | Atlantic City-Hammonton, NJ | +3.0% | Northeast; official_value; BLS; Apr 2025-Apr 2026; +5.0k jobs. |
| 5 | Sandusky, OH | +3.0% | Midwest; official_value; BLS; Apr 2025-Apr 2026; +1.5k jobs. |
| 6 | Yuba City, CA | +2.7% | West; official_value; BLS; Apr 2025-Apr 2026; +1.4k jobs. |
| 7 | Lebanon, PA | +2.5% | Northeast; official_value; BLS; Apr 2025-Apr 2026; +1.4k jobs. |
| 8 | Fayetteville-Springdale-Rogers, AR | +2.4% | South; official_value; BLS; Apr 2025-Apr 2026; +7.2k jobs. |
| 9 | Wilmington, NC | +2.4% | South; official_value; BLS; Apr 2025-Apr 2026; +4.7k jobs. |
| 10 | Athens-Clarke County, GA | +2.3% | South; official_value; BLS; Apr 2025-Apr 2026; +2.4k jobs. |
Tie handling: rows are sorted by percent estimate first, then by absolute employment change in thousands, then by metro name.
Chart: Top 20 positive published BLS payroll-change estimates
The chart compares the 20 highest positive published BLS percent-change estimates in the ranking table. Barnstable Town stands out at +4.1%, while the lower end of the displayed group clusters at +1.7%. BLS statistical-significance language is handled separately in the methodology.
Methodology
The metric is the published over-the-year percent-change estimate in total nonfarm payroll employment for U.S. metropolitan areas. The value compares April 2026 with April 2025 and is reported in BLS not seasonally adjusted metro payroll tables. Direction is descending: higher positive published estimates rank higher.
The target year is 2026 because the current observation is April 2026. The base year is 2025 because each row compares with April 2025. The unit is percent change, with the official employment change in thousands shown as a supporting note. The values are official BLS observed estimates, not forecasts or modeled projections.
BLS reported statistically notable over-the-year nonfarm employment increases in only 4 metropolitan areas in April 2026: Las Vegas-Henderson-North Las Vegas, Raleigh-Cary, Barnstable Town and Merced. This ranking uses the published percent-change estimates from the BLS supplemental table and therefore includes positive estimates that BLS may classify as essentially unchanged.
Source hierarchy
Official source is used: U.S. Bureau of Labor Statistics, State and Metro Area Employment, Hours, and Earnings / Metropolitan Area Employment and Unemployment.
Inclusion rule
Rows are included where BLS publishes a positive metro-area percent-change estimate and employment-change value for April 2025 to April 2026. Inclusion does not mean BLS identified the row as a statistically significant metro employment increase.
Tie rule
Ranking is sorted by percent estimate first, then by employment change in thousands, then alphabetically by metro area name. The +1.7% group is ordered Fresno (+7.4k), Baton Rouge (+7.2k), Fort Collins-Loveland (+3.1k) and Myrtle Beach-Conway-North Myrtle Beach (+2.6k).
Projection rule
No modeled projections are used. Every listed value is an official BLS observed estimate for April 2026 compared with April 2025.
Missing values are excluded. Conflicts are not averaged because the ranking uses one official BLS release and its supplemental table. The table does not mix city-limit employment, county employment, labor-force employment, unemployment rates, private-sector-only jobs or seasonally adjusted series.
The metric does not measure job quality, wages, full-time versus part-time mix, industry composition, resident employment, unemployment, labor-force participation, cost of living or productivity. BLS notes that metro payroll data are counts of jobs by place of work and that estimates after the current benchmark are preliminary.
Main ranking table: Top 20 positive published BLS payroll-change estimates
The table is a single-source official dataset based on BLS metro-area payroll employment data. Use the controls to search by metro area, filter by region or status, and compare published percent-change estimates or absolute job gains. Statistical-significance interpretation comes from the BLS release summary, not from rank alone.
This dataset contains official_value rows only; no official_forecast or modeled_projection rows are included.
| Rank | Metro area | Value | Region / note |
|---|---|---|---|
| 1 | Barnstable Town, MA | +4.1%+3.7k jobs | Northeast; official_value; BLS SAE; April 2025-April 2026; target_year 2026. |
| 2 | Merced, CA | +3.5%+2.6k jobs | West; official_value; BLS SAE; April 2025-April 2026; target_year 2026. |
| 3 | Traverse City, MI | +3.4%+2.4k jobs | Midwest; official_value; BLS SAE; April 2025-April 2026; target_year 2026. |
| 4 | Atlantic City-Hammonton, NJ | +3.0%+5.0k jobs | Northeast; official_value; BLS SAE; April 2025-April 2026; target_year 2026. |
| 5 | Sandusky, OH | +3.0%+1.5k jobs | Midwest; official_value; BLS SAE; April 2025-April 2026; target_year 2026. |
| 6 | Yuba City, CA | +2.7%+1.4k jobs | West; official_value; BLS SAE; April 2025-April 2026; target_year 2026. |
| 7 | Lebanon, PA | +2.5%+1.4k jobs | Northeast; official_value; BLS SAE; April 2025-April 2026; target_year 2026. |
| 8 | Fayetteville-Springdale-Rogers, AR | +2.4%+7.2k jobs | South; official_value; BLS SAE; April 2025-April 2026; target_year 2026. |
| 9 | Wilmington, NC | +2.4%+4.7k jobs | South; official_value; BLS SAE; April 2025-April 2026; target_year 2026. |
| 10 | Athens-Clarke County, GA | +2.3%+2.4k jobs | South; official_value; BLS SAE; April 2025-April 2026; target_year 2026. |
| 11 | Las Vegas-Henderson-North Las Vegas, NV | +2.0%+23.6k jobs | West; official_value; BLS SAE; April 2025-April 2026; target_year 2026. |
| 12 | Raleigh-Cary, NC | +2.0%+15.4k jobs | South; official_value; BLS SAE; April 2025-April 2026; target_year 2026. |
| 13 | Napa, CA | +2.0%+1.5k jobs | West; official_value; BLS SAE; April 2025-April 2026; target_year 2026. |
| 14 | St. George, UT | +1.9%+1.7k jobs | West; official_value; BLS SAE; April 2025-April 2026; target_year 2026. |
| 15 | Reno, NV | +1.8%+5.2k jobs | West; official_value; BLS SAE; April 2025-April 2026; target_year 2026. |
| 16 | Redding, CA | +1.8%+1.3k jobs | West; official_value; BLS SAE; April 2025-April 2026; target_year 2026. |
| 17 | Fresno, CA | +1.7%+7.4k jobs | West; official_value; BLS SAE; April 2025-April 2026; target_year 2026. |
| 18 | Baton Rouge, LA | +1.7%+7.2k jobs | South; official_value; BLS SAE; April 2025-April 2026; target_year 2026. |
| 19 | Fort Collins-Loveland, CO | +1.7%+3.1k jobs | West; official_value; BLS SAE; April 2025-April 2026; target_year 2026. |
| 20 | Myrtle Beach-Conway-North Myrtle Beach, SC | +1.7%+2.6k jobs | South; official_value; BLS SAE; April 2025-April 2026; target_year 2026. |
Source snapshot: BLS Metropolitan Area Employment and Unemployment, April 2026 results, last modified June 3, 2026. Values are official observed estimates, not forecasts or projections. BLS release-summary significance language should be read separately from this positive-estimate ranking.
Insights
Key Insight
Barnstable Town has the highest published percentage estimate at +4.1%, but the BLS release summary identifies only four metro areas as over-the-year employment increases.
Notable Pattern
Rate-based rankings elevate smaller metro employment bases: Barnstable Town, Merced and Traverse City rank above much larger metros even though their absolute job gains are smaller.
Regional Concentration
The West has 9 of the 20 listed metros, the South has 6, the Northeast has 3 and the Midwest has 2.
Outlier
Las Vegas ranks 11th by published rate at +2.0%, but its +23.6 thousand job gain is the largest absolute increase inside this table and one of the four increases named in the BLS release summary.
The distribution shows why percent estimates, absolute job gains and BLS significance language must be read together. A metro can appear high in a positive-estimate table without being one of the areas that BLS highlighted as an over-the-year employment increase.
What It Means
For workers, a high published payroll-change estimate can indicate local hiring momentum, but it should not be treated as a stand-alone signal of a stronger labor market. Wage growth, unemployment, labor-force participation, housing costs and industry mix remain essential checks.
For employers and investors, the ranking is useful as a screening table for metro areas with positive BLS payroll estimates. It is not a statistical-significance table; the BLS release summary should be used to separate named over-the-year employment increases from estimates that may be essentially unchanged.
For public policy, the table helps identify where payroll estimates moved upward, but it does not show whether residents filled those jobs, whether gains were broad-based, or whether new positions were high-wage, full-time or resilient.
Download the US Cities by Job Growth, 2026 dataset
US Cities by Job Growth, 2026
20 ranked entries · Excel + CSV + methodology + sources + chart · Snapshot: 2026 BLS metropolitan employment growth snapshot · Version 1.0
The archive includes machine-readable data, methodology and source documentation. Quick human verification is required before the ZIP is delivered. Full Data Pack downloads require a free account. Free accounts can download 1 different Data Pack every 30 days; re-downloading the same pack does not use another slot. Annual Data Access provides unlimited manual downloads while annual access is active.
Download Excel + CSV Data PackFAQ
Which US metro area has the highest published payroll-change estimate in this 2026 snapshot?
Barnstable Town, MA ranks first in this positive published-estimate table, with total nonfarm payroll employment estimated at +4.1% from April 2025 to April 2026.
Does this mean all 20 listed metros had statistically confirmed job growth?
No. BLS reported over-the-year nonfarm payroll employment increases in 4 metropolitan areas in April 2026, with 379 areas essentially unchanged. This table ranks positive published BLS percent-change estimates, so it should be read together with the BLS release-summary language.
Is this ranking based on city limits?
No. The measured geography is the metropolitan area. A metropolitan area can include a central city plus surrounding counties or communities, so the figures should not be read as city-limit employment data.
What exactly is measured here?
The value is the published BLS over-the-year percent-change estimate in total nonfarm payroll employment. The supporting figure in each row shows the official employment change in thousands of jobs.
Why use April 2026 instead of a full-year 2026 value?
A full-year 2026 metro payroll dataset is not available yet. This page is a 2026 snapshot based on the latest available official BLS metro release at the time of compilation.
Are any rows forecasts or modeled projections?
No. Every row is marked official_value. No forecast, CAGR model, trend extrapolation or projection formula is used.
Does a high payroll-change estimate mean the local economy is stronger overall?
Not by itself. It shows a payroll estimate, but it does not measure wages, job quality, household income, affordability, unemployment, productivity or whether the change is concentrated in one sector.
Why do some smaller metros outrank larger metros?
The ranking is based on a percentage estimate. A smaller metro can rank highly with a smaller absolute gain because the increase is measured relative to its own employment base.
Sources
U.S. Bureau of Labor Statistics — Over-the-year change in total nonfarm employment for metropolitan areas
Main row-level source for the percent-change and employment-change values used in the ranking table.
U.S. Bureau of Labor Statistics — Metropolitan Area Employment and Unemployment Summary
Release-summary source for the distinction between published positive estimates and BLS-identified over-the-year metro employment increases.
U.S. Bureau of Labor Statistics — Metropolitan Area Employment and Unemployment
Release environment for the April 2026 metro labor-market tables and the June 3, 2026 update cycle.
U.S. Bureau of Labor Statistics — State and Metro Area Employment, Hours, and Earnings
Program source for payroll employment data by state and metropolitan area, including Current Employment Statistics concepts used in this table.
