

Top 100 Universities by Endowment Size, 2026
Top 100 U.S. higher-education endowment reporting entities by endowment size
University endowments are long-term investment pools built from gifts, reinvested returns and funds functioning as endowment. They help support financial aid, research, faculty chairs, libraries, laboratories and other academic priorities while preserving capital for future generations.
This corrected 2026 edition uses reported FY2025 endowment market values for U.S. private institutions, public institutions, public systems and institutionally related foundations. The ranking keeps the official reporting entity intact instead of reallocating system or foundation assets to individual campuses.
Endowment size is a financial-capacity indicator, not a quality ranking. A large fund does not automatically mean stronger teaching, better student outcomes or lower tuition, and many endowment dollars are legally restricted to donor-specified purposes.
Continue exploring
More StatRanker rankings on education outcomes, students and learning benchmarks.
Top 100 Universities by Student-to-Faculty Ratio, 2026
Open rankingTop 100 Countries by QS-Ranked Universities 2025.
Open rankingKey figures from the corrected FY2025 endowment snapshot
The top of the endowment distribution is highly concentrated. The ten largest reporting entities hold roughly $320.0 billion, equal to about 43.3% of the Top 100 total in this corrected table.
Harvard University ranks first by reported FY2025 endowment market value.
Combined reported endowment market value of the 100 ranked reporting entities.
The final listed reporting entity is Arizona State University.
The midpoint sits between rows 50 and 51, illustrating the steep falloff below the largest funds.
The ten largest entries account for about $320.0B of the Top 100 total.
Values are fiscal-year market values shown in USD billions for a 2026 publication edition.
Overview: why endowment wealth is concentrated
The upper tier is dominated by private U.S. research universities with long histories of philanthropy, large alumni donor networks and professional investment offices. Harvard, Yale, Stanford, Princeton and MIT remain the core private-university group at the top, while public university systems such as the University of Texas System and the Texas A&M University System enter the same financial tier because they report consolidated system-level funds.
A single-campus private university and a multi-campus public system are not identical units. A system endowment may support several campuses, medical schools, research centers or foundations. A private university endowment is often more directly tied to one institutional brand, although even there the money is divided among many restricted funds.
Absolute size also differs from endowment per student. A university with $8 billion and a small student body may have more endowment support per student than a system with $25 billion spread across many campuses. For financial analysis, endowment size is best read alongside enrollment, annual payout, restrictions, operating budget and debt.
Top 10 U.S. endowment reporting entities
The Top 10 combines elite private universities and major public systems. Harvard remains the largest private-university endowment, while the University of Texas System and Texas A&M University System show how system-level public entities can rank alongside the wealthiest private institutions.
| Rank | Reporting entity | Endowment market value | Category / reporting note |
|---|---|---|---|
| 1 | Harvard University | $55.67B | Private university |
| 2 | Yale University | $44.15B | Private university |
| 3 | Stanford University | $40.79B | Private university |
| 4 | Princeton University | $36.42B | Private university |
| 5 | Massachusetts Institute of Technology | $27.37B | Private university |
| 6 | University of Texas System | $27.17B | Public university system |
| 7 | University of Pennsylvania | $24.81B | Private university |
| 8 | Texas A&M University System & Related Foundations | $22.23B | Public university system |
| 9 | University of Michigan | $21.20B | Public university |
| 10 | Regents of the University of California | $20.15B | Public university system |
Values are rounded to two decimals in USD billions. System-level and foundation-level entries should not be interpreted as single-campus funds.
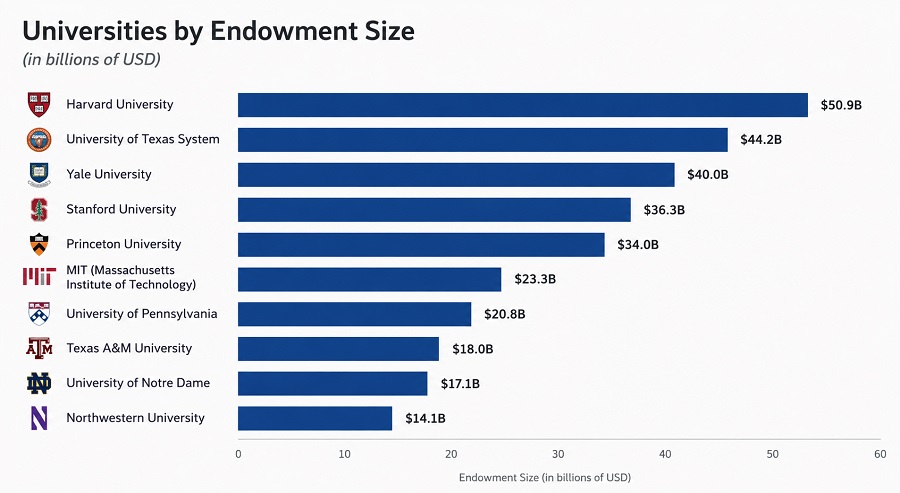
Chart: Top 20 reported endowment values
The Top 20 ranges from Harvard at $55.67B to Vanderbilt University at $10.86B. The sharp decline after the first four institutions illustrates how concentrated endowment wealth remains even inside the largest-fund tier.
Methodology
The ranking measures reported endowment market value: long-term investment assets held for institutional support, including true endowments and funds functioning as endowment when the reporting source groups them together. Values are shown in USD billions and rounded to two decimals.
FY2025 is used for the 2026 edition because endowment reporting follows fiscal years, not calendar-year article labels. The 2026 label refers to a publication-year ranking based on the latest completed fiscal-year data broadly available in 2026.
Reporting entity
Some entries are single private universities; others are public systems, medical centers or affiliated foundations. The table keeps the reporting entity name rather than reallocating system assets to individual campuses.
Calculation logic
Ranking order is based on reported FY2025 endowment market value. No per-student adjustment, spending-rate adjustment or operating-budget adjustment is applied.
Rounding
Values are rounded to the nearest $0.01B. Rounding improves readability but can create apparent ties between entities with slightly different unrounded values.
What the metric excludes
The ranking does not measure teaching quality, research output, admissions selectivity, affordability, endowment per student, annual payout, unrestricted cash or budget strength.
Comparability limits matter. Donor restrictions can prevent universities from freely spending large portions of an endowment. Public systems may pool assets across multiple campuses. Foundations may manage funds legally separate from the university but dedicated to its mission. Market values also move after fiscal year-end, so the ranking should be read as a fiscal-year financial snapshot rather than a live asset valuation.
Full ranking: Top 100 U.S. higher-education endowment reporting entities
The full table lists 100 reporting entities by reported FY2025 endowment market value. The controls search, filter, sort and limit existing HTML rows; they do not create the ranking through JavaScript.
| Rank | Reporting entity | Endowment market value | Category / reporting note |
|---|---|---|---|
| 1 | Harvard University | $55.67B | Private university |
| 2 | Yale University | $44.15B | Private university |
| 3 | Stanford University | $40.79B | Private university |
| 4 | Princeton University | $36.42B | Private university |
| 5 | Massachusetts Institute of Technology | $27.37B | Private university |
| 6 | University of Texas System | $27.17B | Public university system |
| 7 | University of Pennsylvania | $24.81B | Private university |
| 8 | Texas A&M University System & Related Foundations | $22.23B | Public university system |
| 9 | University of Michigan | $21.20B | Public university |
| 10 | Regents of the University of California | $20.15B | Public university system |
| 11 | University of Notre Dame | $20.09B | Private university |
| 12 | Columbia University | $15.92B | Private university |
| 13 | Northwestern University | $15.17B | Private university |
| 14 | Johns Hopkins University | $13.73B | Private university |
| 15 | Washington University in St. Louis | $13.30B | Private university |
| 16 | Duke University | $12.32B | Private university |
| 17 | Emory University | $12.00B | Private university |
| 18 | Cornell University | $11.75B | Private university |
| 19 | University of Virginia | $11.23B | Public university |
| 20 | Vanderbilt University | $10.86B | Private university |
| 21 | University of Chicago | $10.62B | Private university |
| 22 | University of Southern California | $9.03B | Private university |
| 23 | Dartmouth College | $8.96B | Private university |
| 24 | Ohio State University | $8.62B | Public university |
| 25 | Rice University | $8.50B | Private university |
| 26 | Brown University | $7.28B | Private university |
| 27 | New York University | $7.28B | Private university |
| 28 | University of Texas at Austin | $6.49B | Public university |
| 29 | University of Minnesota & Foundations | $6.45B | Public university / foundation |
| 30 | University of North Carolina at Chapel Hill | $6.22B | Public university |
| 31 | University of Pittsburgh | $6.15B | Public university |
| 32 | Pennsylvania State University | $5.06B | Public university |
| 33 | University of Wisconsin Foundation | $4.92B | Foundation / related entity |
| 34 | UCLA Foundation | $4.77B | Foundation / related entity |
| 35 | Michigan State University | $4.61B | Public university |
| 36 | Purdue University | $4.44B | Public university |
| 37 | California Institute of Technology | $4.32B | Private university |
| 38 | Carnegie Mellon University | $4.29B | Private university |
| 39 | Boston College | $4.24B | Private university |
| 40 | Indiana University Foundation | $4.05B | Foundation / related entity |
| 41 | Boston University | $4.02B | Private university |
| 42 | Georgetown University | $3.95B | Private university |
| 43 | Williams College | $3.93B | Liberal arts college |
| 44 | Amherst College | $3.90B | Liberal arts college |
| 45 | University of Illinois & Foundations | $3.80B | Public university / foundation |
| 46 | University of Iowa and Foundations | $3.77B | Public university / foundation |
| 47 | Georgia Institute of Technology and Related Foundations | $3.51B | Public university / foundation |
| 48 | University of Richmond | $3.49B | Private university |
| 49 | University of California Berkeley Foundation | $3.39B | Foundation / related entity |
| 50 | University of California San Francisco | $3.29B | Public university |
| 51 | University of Rochester | $3.24B | Private university |
| 52 | Virginia Commonwealth University and Affiliated Entities | $3.23B | Public university / foundation |
| 53 | Pomona College | $3.22B | Liberal arts college |
| 54 | Wellesley College | $3.19B | Liberal arts college |
| 55 | Texas Tech University | $3.07B | Public university |
| 56 | Bowdoin College | $2.92B | Liberal arts college |
| 57 | Grinnell College | $2.85B | Liberal arts college |
| 58 | Texas Christian University | $2.85B | Private university |
| 59 | Swarthmore College | $2.84B | Liberal arts college |
| 60 | George Washington University | $2.81B | Private university |
| 61 | University of Nebraska | $2.72B | Public university |
| 62 | Smith College | $2.71B | Liberal arts college |
| 63 | Tufts University | $2.71B | Private university |
| 64 | Kansas University Endowment Association | $2.69B | Foundation / related entity |
| 65 | University of Florida Foundation Inc. | $2.69B | Foundation / related entity |
| 66 | Rockefeller University | $2.61B | Private university |
| 67 | Board of Trustees of the University of Alabama | $2.59B | Public university system |
| 68 | University of Missouri System | $2.55B | Public university system |
| 69 | North Carolina State University | $2.54B | Public university |
| 70 | Case Western Reserve University | $2.52B | Private university |
| 71 | Tulane University | $2.47B | Private university |
| 72 | University of Colorado Foundation | $2.47B | Foundation / related entity |
| 73 | University of Texas Southwestern Medical Center | $2.47B | Public medical center |
| 74 | University System of Maryland Foundation | $2.46B | Foundation / related entity |
| 75 | Rutgers, The State University of New Jersey | $2.35B | Public university |
| 76 | Southern Methodist University | $2.34B | Private university |
| 77 | Syracuse University | $2.27B | Private university |
| 78 | Washington and Lee University | $2.19B | Liberal arts college |
| 79 | Baylor University | $2.18B | Private university |
| 80 | University of Georgia and Related Foundations | $2.18B | Public university / foundation |
| 81 | University of Kentucky | $2.17B | Public university |
| 82 | Wake Forest University | $2.15B | Private university |
| 83 | Texas State University System | $2.11B | Public university system |
| 84 | Virginia Tech Foundation | $2.09B | Foundation / related entity |
| 85 | University of Utah | $2.07B | Public university |
| 86 | University of Delaware | $2.06B | Public university |
| 87 | Saint Louis University | $2.02B | Private university |
| 88 | Lehigh University | $2.00B | Private university |
| 89 | University of Texas M.D. Anderson Cancer Center | $1.96B | Public medical center |
| 90 | Medical College of Wisconsin | $1.94B | Private medical college |
| 91 | Trinity University | $1.94B | Liberal arts college |
| 92 | University of Tennessee System | $1.92B | Public university system |
| 93 | Iowa State University | $1.91B | Public university |
| 94 | University of Oregon Foundation | $1.84B | Foundation / related entity |
| 95 | Berea College | $1.83B | Liberal arts college |
| 96 | University of Arkansas at Fayetteville and Foundation | $1.81B | Public university / foundation |
| 97 | University of Massachusetts Foundation | $1.80B | Foundation / related entity |
| 98 | University of California San Diego | $1.79B | Public university |
| 99 | University of Cincinnati | $1.77B | Public university |
| 100 | Arizona State University | $1.76B | Public university |
Source basis: NACUBO-derived public table, NACUBO-Commonfund Study of Endowments summary materials and institution-level financial reporting for context. Values are rounded to two decimals in USD billions.
Insights from the corrected endowment ranking
Key insight
The Top 10 holds about $320.0B, while the 100th entry is $1.76B. Endowment wealth is therefore concentrated in a small group of institutions with long fundraising histories, large donor networks and mature investment offices.
Notable pattern
Private universities dominate the highest ranks, but public systems enter the same tier when they report consolidated assets. The University of Texas System and Texas A&M System are reporting-entity entries, not single-campus equivalents.
Correction that mattered
Several previously listed values were not consistent with FY2025 NACUBO-derived figures. Washington and Lee is reported at $2.19B, Caltech at $4.32B, University of Chicago at $10.62B, and Ohio State at $8.62B in this corrected version.
Outlier
Harvard’s $55.67B endowment remains an outlier even among wealthy universities. It is about 1.26 times Yale’s reported value and more than three times Columbia’s reported value in this snapshot.
What it means for students, universities and analysts
For students and families, a large endowment can signal deeper institutional resources, but it should not be read as a direct promise of lower tuition or better aid. Spending rules, donor restrictions and board-approved payout policies determine how much of the portfolio supports current students.
For universities, endowment scale affects resilience. Larger funds can support financial aid, research infrastructure, faculty chairs, libraries, museums, laboratories and strategic initiatives when operating budgets face pressure. Smaller endowments can still be well managed, but they usually have less room to absorb shocks.
For analysts and policymakers, the ranking is most useful when paired with enrollment, endowment per student, payout rate, operating revenue, debt load and restricted-fund composition. A system-level endowment spread across many campuses should not be compared one-to-one with a single-campus private university.
FAQ
Which institution has the largest endowment in this 2026 edition?
Harvard University ranks first with a reported FY2025 endowment market value of $55.67B. The figure is a fiscal-year snapshot, not a live portfolio value.
Does a bigger endowment mean a better university?
No. Endowment size measures financial assets held for long-term institutional support. It does not directly measure teaching quality, research productivity, graduate outcomes, affordability or student satisfaction.
Why are university systems and foundations included with single universities?
Some public systems and institutionally related foundations report consolidated endowment assets. The table keeps the reporting entity intact rather than reallocating funds to campuses, because that is how the assets are publicly disclosed.
Why can an endowment be large while tuition remains high?
Many endowment funds are restricted by donors for specific purposes such as scholarships, professorships, research programs or facilities. Universities also usually spend only a policy-based percentage each year to preserve purchasing power for future generations.
What is the difference between endowment size and endowment per student?
Endowment size is the total reported market value. Endowment per student divides that value by enrollment and can change the interpretation substantially. A smaller institution with a smaller total fund may still have very high support per student.
Why is FY2025 used for a 2026 ranking?
Endowment reporting follows fiscal years. FY2025 is the latest completed reporting cycle broadly available for a 2026 publication-year snapshot, while calendar-year 2026 investment values would still be incomplete and less comparable.
Are all figures fully comparable?
They are comparable as reported market values, but not perfectly comparable as institutional resources. Reporting entity, donor restrictions, foundation structure, campus count, spending policy and fiscal-year timing can all affect interpretation.
Sources
The source stack prioritizes NACUBO/Commonfund methodology and public endowment market-value tables. The full downloadable data pack also includes source URLs in CSV, JSON and XLSX formats.
Primary sector benchmark for U.S. higher-education endowment market values, returns, asset allocation, spending and governance practices.
https://www.nacubo.org/Research/2025/NACUBO-Commonfund-Study-of-EndowmentsSummary report confirming the FY2025 reporting framework, total respondent assets and sector-level results.
https://files.eric.ed.gov/fulltext/ED679860.pdfCompanion release context for the NACUBO-Commonfund endowment study and its fiscal-year reporting framework.
https://www.commonfund.org/research-center/press-releases/fy25-nacubo-commonfund-study-releasedPublic table used for the row-level FY2025 values in this corrected ranking. It separates private and public reporting entities and states that data are from NACUBO as reported in spring 2026.
https://en.wikipedia.org/wiki/List_of_colleges_and_universities_in_the_United_States_by_endowmentRelated rankings
More StatRanker rankings on education outcomes, students and learning benchmarks.
Top 100 Universities by Student-to-Faculty Ratio, 2026
Open rankingTop 100 Countries by QS-Ranked Universities 2025.
Open rankingStatRanker (Website)
administrator
