

California Cities by Air Quality, 2026
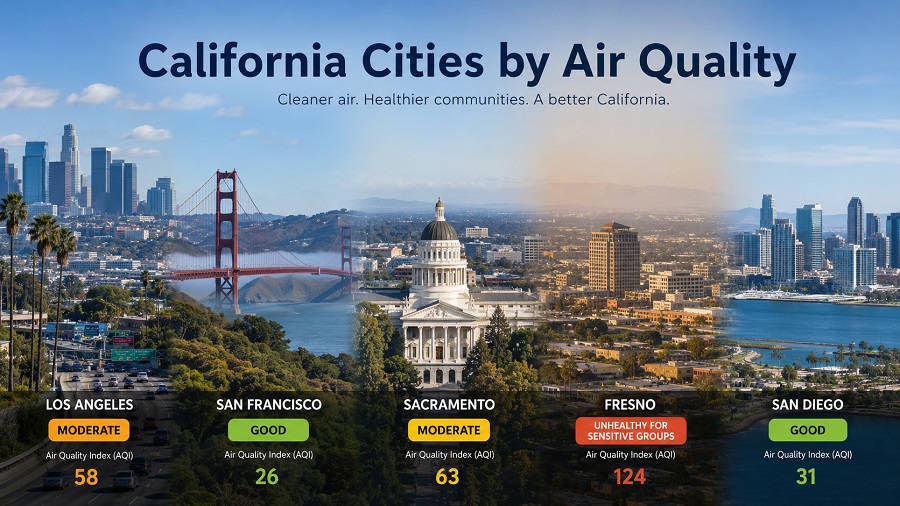
California metro areas with the worst air quality burden
This ranking compares California metropolitan areas that appear in the American Lung Association “State of the Air 2026” worst-ranked city lists, including tied ranks where ALA shows them. It covers ozone, short-term particle pollution and year-round particle pollution for the 2022–2024 monitoring window, using the latest quality-assured EPA air data available for that report cycle.
The table does not rank every California city or identify the cleanest places in the state. It focuses only on California metro areas that reached at least one high-pollution ALA city list for ozone or particle pollution. Areas outside the table may still have monitored air-quality issues, but they did not enter the source lists used for this comparison.
The pollution-burden index is a StatRanker calculation derived from each area’s national rank position. A higher index means the metro area appears higher, and more consistently, across ozone and particle-pollution lists. The index measures severity of rank placement, not pollutant concentration, and it is not published by the American Lung Association, not an EPA regulatory score and not a live AQI reading.
Continue exploring
More StatRanker rankings on health systems, outcomes and medical capacity.
US Cities by Air Quality, 2026
Open rankingCalifornia Cities by Crime Rate, Latest Official Data
Open rankingCalifornia Cities by Median Home Sale Price, 2026
Open rankingBakersfield-Delano ranks near the top nationally for ozone, short-term PM and annual particle pollution.
The scope is limited to California areas appearing in at least one ALA worst-ranked city list.
The 2026 report cycle uses the latest quality-assured EPA data for those three years.
Ground-level ozone, short-term particle spikes and annual particle exposure are treated separately.
Daily air can be better or worse than the long-term pattern shown here. Wildfire smoke, wind, heat and local emissions can change AQI conditions within hours.
What the ranking measures
Air quality cannot be reduced to one pollutant. Ozone reflects smog-forming conditions that depend on sunlight, heat and precursor emissions. Particle pollution reflects fine particles from combustion, wildfire smoke, diesel traffic, industrial activity, wood burning and atmospheric chemistry. A place can be severe for ozone but less severe for annual PM2.5, or the reverse.
The American Lung Association ranks metropolitan areas separately for ozone, short-term particle pollution and year-round particle pollution. Combining the three list positions makes repeated multi-pollutant burden easier to compare among California metro areas that entered the source lists.
California metro areas with the highest combined burden
The top of the table is concentrated in the San Joaquin Valley and Southern California. Bakersfield-Delano, Visalia, Los Angeles-Long Beach and Fresno-Hanford-Corcoran each appear in all three pollution categories, showing repeated ozone and particle-pollution pressure rather than a one-pollutant problem.
| Rank | Metro area | Burden index | Main pattern |
|---|---|---|---|
| 1 | Bakersfield-Delano | 71 | Highest listed California burden, with very high national positions for annual PM, short-term PM and ozone. |
| 2 | Visalia | 66 | San Joaquin Valley pattern across ozone, daily particle spikes and annual particle exposure. |
| 3 | Los Angeles-Long Beach | 63 | Nationally leading ozone burden combined with high particle-pollution list positions. |
| 4 | Fresno-Hanford-Corcoran | 63 | Central Valley exposure pattern with high annual PM2.5 ranking and short-term PM episodes. |
| 5 | San Diego-Chula Vista-Carlsbad | 40 | Ozone and annual particle-pollution burden without a 2026 short-term PM listing in the ALA source table. |
| 6 | El Centro | 33 | Inland desert and agricultural setting with ozone and particle-pollution list appearances. |
| 7 | San Jose-San Francisco-Oakland | 31 | Lower combined burden than the valley leaders, but still present across all three categories. |
| 8 | Sacramento-Roseville | 10 | Listed for ozone only; not in the 2026 source lists for either particle-pollution category. |
The burden index is calculated from national rank positions. It compares listed California metro areas only and should not be read as a pollutant concentration or as a linear measure of health risk.
Chart: pollution-burden index by metro area
The four highest scores are clustered tightly, while the remaining listed areas drop sharply below 40 points. Bakersfield-Delano, Visalia, Los Angeles-Long Beach and Fresno-Hanford-Corcoran stand out because they rank high in multiple pollutant categories.
Index scale: 0–71 within this table, where 71 is the highest combined value among the listed California metro areas.
Methodology
The ranking uses the American Lung Association “State of the Air 2026” city rankings as the source frame. The report ranks metropolitan areas for ozone, year-round particle pollution and short-term particle pollution using official EPA data for 2022, 2023 and 2024.
Metric definition
Pollution-burden index = sum of category points from ALA rank positions. Points equal 26 minus the national rank in each pollutant category.
Data year and snapshot
The 2026 page uses the 2022–2024 monitoring window because it is the latest complete quality-assured reporting period in the 2026 State of the Air cycle.
Coverage rule
Included areas are California metropolitan areas that appear in at least one ALA worst-ranked city list for ozone, short-term PM or year-round PM.
What the index excludes
The index does not include California places outside those source lists, neighborhood-level exposure, live AQI, indoor air quality or local monitor-by-monitor values.
Formula and calculation
A national rank of #1 in a pollutant category receives 25 points, #2 receives 24 points and #25 receives 1 point. If a California metro area is not present in a category’s source list, it receives 0 points for that category. Tied American Lung Association ranks keep the same rank number and therefore receive the same point value in this calculation. For example, Bakersfield-Delano appears as #3 for ozone, #3 for short-term particle pollution and #1 for year-round particle pollution, producing 23 + 23 + 25 = 71 points.
Why this is a burden index rather than a clean-air ranking
The source lists identify high-pollution metropolitan areas, not every city in California. The index is a StatRanker transformation of published list positions, not a separate measurement released by the American Lung Association. A low score in this table means an area had fewer or lower source-list appearances; it does not prove that the area has clean air, and it does not rank places that never entered the source lists.
Comparability limits
The index is rank-based, so the numerical distance between places is not the same as the measured distance in ozone days, PM2.5 design values or health risk. The gap between #1 and #2 in an ALA category may be smaller or larger than the gap between #10 and #20, but the points formula treats each rank step evenly. Metropolitan areas also include the counties that form a federal economic and transportation network, which makes the figures useful for regional comparison but not for comparing individual neighborhoods or municipal boundaries.
Ozone and PM2.5 respond to different weather, emissions and wildfire conditions. Pollutant-specific rankings should therefore be read alongside the combined index, daily AQI, local air-district alerts and wildfire-smoke information.
Complete 8-area table: listed California metro areas by pollution-burden index
The table includes only California metropolitan areas appearing in at least one 2026 ALA worst-ranked city list. Search and sorting are available for quick comparison, while the rank column keeps the original burden order.
| Rank | Metro area | Burden index | Source-list positions |
|---|---|---|---|
| 1 | Bakersfield-Delano | 71 | Ozone #3; short-term particle pollution #3; year-round particle pollution #1. |
| 2 | Visalia | 66 | Ozone #2; short-term particle pollution #5; year-round particle pollution #5. |
| 3 | Los Angeles-Long Beach | 63 | Ozone #1; short-term particle pollution #7; year-round particle pollution #7. |
| 4 | Fresno-Hanford-Corcoran | 63 | Ozone #5; short-term particle pollution #6; year-round particle pollution #4. |
| 5 | San Diego-Chula Vista-Carlsbad | 40 | Ozone #7; year-round particle pollution #5; not listed in the 2026 short-term PM source list. |
| 6 | El Centro | 33 | Ozone #10; short-term particle pollution #14; year-round particle pollution #21. |
| 7 | San Jose-San Francisco-Oakland | 31 | Ozone #14; short-term particle pollution #20; year-round particle pollution #13. |
| 8 | Sacramento-Roseville | 10 | Ozone #16; not listed in the 2026 short-term or year-round particle-pollution source lists. |
Source snapshot: American Lung Association State of the Air 2026 city rankings, based on EPA air-quality data for 2022–2024. Metro-area names follow the source reporting convention.
What the ranking shows
The San Joaquin Valley has the clearest multi-pollutant pattern
Bakersfield-Delano, Visalia and Fresno-Hanford-Corcoran rank high because the valley combines emissions sources with difficult geography. Mountain barriers, stagnant air, freight corridors, agriculture, residential combustion and wildfire smoke can all contribute to persistent particle and ozone problems.
Los Angeles remains an ozone outlier
Los Angeles-Long Beach leads the ozone list and remains high in both particle categories. Its burden reflects a dense transportation network, ports, warehousing, industrial activity, basin meteorology and strong sunlight that favors ozone formation.
San Diego-Chula Vista-Carlsbad shows why a single pollutant label is not enough. It appears strongly for ozone and year-round particle pollution, but it is not listed among the 2026 short-term particle-pollution source rows used for this index. That profile differs from valley areas where both chronic and episodic particle burdens are more prominent.
San Jose-San Francisco-Oakland ranks below the leading valley and Los Angeles areas, but it still appears across all three categories. Coastal ventilation helps parts of the Bay Area, while wildfire smoke, regional transport, ports, traffic corridors and inland heat can still raise measured burden across the wider metro area.
Sacramento-Roseville appears only for ozone in this framework. That does not make it a clean-air benchmark; it means its 2026 particle-pollution positions did not reach the ALA source-list threshold used for this index.
What this means for readers
For residents, the ranking provides long-term context. It identifies California metro areas where pollution is severe enough to appear in national high-burden lists, but it should be read alongside daily AQI forecasts, local air-district alerts and wildfire-smoke conditions.
For families and health-sensitive groups, the pollutant mix matters. Ozone is often worse on hot sunny afternoons, while PM2.5 can spike during wildfire smoke, winter inversions, wood-burning periods or high-emission episodes. Children, older adults and people with asthma, COPD or heart disease should pay attention to both.
For businesses and local governments, the table points to operational risks: outdoor work, school sports, construction schedules, logistics, clean-fleet planning, housing exposure and emergency smoke response all depend on understanding whether local burden is mainly ozone, PM2.5 or both.
FAQ
Which California metro area has the highest air-pollution burden in this table?
Bakersfield-Delano ranks first because it appears near the top nationally for ozone, short-term particle pollution and year-round particle pollution in the 2026 reporting cycle.
Does this rank every city in California?
No. The table includes only California metropolitan areas that appear in at least one American Lung Association 2026 worst-ranked city list for ozone or particle pollution. It is not a full city-by-city inventory.
Is this the same as today’s AQI?
No. AQI is a daily or near-real-time measure. This ranking uses the 2022–2024 monitoring window behind the 2026 State of the Air report and reflects a longer-term pattern.
Why are these metro names longer than ordinary city names?
The source ranks metropolitan areas, which include the counties that form a federal economic and transportation network. That is why names such as Fresno-Hanford-Corcoran or San Jose-San Francisco-Oakland appear.
Why do ozone and particle rankings differ?
Ozone forms in sunlight from precursor pollutants, especially in hot stagnant conditions. PM2.5 comes from fine particles and particle-forming gases, including smoke, diesel traffic, industry, combustion and wood burning. The same region can rank differently across those pollutants.
Does a lower burden index mean clean air?
Not necessarily. A lower value means the area had fewer or lower source-list appearances in this framework. It does not mean every neighborhood is clean, and it does not rule out unhealthy wildfire-smoke or ozone episodes.
How do wildfires affect California air rankings?
Wildfire smoke can sharply raise PM2.5 over short periods and can influence annual particle averages. Smoke can also travel far from the fire source, affecting metro areas that are not close to the burn zone.
What should someone check before moving to a California city?
Check daily AQI history, ozone season behavior, wildfire-smoke exposure, proximity to highways or industrial corridors, local air-district alerts, school exposure and whether the local burden is driven by ozone, particles or both.
Sources
-
American Lung Association — State of the Air 2026: Most Polluted Cities
Used for the national city-area ranks for ozone, short-term particle pollution and year-round particle pollution. -
American Lung Association — State of the Air 2026 report PDF
Used to verify the published 2026 report cycle, pollutant categories, ranking tables and source framing. -
American Lung Association — State of the Air methodology
Used for the reporting-window logic, pollutant categories and city-ranking methodology. -
U.S. EPA — Air Quality: Cities and Counties
Used for EPA city and county air-quality context and the CBSA-based city-statistics convention. -
U.S. EPA AirData
Official source environment for outdoor monitor data, annual summaries, AQI reports and historical air-quality files.
Related rankings
More StatRanker rankings on health systems, outcomes and medical capacity.
