

US States by Job Growth in 2026
February 2026 Payroll Growth Ranking Across All 50 States
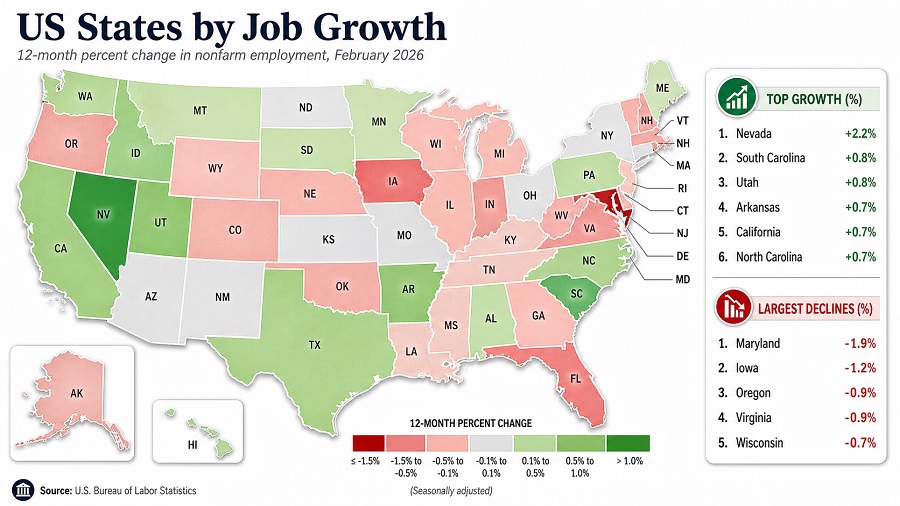
US states by job growth 2026 ranks the 50 states by the year-over-year percent change in total nonfarm payroll employment. The data come from the U.S. Bureau of Labor Statistics State and Metro Area Current Employment Statistics table for February 2026. The figures are seasonally adjusted, preliminary and reported as jobs by place of work.
This is not a full-year 2026 result. It is the latest available official 2026 state snapshot at the time of publication: February 2026 compared with February 2025. The ranking uses February data rather than a forecast or private estimate.
Nevada ranked first by job growth rate at +2.2% from February 2025 to February 2026. South Carolina and Utah followed at +0.8%, while California recorded the largest net gain with +120.5 thousand payroll jobs.
US states by job growth 2026: what the ranking shows
The strongest growth is concentrated in states with tourism, construction, population inflows, logistics, business services or mixed Sun Belt and Mountain West momentum. Nevada leads the ranking by rate, while South Carolina and Utah follow at +0.8%. California and North Carolina both record +0.7%, showing that large employment bases can still post meaningful gains even when the national labor market is uneven.
The Top 20 is not only a Sun Belt story. Pennsylvania, Minnesota, Maine, New York, Ohio, Missouri and Kansas also appear in the upper portion of the table, but with more modest rates between +0.1% and +0.3%. The middle and lower portions of the ranking show a different picture: several large states posted small declines, while Maryland, Iowa, Oregon and Virginia were among the weakest performers in this snapshot.
Top 20 US states by job growth rate in 2026
The table ranks states by year-over-year percent growth in total nonfarm payroll jobs. Ties are ordered by the number of jobs added, so a state with the same growth rate but a larger net increase appears first.
| Rank | State | Jobs added | Job growth |
|---|---|---|---|
| 1 | Nevada | +34.5k | +2.2% |
| 2 | South Carolina | +20.2k | +0.8% |
| 3 | Utah | +13.5k | +0.8% |
| 4 | California | +120.5k | +0.7% |
| 5 | North Carolina | +36.3k | +0.7% |
| 6 | Arkansas | +9.1k | +0.7% |
| 7 | Texas | +73.8k | +0.5% |
| 8 | Idaho | +4.6k | +0.5% |
| 9 | Montana | +2.1k | +0.4% |
| 10 | South Dakota | +1.7k | +0.4% |
| 11 | Pennsylvania | +18.8k | +0.3% |
| 12 | Alabama | +6.9k | +0.3% |
| 13 | Hawaii | +2.1k | +0.3% |
| 14 | Washington | +7.2k | +0.2% |
| 15 | Minnesota | +5.4k | +0.2% |
| 16 | Maine | +1.1k | +0.2% |
| 17 | New York | +9.9k | +0.1% |
| 18 | Ohio | +4.9k | +0.1% |
| 19 | Missouri | +1.5k | +0.1% |
| 20 | Kansas | +1.1k | +0.1% |
Source: U.S. Bureau of Labor Statistics, State and Metro Area Current Employment Statistics. Latest available 2026 snapshot: February 2026 preliminary seasonally adjusted total nonfarm payroll jobs; net change is shown in thousands.
Chart 1. Fastest-growing states by payroll jobs in 2026
The chart compares the ten fastest-growing states by year-over-year payroll employment rate. Bars are scaled to Nevada’s +2.2% rate, the highest value in this release.
Bars are scaled to Nevada’s +2.2% rate. A smaller bar does not necessarily mean a small labor market: California and Texas rank lower by rate but added many more jobs in absolute terms.
US states by job growth 2026: full ranking of all 50 states
Use the controls to search, filter by Census region, sort by growth rate or jobs added, and switch between Top 10, Top 20 and all states.
Default view shows the Top 20 states. Use the selector to view the Top 10 or all 50 states.
| Rank | State | Jobs added | Job growth |
|---|---|---|---|
| 1 | Nevada | +34.5k | +2.2% |
| 2 | South Carolina | +20.2k | +0.8% |
| 3 | Utah | +13.5k | +0.8% |
| 4 | California | +120.5k | +0.7% |
| 5 | North Carolina | +36.3k | +0.7% |
| 6 | Arkansas | +9.1k | +0.7% |
| 7 | Texas | +73.8k | +0.5% |
| 8 | Idaho | +4.6k | +0.5% |
| 9 | Montana | +2.1k | +0.4% |
| 10 | South Dakota | +1.7k | +0.4% |
| 11 | Pennsylvania | +18.8k | +0.3% |
| 12 | Alabama | +6.9k | +0.3% |
| 13 | Hawaii | +2.1k | +0.3% |
| 14 | Washington | +7.2k | +0.2% |
| 15 | Minnesota | +5.4k | +0.2% |
| 16 | Maine | +1.1k | +0.2% |
| 17 | New York | +9.9k | +0.1% |
| 18 | Ohio | +4.9k | +0.1% |
| 19 | Missouri | +1.5k | +0.1% |
| 20 | Kansas | +1.1k | +0.1% |
| 21 | Connecticut | +1.0k | +0.1% |
| 22 | North Dakota | +0.6k | +0.1% |
| 23 | New Mexico | +0.5k | +0.1% |
| 24 | Arizona | −0.3k | 0.0% |
| 25 | Delaware | −0.7k | −0.1% |
| 26 | Mississippi | −0.8k | −0.1% |
| 27 | Louisiana | −1.6k | −0.1% |
| 28 | Kentucky | −2.5k | −0.1% |
| 29 | New Jersey | −3.6k | −0.1% |
| 30 | Georgia | −5.8k | −0.1% |
| 31 | Wyoming | −0.5k | −0.2% |
| 32 | Alaska | −0.6k | −0.2% |
| 33 | Tennessee | −6.4k | −0.2% |
| 34 | Vermont | −0.9k | −0.3% |
| 35 | Rhode Island | −1.8k | −0.3% |
| 36 | Oklahoma | −5.2k | −0.3% |
| 37 | Colorado | −9.1k | −0.3% |
| 38 | Michigan | −13.3k | −0.3% |
| 39 | Illinois | −19.9k | −0.3% |
| 40 | West Virginia | −2.7k | −0.4% |
| 41 | Indiana | −12.7k | −0.4% |
| 42 | Florida | −36.7k | −0.4% |
| 43 | Nebraska | −5.3k | −0.5% |
| 44 | Massachusetts | −17.0k | −0.5% |
| 45 | New Hampshire | −4.2k | −0.6% |
| 46 | Wisconsin | −20.2k | −0.7% |
| 47 | Oregon | −17.9k | −0.9% |
| 48 | Virginia | −38.6k | −0.9% |
| 49 | Iowa | −19.2k | −1.2% |
| 50 | Maryland | −52.7k | −1.9% |
BLS reports total nonfarm payroll employment by state in thousands. This ranking uses the over-the-year percent change from February 2025 to February 2026, seasonally adjusted. The data are preliminary and do not represent a full-year 2026 result.
Methodology: how state job growth is measured
The ranking is based on the U.S. Bureau of Labor Statistics State and Metro Area Current Employment Statistics table titled “Change in total nonfarm employment by state, over-the-month and over-the-year, seasonally adjusted.” The core metric is the over-the-year percent change in total nonfarm payroll employment. In practical terms, it compares payroll jobs in February 2026 with payroll jobs in February 2025 for the same state.
The data year is 2026, but the measurement is a February 2026 preliminary snapshot. This distinction matters because state-level payroll data are released monthly and revised over time. A full-year 2026 ranking would require later annual average data or December-to-December results. February is used here because it is the latest official state table available for this page at the time of publication.
Values are shown in thousands of jobs for net change and percent for growth rate. BLS already publishes the over-the-year net change and over-the-year percent change, so the table does not rely on a private model. For ranking, states are sorted by growth rate from highest to lowest; when two states have the same rounded growth rate, the state with the larger net job gain appears first. District of Columbia is not included because the article is limited to the 50 states.
The main limitation is that payroll employment is a count of jobs by place of work, not a count of employed residents. A worker with two payroll jobs may be counted twice, and a person who lives in one state but works in another is counted in the work state. The series is also preliminary and subject to benchmark revisions, seasonal adjustment updates and later corrections. For that reason, small differences near zero should be interpreted cautiously.
Insights from the US state job growth ranking
1. Rate leadership and job-count leadership are different stories
Nevada ranks first by percentage growth, but California added far more jobs in absolute terms. This contrast is central to interpreting state labor markets: smaller states can lead by rate, while very large states can dominate net additions even with a moderate percentage gain.
2. The upper tier is strongest in the West and South
Nevada, Utah, California, Idaho and Montana place the West strongly in the upper tier, while South Carolina, North Carolina, Arkansas and Texas keep the South near the top. These are regions where migration, housing development, logistics, leisure, healthcare and business formation often shape employment momentum.
3. Many states are close to flat
A large share of the ranking sits between −0.3% and +0.3%. That narrow band means the state labor market in early 2026 is not broadly booming; it is uneven, with a limited group of clear gainers and a long middle where changes are modest.
4. Weak readings do not automatically mean structural decline
States near the bottom may reflect temporary industry shifts, federal employment exposure, seasonal adjustment effects, population dynamics or benchmark revisions. A single monthly snapshot is useful for current momentum, but it should be paired with longer time series before drawing structural conclusions.
What state job growth means for workers, employers and policymakers
For workers, job growth is a signal of labor-market opportunity, but it is not the same as wage growth or job quality. A state with fast payroll expansion may offer more openings, stronger mobility and greater demand in construction, healthcare, hospitality or logistics. Yet the same state can still have affordability pressures, skill mismatches or regional differences between metro and rural areas.
For businesses and investors, the ranking helps identify where employment demand is expanding, which can influence site selection, hiring plans, local consumer demand and commercial real estate decisions. For policymakers, weak or flat job growth can highlight the need to examine workforce participation, industry mix, housing supply, transportation, education pipelines and the resilience of local employers.
The most useful reading is comparative. A high-growth state is not automatically “better,” and a low-growth state is not automatically in crisis. The ranking is a starting point for understanding momentum, then asking which industries, regions and demographic trends are driving the change.
FAQ about US states by job growth 2026
Which US state had the highest job growth in 2026?
Nevada had the highest job growth rate in this February 2026 BLS snapshot, with total nonfarm payroll employment up +2.2% from February 2025.
Which state added the most jobs in 2026?
California added the most payroll jobs in absolute terms, with a net gain of +120.5 thousand jobs from February 2025 to February 2026.
Is this a forecast for all of 2026?
No. The ranking is a latest available 2026 snapshot based on February 2026 preliminary BLS payroll data. It should not be interpreted as a full-year forecast or an annual average for 2026.
How is job growth by state calculated?
This ranking compares each state’s total nonfarm payroll employment in February 2026 with February 2025 and ranks states by the percentage change over that period.
Why rank by percent growth instead of jobs added?
Percent growth makes states of different sizes more comparable. California and Texas usually add many jobs in absolute terms because their labor markets are huge, while smaller states can show stronger momentum by rate. The table includes both measures so readers can compare scale and speed.
What does “total nonfarm payroll employment” include?
It covers payroll jobs in most private and government nonfarm industries. It excludes farm employment and is based on jobs by place of work, not workers by place of residence.
Why are some changes very close to zero?
Monthly payroll estimates can move slightly because of normal business churn, seasonal adjustment, survey sampling and later revisions. Values near zero should be read as broadly flat unless supported by a longer trend.
Why is District of Columbia not in the table?
The BLS table includes District of Columbia, but this page is titled as a ranking of US states. To keep the row count and label accurate, only the 50 states are ranked.
Sources and data notes for US state job growth data
-
U.S. Bureau of Labor Statistics — State and Metro Area CES table
Primary data source for state payroll employment, over-the-year net change and over-the-year percent change.
https://www.bls.gov/web/laus/statewide_otm_oty_change.htm -
U.S. Bureau of Labor Statistics — Current Employment Statistics, State and Metro Area
Program page explaining that CES State and Metro Area produces employment, hours and earnings estimates for states and metropolitan areas.
https://www.bls.gov/sae/ -
U.S. Bureau of Labor Statistics — Handbook of Methods, CES State and Metro Area
Methodological background on the survey, coverage, sample design and use of state and area payroll employment estimates.
https://www.bls.gov/opub/hom/sae/
Data status: February 2026 preliminary estimates. Coverage: 50 states. Unit: thousands of seasonally adjusted total nonfarm payroll jobs by place of work. States are ranked by the percentage change in payroll jobs from February 2025 to February 2026.
StatRanker (Website)
administrator
