Top 100 Cities by Summer Heat Risk, 2026
Cities · Climate risk · 2026 summer edition
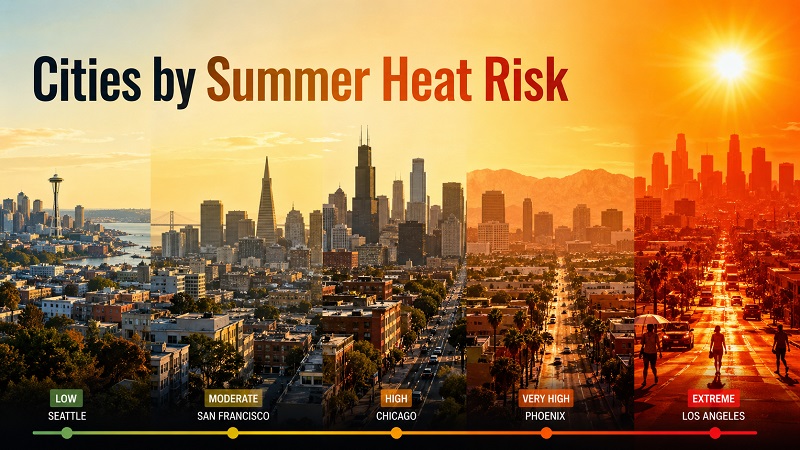
Where summer heat is becoming a practical city risk
Summer heat risk is not the same as a simple temperature ranking. A city becomes high-risk when extreme daytime heat combines with humid air, hot nights, dense built surfaces, limited shade, heavy outdoor exposure and infrastructure that struggles during heatwaves.
The ranking uses a 0–100 Summer Heat Risk Index to compare how severe summer heat can become across major cities, fast-growing metropolitan areas and major travel hubs. The score helps compare pressure on daily life, health, tourism, electricity demand and relocation decisions; it is not an official forecast for a single future day.
Key findings from the upper part of the ranking
The highest-risk cities are concentrated in the Gulf, South Asia, North Africa, parts of the Middle East and the hottest inland cities of North America. These places face different versions of heat risk. Dubai, Doha and Kuwait City combine intense summer heat with humid coastal conditions. Delhi, Lahore and Karachi add large population exposure. Phoenix and Las Vegas show how dry heat can become dangerous when daytime extremes are frequent and nights remain warm.
European cities are not absent from the list. Athens, Madrid, Seville, Rome and Marseille appear because recent summers have shown stronger heatwave patterns in southern and western Europe. Their risk is lower than the Gulf or South Asia on raw summer heat, but urban design, aging populations and tourist exposure make heat adaptation increasingly important.
Kuwait City, Doha, Dubai, Riyadh and Muscat sit near the top because summer heat is intense, persistent and often combined with night-time retention or coastal humidity.
Delhi, Lahore, Karachi, Dhaka and Kolkata rank high because climate stress overlaps with dense populations, outdoor work and uneven access to cooling.
Phoenix and Las Vegas face extremely hot dry summers, while Miami, Bangkok, Manila and Singapore have lower peak temperatures but stronger humidity stress.
Wealthier cities may still rank high in exposure, but stronger health systems, cooling centers, shade plans and resilient power grids can reduce mortality and disruption.
Top 10 cities with the highest summer heat risk
The Top 10 combines desert megacities, Gulf coastal hubs and high-exposure South Asian metros. The common pattern is not only high temperature; it is the persistence of heat across day and night, combined with large populations, transport exposure, outdoor labor or coastal humidity.
Extreme dry heat, very high summer peaks and strong night-time retention place Kuwait City at the top of the comparative risk ranking.
Basra combines severe heat with humidity from nearby waterways and energy-infrastructure pressure during the hottest months.
Doha’s risk is driven by Gulf humidity, extremely hot nights and sustained outdoor exposure during a long summer season.
Dubai has strong adaptation capacity, but very high summer humidity, built-surface heat and energy demand keep exposure elevated.
Riyadh’s inland desert climate produces repeated daytime extremes and a long season of heat stress across transport and outdoor activity.
Muscat combines coastal humidity, hot nights and limited urban cooling during the most stressful part of the year.
Delhi ranks high because extreme pre-monsoon heat affects a very large population with high outdoor and transport exposure.
Lahore faces severe heatwaves, air-quality interaction and large population vulnerability during the hottest weeks.
Karachi’s coastal humidity and past deadly heatwave experience make heat preparedness a central public-health issue.
Phoenix is the leading high-income city in the ranking because extreme dry heat, hot nights and car-dependent exposure remain severe.
Chart 1. Top 20 cities by Summer Heat Risk Index
The chart highlights the upper tail of the ranking. Scores above 85 indicate cities where summer heat is not only uncomfortable but can become a public-health, infrastructure and economic risk during severe heatwaves.
Top 20 fallback list
- Kuwait City — 98.6
- Basra — 97.8
- Doha — 96.9
- Dubai — 96.1
- Riyadh — 95.4
- Muscat — 94.7
- Delhi — 94.1
- Lahore — 93.6
- Karachi — 92.8
- Phoenix — 91.9
- Baghdad — 91.4
- Abu Dhabi — 90.8
- Jeddah — 90.2
- Ahvaz — 89.8
- Cairo — 89.1
- Las Vegas — 88.7
- Khartoum — 88.1
- Hyderabad — 87.5
- Ahmedabad — 86.9
- Bangkok — 86.4
Top 100 cities by Summer Heat Risk Index, 2026
Use the filters to compare cities by region, heat-risk type and ranking depth. Scores show relative summer heat pressure; they are not live heat alerts or local weather warnings.
| Rank | City | Country / Region | Summer Heat Risk Index |
|---|---|---|---|
| 1 | Kuwait CityKuwait | Kuwait · MENADry heat | 98.6Extreme summer peaks and hot nights. |
| 2 | BasraIraq | Iraq · MENAHumid heat | 97.8Severe heat with humidity pressure. |
| 3 | DohaQatar | Qatar · MENAHumid heat | 96.9Gulf humidity and persistent summer heat. |
| 4 | DubaiUnited Arab Emirates | UAE · MENAHumid heat | 96.1High exposure despite strong cooling capacity. |
| 5 | RiyadhSaudi Arabia | Saudi Arabia · MENADry heat | 95.4Long season of inland desert heat. |
| 6 | MuscatOman | Oman · MENAHumid heat | 94.7Coastal heat with limited night relief. |
| 7 | DelhiIndia | India · South AsiaHeatwave risk | 94.1Large exposed population and severe heatwaves. |
| 8 | LahorePakistan | Pakistan · South AsiaHeatwave risk | 93.6High heatwave exposure and dense urban growth. |
| 9 | KarachiPakistan | Pakistan · South AsiaHumid heat | 92.8Coastal humidity and major population exposure. |
| 10 | PhoenixUnited States | United States · North AmericaDry heat | 91.9Extreme dry heat and hot nights. |
| 11 | BaghdadIraq | Iraq · MENADry heat | 91.4Repeated extreme heat with infrastructure stress. |
| 12 | Abu DhabiUnited Arab Emirates | UAE · MENAHumid heat | 90.8High humidity and long heat season. |
| 13 | JeddahSaudi Arabia | Saudi Arabia · MENAHumid heat | 90.2Red Sea humidity increases heat stress. |
| 14 | AhvazIran | Iran · MENADry heat | 89.8Very high summer maximum temperatures. |
| 15 | CairoEgypt | Egypt · AfricaDry heat | 89.1Large metro exposure and hot urban surfaces. |
| 16 | Las VegasUnited States | United States · North AmericaDry heat | 88.7Extreme desert heat and tourist exposure. |
| 17 | KhartoumSudan | Sudan · AfricaDry heat | 88.1Extreme heat with limited adaptation capacity. |
| 18 | HyderabadIndia | India · South AsiaHeatwave risk | 87.5Fast urban growth and rising heatwave exposure. |
| 19 | AhmedabadIndia | India · South AsiaHeatwave risk | 86.9Known heat-action planning but high exposure. |
| 20 | BangkokThailand | Thailand · Southeast AsiaHumid heat | 86.4Persistent humid heat and dense urban form. |
| 21 | ManilaPhilippines | Philippines · Southeast AsiaHumid heat | 85.9Humidity, density and limited cooling access. |
| 22 | Ho Chi Minh CityVietnam | Vietnam · Southeast AsiaHumid heat | 85.4Tropical humidity and urban heat retention. |
| 23 | DhakaBangladesh | Bangladesh · South AsiaHumid heat | 84.8Very dense population and humid heat stress. |
| 24 | KolkataIndia | India · South AsiaHumid heat | 84.2High humidity and large exposed population. |
| 25 | ChennaiIndia | India · South AsiaHumid heat | 83.7Coastal humidity and hot nights. |
| 26 | MumbaiIndia | India · South AsiaHumid heat | 83.1Humid heat and dense coastal exposure. |
| 27 | MeccaSaudi Arabia | Saudi Arabia · MENAHeatwave risk | 82.7Heat risk amplified by pilgrimage exposure. |
| 28 | MedinaSaudi Arabia | Saudi Arabia · MENADry heat | 82.2Inland summer heat and visitor exposure. |
| 29 | TehranIran | Iran · MENAHeatwave risk | 81.8Heatwaves, elevation effects and air pollution. |
| 30 | TucsonUnited States | United States · North AmericaDry heat | 81.2Desert heat with repeated high-temperature days. |
| 31 | MiamiUnited States | United States · North AmericaHumid heat | 80.9Wet-bulb stress and hot nights. |
| 32 | San AntonioUnited States | United States · North AmericaHeatwave risk | 80.4Long hot season and urban expansion. |
| 33 | AustinUnited States | United States · North AmericaHeatwave risk | 79.8Rising heatwave exposure in fast growth corridor. |
| 34 | DallasUnited States | United States · North AmericaHeatwave risk | 79.3Repeated summer extremes and metro sprawl. |
| 35 | HoustonUnited States | United States · North AmericaHumid heat | 78.9Humidity, industry and large outdoor exposure. |
| 36 | MarrakeshMorocco | Morocco · AfricaDry heat | 78.4Tourism exposure during intense summer heat. |
| 37 | TunisTunisia | Tunisia · AfricaHeatwave risk | 77.9Mediterranean heatwaves and urban density. |
| 38 | AthensGreece | Greece · EuropeHeatwave risk | 77.5Heatwaves, hills, dense stone and asphalt surfaces. |
| 39 | SevilleSpain | Spain · EuropeDry heat | 77.1One of Europe’s strongest summer heat profiles. |
| 40 | MadridSpain | Spain · EuropeHeatwave risk | 76.6Urban heat island and recurring heatwaves. |
| 41 | CordobaSpain | Spain · EuropeDry heat | 76.1Very hot inland summer climate. |
| 42 | RomeItaly | Italy · EuropeHeatwave risk | 75.7Tourism, hot nights and summer heatwaves. |
| 43 | NaplesItaly | Italy · EuropeHumid heat | 75.2Coastal heat and dense urban fabric. |
| 44 | MarseilleFrance | France · EuropeHeatwave risk | 74.8Mediterranean heatwaves and coastal humidity. |
| 45 | LisbonPortugal | Portugal · EuropeHeatwave risk | 74.2Heatwaves, tourism and hillside exposure. |
| 46 | NicosiaCyprus | Cyprus · EuropeDry heat | 73.8Strong eastern Mediterranean summer heat. |
| 47 | AmmanJordan | Jordan · MENADry heat | 73.3Dry heat and water-stress context. |
| 48 | BeirutLebanon | Lebanon · MENAHumid heat | 72.9Coastal humidity and infrastructure vulnerability. |
| 49 | Tel AvivIsrael | Israel · MENAHumid heat | 72.4Coastal summer humidity and warm nights. |
| 50 | IzmirTurkey | Turkey · EuropeHeatwave risk | 71.9Aegean heatwaves and coastal exposure. |
| 51 | IstanbulTurkey | Turkey · EuropeHumid heat | 71.3Large city exposure and hot humid spells. |
| 52 | BakuAzerbaijan | Azerbaijan · MENAHeatwave risk | 70.8Caspian exposure with hot dry episodes. |
| 53 | ErbilIraq | Iraq · MENADry heat | 70.5Hot inland summers and growing urban exposure. |
| 54 | AlgiersAlgeria | Algeria · AfricaHeatwave risk | 70.1North African heatwave exposure. |
| 55 | TripoliLibya | Libya · AfricaDry heat | 69.7Hot dry spells and resilience constraints. |
| 56 | BamakoMali | Mali · AfricaDry heat | 69.2High heat with limited household cooling access. |
| 57 | NiameyNiger | Niger · AfricaDry heat | 68.7Severe Sahel heat and low adaptation capacity. |
| 58 | N'DjamenaChad | Chad · AfricaDry heat | 68.3Intense seasonal heat and social vulnerability. |
| 59 | OuagadougouBurkina Faso | Burkina Faso · AfricaDry heat | 67.9High heat with limited cooling infrastructure. |
| 60 | LagosNigeria | Nigeria · AfricaHumid heat | 67.5Humid coastal heat and dense informal exposure. |
| 61 | AccraGhana | Ghana · AfricaHumid heat | 67.1Humid tropical heat and urban growth. |
| 62 | AbidjanCote d'Ivoire | Cote d'Ivoire · AfricaHumid heat | 66.8Humid heat and dense coastal development. |
| 63 | DakarSenegal | Senegal · AfricaHumid heat | 66.4Coastal humidity and limited cooling access. |
| 64 | Mexico CityMexico | Mexico · Latin AmericaHeatwave risk | 66.0Highland city with rising hot-season extremes. |
| 65 | MonterreyMexico | Mexico · Latin AmericaDry heat | 65.6Hot inland industrial metro exposure. |
| 66 | GuadalajaraMexico | Mexico · Latin AmericaHeatwave risk | 65.1Urban heat and warm-season extremes. |
| 67 | HermosilloMexico | Mexico · Latin AmericaDry heat | 64.8Desert heat and frequent high-temperature days. |
| 68 | HavanaCuba | Cuba · Latin AmericaHumid heat | 64.4Humid Caribbean heat and infrastructure stress. |
| 69 | Santo DomingoDominican Republic | Dominican Republic · Latin AmericaHumid heat | 64.0Humid tropical heat and dense metro exposure. |
| 70 | San JuanPuerto Rico | Puerto Rico · Latin AmericaHumid heat | 63.6Hot humid nights and power-grid sensitivity. |
| 71 | CartagenaColombia | Colombia · Latin AmericaHumid heat | 63.2Caribbean humidity and tourism exposure. |
| 72 | GuayaquilEcuador | Ecuador · Latin AmericaHumid heat | 62.9Humid coastal heat and urban density. |
| 73 | LimaPeru | Peru · Latin AmericaNight heat | 62.4Coastal humidity and warm-night discomfort. |
| 74 | Rio de JaneiroBrazil | Brazil · Latin AmericaHumid heat | 62.0Humid heat, hillside settlements and tourism. |
| 75 | Sao PauloBrazil | Brazil · Latin AmericaHeatwave risk | 61.5Large urban heat island and hot spells. |
| 76 | Buenos AiresArgentina | Argentina · Latin AmericaHumid heat | 61.1Humid summer heatwaves and older population exposure. |
| 77 | SantiagoChile | Chile · Latin AmericaDry heat | 60.7Dry heat, valley air stagnation and urban exposure. |
| 78 | SingaporeSingapore | Singapore · Southeast AsiaHumid heat | 60.2Persistent humidity with strong adaptation systems. |
| 79 | Kuala LumpurMalaysia | Malaysia · Southeast AsiaHumid heat | 59.8Tropical humidity and heat-retaining surfaces. |
| 80 | JakartaIndonesia | Indonesia · Southeast AsiaHumid heat | 59.4Humid heat and infrastructure vulnerability. |
| 81 | Phnom PenhCambodia | Cambodia · Southeast AsiaHumid heat | 58.9Hot humid season and rapid urbanization. |
| 82 | YangonMyanmar | Myanmar · Southeast AsiaHumid heat | 58.5Humid heat with social vulnerability. |
| 83 | HanoiVietnam | Vietnam · Southeast AsiaHumid heat | 58.0Humid summer heat and dense urban districts. |
| 84 | Hong KongHong Kong SAR | Hong Kong SAR · East AsiaHumid heat | 57.6Humid nights and dense high-rise exposure. |
| 85 | GuangzhouChina | China · East AsiaHumid heat | 57.2Subtropical humidity and large metro exposure. |
| 86 | ShenzhenChina | China · East AsiaHumid heat | 56.8Humid heat and dense built form. |
| 87 | ShanghaiChina | China · East AsiaHeatwave risk | 56.4Humid heatwaves and dense metro exposure. |
| 88 | ChongqingChina | China · East AsiaHumid heat | 56.0Basin heat and humid summer stagnation. |
| 89 | WuhanChina | China · East AsiaHeatwave risk | 55.5Known hot-summer pattern and humidity. |
| 90 | TokyoJapan | Japan · East AsiaHumid heat | 55.1Humid heat, aging population and dense urban surfaces. |
| 91 | OsakaJapan | Japan · East AsiaHumid heat | 54.7Humid heat and urban heat island effects. |
| 92 | SeoulSouth Korea | South Korea · East AsiaHeatwave risk | 54.2Increasing heatwave concern in dense districts. |
| 93 | BeijingChina | China · East AsiaHeatwave risk | 53.8Hot spells and dense transport exposure. |
| 94 | BrisbaneAustralia | Australia · OceaniaHumid heat | 53.4Humid summer heat and outdoor exposure. |
| 95 | PerthAustralia | Australia · OceaniaDry heat | 53.0Hot dry summer spells and wildfire context. |
| 96 | AdelaideAustralia | Australia · OceaniaDry heat | 52.6Heatwave-prone southern Australian city. |
| 97 | MelbourneAustralia | Australia · OceaniaHeatwave risk | 52.1Short but dangerous heatwave episodes. |
| 98 | SydneyAustralia | Australia · OceaniaHeatwave risk | 51.7Western suburbs face higher heat than coast. |
| 99 | Los AngelesUnited States | United States · North AmericaHeatwave risk | 51.3Inland heat differences and urban heat islands. |
| 100 | New OrleansUnited States | United States · North AmericaHumid heat | 50.9Humid Gulf heat and infrastructure sensitivity. |
The index is based on public climate-risk research, urban heat evidence, heatwave records, population exposure and adaptation indicators. Data coverage: public evidence from 2020–2025, used for the 2026 summer edition. Values are rounded to one decimal point.
Chart 2. Heat exposure vs adaptation capacity
Heat exposure and preparedness do not always move together. Dubai, Singapore and Tokyo have high exposure but comparatively stronger adaptation systems. Basra, Khartoum, Niamey and N'Djamena are more vulnerable because severe heat overlaps with weaker cooling access, health capacity or infrastructure resilience.
Chart fallback interpretation
Cities in the upper-right part of the chart have high heat exposure and stronger adaptation capacity. Cities in the lower-right part are the most worrying: high heat risk combined with weaker adaptive capacity.
Methodology
The Summer Heat Risk Index is a composite score designed to compare city-level summer heat exposure and practical vulnerability. It does not claim to be an official meteorological ranking. The index combines climate intensity, urban form and adaptation factors because the real risk of summer heat depends on more than the daily maximum temperature.
The index separates hazard, exposure and vulnerability. Hazard covers heat intensity, humidity, heatwave frequency and night-time heat; exposure covers population density, tourism, transport and outdoor activity; vulnerability and adaptation cover cooling access, health readiness, shade, green space and power-grid resilience.
Typical summer maximum temperatures, recent hot-season extremes and the likelihood of repeated very hot days.
Evidence of multi-day extreme heat events, recent trend signals and regional heatwave exposure.
Humid air reduces the body’s ability to cool itself, so coastal tropical cities can be risky even when peak temperatures are lower.
Warm nights matter because they reduce recovery time for people, buildings and electricity systems.
Dense construction, asphalt, low tree canopy and poor ventilation can raise urban temperatures above nearby rural areas.
Urban trees, parks, water bodies and shade structures reduce heat exposure at street level.
Population density, age structure, outdoor work, cooling access, health-system readiness and power-grid resilience change real outcomes.
Each component is normalized to a common 0–100 scale, weighted, then rounded to one decimal point for readability.
The 2026 label refers to the edition year, not to completed summer 2026 observations. Full observed summer 2026 data are not available at publication time. The ranking uses public evidence available through 2025 and applies it to the 2026 summer edition.
The main limitation is city-level comparability. Some cities have detailed official heat and health plans; others have sparse public data. A modelled index can identify relative risk patterns, but it should not replace local forecasts, city heat alerts or public-health advice during a live heatwave.
Insights: how to read the ranking
The upper end of the ranking is shaped by places where heat is both intense and persistent. In Kuwait City, Basra, Doha, Dubai, Riyadh and Muscat, the main issue is not a single record day; it is the long duration of extreme heat, limited night relief and high dependence on mechanical cooling.
South Asian cities show a different pattern. Delhi, Lahore, Karachi, Dhaka, Kolkata, Chennai and Mumbai combine heat exposure with large populations, outdoor work, transport exposure and uneven household cooling. This makes public warning systems, shaded transit stops, water access and workplace protections especially important.
In North America, the most visible contrast is between dry-heat metros and humid-heat metros. Phoenix, Las Vegas and Tucson face extremely high daytime heat and hot nights. Miami, Houston and New Orleans face lower peak temperatures but higher humidity stress, which can make outdoor activity dangerous even when the thermometer looks less extreme.
Europe’s high-risk cities sit mostly around the Mediterranean. Athens, Seville, Madrid, Rome, Naples, Marseille, Lisbon and Nicosia are not as hot as Gulf cities in a typical summer, but heatwaves, tourism pressure and aging populations increase practical risk. For European readers, the ranking is a reminder that heat adaptation is no longer only a desert-city issue.
What this means for readers
For travelers, the ranking helps identify cities where summer trips require more planning: lighter schedules, shaded routes, hydration, indoor breaks and attention to local heat alerts. A city can be attractive and still carry real heat risk during July or August.
For relocation decisions, summer heat affects more than comfort. It can change electricity bills, housing needs, transport habits, outdoor exercise, school routines and health risks for children, older adults and people with chronic conditions. A lower-rent city may become more expensive in practice if cooling demand is high and buildings are poorly insulated.
For investors and urban planners, the ranking points to infrastructure priorities: tree canopy, cool roofs, shaded public transport, reflective pavements, heat-health warning systems, cooling centers and power-grid resilience. Heat risk is increasingly a planning, health and infrastructure issue, not only a weather issue.
FAQ
Which city has the highest summer heat risk in 2026?
Kuwait City ranks first in this modelled comparison because it combines extreme summer temperatures, hot nights and very high seasonal persistence. Basra, Doha, Dubai and Riyadh follow closely.
Is summer heat risk the same as the hottest temperature?
No. A city with a lower maximum temperature can still be dangerous if humidity is high, nights stay warm, people lack cooling access or the urban heat island effect is strong.
Why can humid heat be more dangerous than dry heat?
Humidity limits sweat evaporation, which is the body’s main cooling mechanism. That is why cities such as Doha, Dubai, Karachi, Bangkok and Miami can pose serious heat stress even when their peak temperatures differ from desert cities.
Why do night-time temperatures matter?
Hot nights reduce recovery. People, buildings and energy systems get less time to cool down, which raises health risk during multi-day heatwaves.
Can wealthy cities still be high-risk?
Yes. Wealthier cities may have better adaptation capacity, but high exposure can still create risk. Dubai, Abu Dhabi, Phoenix, Singapore and Tokyo show that strong infrastructure reduces harm but does not erase heat exposure.
Is this ranking useful for summer travel?
Yes, especially for timing and itinerary planning. In high-risk cities, travelers should avoid long outdoor activity during peak heat, check local warnings and plan shaded or indoor breaks.
Can cities reduce their heat risk?
Yes. Tree canopy, shaded streets, cool roofs, reflective surfaces, cooling centers, heat alerts, worker protections and resilient electricity systems can reduce practical risk even in hot climates.
Why is this a modelled index rather than an official list?
No single global official dataset ranks all major cities by summer heat risk using the same method. A composite index is necessary to compare temperature, humidity, heatwaves, urban form and vulnerability in one readable framework.
Sources and technical references
The method combines climate-risk research, urban heat studies, heatwave records and adaptation indicators. The sources below explain the evidence base behind heat intensity, humidity, urban heat islands, population exposure and adaptation capacity.
Provides urban heat island methodology, neighborhood heat mapping context and evidence on built surfaces, shade and local exposure.
https://heat.gov/urban-heat-islands-mapping-campaign-program/Provides satellite-based heat context, global heat danger research, humidity relevance and urban heat island interpretation.
https://www.earthdata.nasa.gov/topics/human-dimensions/heatSupplies broader climate context, recent global temperature records and evidence on the increasing relevance of extreme heat.
https://wmo.int/publication-series/state-of-global-climate/state-of-global-climate-2025Supports recent European and global heat context, including the warm decade and regional summer heat patterns.
https://climate.copernicus.eu/Supports the public-health and labor-exposure interpretation of extreme heat risk.
https://www.who.int/news/item/22-08-2025-who-wmo-issue-new-report-and-guidance-to-protect-workers-from-increasing-heat-stressAdds global urban heat island framing and evidence on satellite-observed land surface temperature differences.
https://geospatial.yale.edu/global-surface-uhi-explorerProvides country-level climate risk context and long-run climate indicators relevant to heat exposure.
https://climateknowledgeportal.worldbank.org/