Top Countries by Average Annual Working Hours in 2025
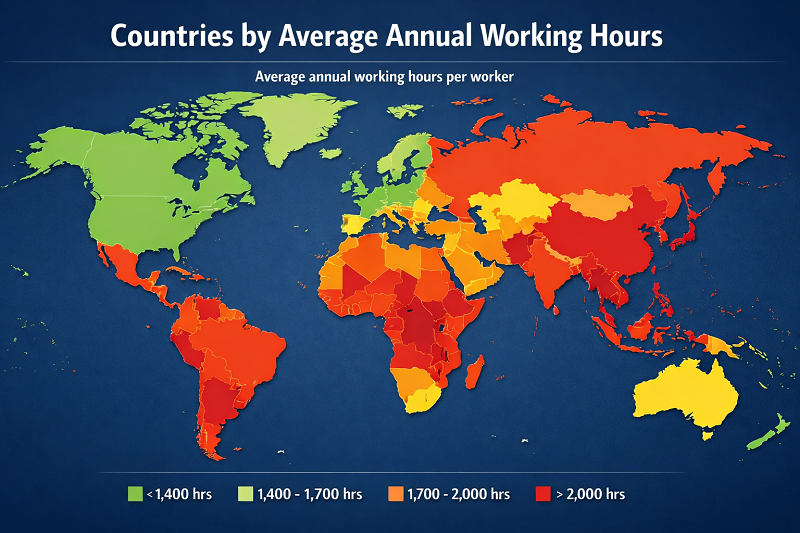
Top Countries by Average Annual Working Hours, 2025
Average annual working hours is a deceptively simple labour indicator. At first glance it looks like a straight ranking of who works more and who works less. In reality it says something deeper about how economies use labour. A high reading can reflect longer schedules, weak productivity, low part-time prevalence, informality, self-employment, or narrower institutional protection around leave. A lower reading can reflect high output per hour, more paid leave, broader flexible work arrangements and a labour market that creates more value without requiring as much time on the job.
That is why annual working hours works best here as a structural indicator, not as a morality tale about effort. The ranking below uses the latest broad comparable cross-country annual-hours series, which currently runs through 2023, and reads it as the closest defensible 2025 snapshot. OECD and Eurostat releases are used as official cross-checks for advanced economies and for current European context.
Sudan leads the latest comparable country table used on this page.
Denmark sits at the bottom, narrowly below Norway and Germany.
Colombia remains the high end of the OECD annual-hours series, which reinforces the broader pattern seen in the global ranking.
Eurostat reported Greece as the highest and the Netherlands as the lowest for actual weekly hours worked in the main job in 2024.
Why the indicator matters: annual hours capture the full year rather than just the headline workweek. They reflect leave, absences, part-time arrangements and how labour markets actually operate in practice.
Top 10 countries by average annual working hours
The top of the ranking is concentrated in economies where annual labour input per worker remains unusually heavy. Several are emerging or developing economies where long time at work coexists with weaker output per hour, smaller part-time segments and narrower institutional buffers around leave. The list also includes Gulf economies where labour-market intensity stays high even at relatively strong income levels. The headline pattern is clear: this is a ranking of labour input, not of labour quality.
The highest reading in the ranking underscores how heavy annual labour input can become in economies where long schedules and labour intensity remain structural rather than occasional.
A high-income exception with a distinctly long-hours profile. The figure fits a labour market shaped by business intensity and limited part-time prevalence.
Jordan remains near the top of the latest comparable distribution, which is a reminder that working-time pressure can stay high well outside the largest emerging markets.
One of the most important cases in the table because the long-hours pattern is also confirmed by official OECD annual-hours data.
Pakistan shares the same reading as Colombia in this benchmark, illustrating how different labour-market models can converge at a similar annual-hours level.
Another Gulf economy where annual working time remains very high relative to most advanced economies, even after allowing for the region’s income strength.
Lebanon still sits close to the top of the latest accessible distribution, reinforcing the point that long labour input is not confined to one sub-region.
A clear example of high annual labour input in developing Asia, where long hours often coexist with lower output per hour than in richer economies.
Bangladesh remains in the top tier for annual working time, which is why wages and productivity have to be discussed alongside the headline hours figure.
India’s position shows why this ranking should be read as a measure of labour input, not as a shortcut to judging prosperity or efficiency.
Distance between the extremes matters. Sudan’s 2,658 hours sits 1,277 hours above Denmark’s 1,381 hours. On a simple annualised basis, that is about 24.6 extra hours every week. Few macro indicators translate so directly into a reader’s sense of how different working life can feel across countries.
Top 20 countries at a glance
The top of the ranking is not uniform. Even within the first 20 positions, the spread is wide enough to show that long-hours economies are not a single type. Sudan is almost 400 annual hours above Oman at rank 20, while Singapore remains high despite having a very different economic profile from most countries around it.
Full table: 98 countries by average annual working hours
The table below shows 98 countries ranked by average annual working hours. Use search and sorting to compare countries more quickly.
| Rank | Country | Annual hours | Weekly equivalent |
|---|---|---|---|
| 1 | Sudan | 2,658 | 51.1 |
| 2 | United Arab Emirates | 2,514 | 48.3 |
| 3 | Jordan | 2,483 | 47.8 |
| 4 | Colombia | 2,471 | 47.5 |
| 4 | Pakistan | 2,471 | 47.5 |
| 6 | Qatar | 2,435 | 46.8 |
| 7 | Lebanon | 2,412 | 46.4 |
| 8 | Cambodia | 2,389 | 45.9 |
| 9 | Bangladesh | 2,383 | 45.8 |
| 9 | India | 2,383 | 45.8 |
| 11 | Egypt | 2,369 | 45.6 |
| 12 | Burkina Faso | 2,356 | 45.3 |
| 13 | Senegal | 2,335 | 44.9 |
| 14 | China | 2,328 | 44.8 |
| 15 | Kuwait | 2,318 | 44.6 |
| 16 | Zimbabwe | 2,311 | 44.4 |
| 17 | Malaysia | 2,308 | 44.4 |
| 18 | Tunisia | 2,288 | 44.0 |
| 19 | Singapore | 2,283 | 43.9 |
| 20 | Oman | 2,266 | 43.6 |
| 21 | Iran | 2,246 | 43.2 |
| 22 | Mali | 2,243 | 43.1 |
| 23 | Algeria | 2,232 | 42.9 |
| 24 | Zambia | 2,200 | 42.3 |
| 25 | Myanmar | 2,197 | 42.2 |
| 26 | Cameroon | 2,181 | 41.9 |
| 26 | South Africa | 2,181 | 41.9 |
| 28 | Costa Rica | 2,177 | 41.9 |
| 28 | Thailand | 2,177 | 41.9 |
| 30 | Gabon | 2,174 | 41.8 |
| 30 | Morocco | 2,174 | 41.8 |
| 32 | Vietnam | 2,160 | 41.5 |
| 33 | Albania | 2,152 | 41.4 |
| 34 | Guatemala | 2,151 | 41.4 |
| 35 | Peru | 2,143 | 41.2 |
| 36 | Mexico | 2,137 | 41.1 |
| 37 | Tanzania | 2,129 | 40.9 |
| 38 | Uganda | 2,128 | 40.9 |
| 39 | Saudi Arabia | 2,125 | 40.9 |
| 40 | Paraguay | 2,123 | 40.8 |
| 41 | Bosnia and Herzegovina | 2,122 | 40.8 |
| 42 | Angola | 2,115 | 40.7 |
| 43 | Côte d’Ivoire | 2,103 | 40.4 |
| 44 | Uzbekistan | 2,099 | 40.4 |
| 45 | Philippines | 2,096 | 40.3 |
| 46 | Russia | 2,087 | 40.1 |
| 47 | Dominican Republic | 2,072 | 39.8 |
| 48 | Nigeria | 2,062 | 39.7 |
| 49 | Sri Lanka | 2,053 | 39.5 |
| 50 | Bahrain | 2,052 | 39.5 |
| 51 | Ukraine | 2,045 | 39.3 |
| 52 | Greece | 2,036 | 39.2 |
| 53 | Kenya | 2,035 | 39.1 |
| 54 | Taiwan | 2,032 | 39.1 |
| 55 | Poland | 2,023 | 38.9 |
| 56 | Indonesia | 2,020 | 38.8 |
| 57 | South Korea | 1,980 | 38.1 |
| 58 | Malta | 1,915 | 36.8 |
| 59 | Chile | 1,914 | 36.8 |
| 60 | Israel | 1,901 | 36.6 |
| 61 | Lithuania | 1,886 | 36.3 |
| 62 | Latvia | 1,865 | 35.9 |
| 62 | Portugal | 1,865 | 35.9 |
| 64 | Turkey | 1,832 | 35.2 |
| 65 | Croatia | 1,831 | 35.2 |
| 66 | Cyprus | 1,805 | 34.7 |
| 67 | Estonia | 1,797 | 34.6 |
| 68 | Romania | 1,792 | 34.5 |
| 69 | Czechia | 1,788 | 34.4 |
| 70 | New Zealand | 1,779 | 34.2 |
| 71 | Ireland | 1,772 | 34.1 |
| 72 | United States | 1,765 | 33.9 |
| 73 | Australia | 1,727 | 33.2 |
| 74 | Hungary | 1,725 | 33.2 |
| 75 | Italy | 1,718 | 33.0 |
| 76 | Brazil | 1,708 | 32.8 |
| 77 | Slovakia | 1,695 | 32.6 |
| 78 | Japan | 1,691 | 32.5 |
| 79 | Canada | 1,689 | 32.5 |
| 80 | Spain | 1,686 | 32.4 |
| 81 | United Kingdom | 1,668 | 32.1 |
| 82 | Bulgaria | 1,645 | 31.6 |
| 83 | Austria | 1,611 | 31.0 |
| 84 | Argentina | 1,609 | 30.9 |
| 85 | Sweden | 1,605 | 30.9 |
| 86 | Slovenia | 1,593 | 30.6 |
| 87 | Finland | 1,591 | 30.6 |
| 88 | Belgium | 1,586 | 30.5 |
| 89 | Switzerland | 1,557 | 29.9 |
| 90 | Ecuador | 1,552 | 29.8 |
| 91 | Uruguay | 1,533 | 29.5 |
| 92 | Luxembourg | 1,506 | 29.0 |
| 93 | France | 1,505 | 28.9 |
| 94 | Iceland | 1,454 | 28.0 |
| 95 | Netherlands | 1,440 | 27.7 |
| 96 | Germany | 1,386 | 26.7 |
| 97 | Norway | 1,384 | 26.6 |
| 98 | Denmark | 1,381 | 26.6 |
Weekly equivalent is shown only as a reader-friendly annual-hours ÷ 52 conversion. It is useful for orientation, but it is not a substitute for official weekly-hours methodology.
Insights and conclusions
The ranking becomes much more useful once it is read against productivity rather than in isolation. The countries near the top are not automatically the most dynamic or the most prosperous. In many cases they are places where more labour time is required to generate income because output per hour, capital intensity, sector mix or labour institutions do not support shorter schedules. That is the central reason annual hours should never be mistaken for a proxy for economic strength.
Western and Northern Europe tell the opposite story. Denmark, Norway, Germany, the Netherlands, Iceland and France all sit near the bottom of the table, yet these are not weak labour markets. They are labour markets where productivity per hour, leave structures and part-time arrangements reduce the need for long annual schedules. Eurostat’s 2024 weekly-hours release fits the same pattern, which makes the low-hours European profile look structural rather than accidental.
Latin America is one of the most interesting regional contrasts in the data. Colombia and Costa Rica remain clear long-hours economies, Mexico is still elevated, but Uruguay sits far lower and Chile is much closer to the middle than to the extreme top. That split matters because broad regional stereotypes can hide very different ways of organising labour, leisure and output.
There are also important high-income exceptions. Singapore, the United Arab Emirates, Qatar and Kuwait show that long annual working time can coexist with relatively strong income levels. In those cases, the explanation is not “harder-working societies” in a simplistic sense. It is a mix of labour-market intensity, business structure, migrant-labour systems and competitive service environments that keep time on the job elevated even where incomes are comparatively high.
Core takeaway: if one economy works 500 or 800 more hours per worker than another, that does not prove it is more efficient or more successful. It may simply mean it needs much more labour time to produce the same, or even less, output.
Methodology
The ranking is built from the latest broad cross-country annual-hours-per-worker series that is publicly available in a consistent format. At the time of publication, that series runs through 2023. There is no single harmonised official global release that already publishes a definitive 2025 country ranking of annual hours worked, so using the latest complete comparable benchmark is the most defensible way to produce a 2025 snapshot.
The main ranking layer comes from the public annual working hours per worker series published via Our World in Data. That is the source used for the country table. OECD material is used to validate the pattern inside the advanced-economy group, especially the long-hours position of Colombia, Mexico and Costa Rica and the low-hours readings of Germany and the Nordic countries. Eurostat is used separately for current weekly-hours context inside Europe.
Values are rounded to whole hours, and the weekly equivalent is shown only as a reader aid. This ranking is designed for comparison, not as a substitute for each source’s full statistical methodology.
The main limitation is comparability. Working-time statistics are shaped by how countries treat part-time work, self-employment, absences, leave, second jobs, informality and the distinction between actual and usual hours. That is why the ranking works well as a macro comparison tool, but it should not be read as a legal statement of each country’s standard workweek.
What this means for readers
If you are comparing countries for work, migration or business expansion, annual hours help separate headline income from the lived shape of working life. Two labour markets can look attractive on paper and still feel radically different once schedule intensity, leave culture and part-time options are taken into account.
For employers and investors, the ranking is a useful warning against lazy assumptions. A high-hours economy is not automatically a more efficient one. In some cases it signals greater dependence on labour time rather than on productivity, capital deepening or process quality. Over time that can affect retention, burnout, wage pressure and staffing resilience.
For policy readers, the indicator is strongest when paired with hourly productivity, wages, labour-force participation, part-time prevalence and health evidence on overwork. A country that reduces annual hours without losing output may be moving toward a better labour model, not away from competitiveness.
FAQ
Why is this presented as a 2025 ranking if the main annual-hours series runs through 2023?
Because there is no single official global release that already publishes a harmonised 2025 ranking of annual hours worked across a broad country sample. The most reliable approach is to use the latest full comparable benchmark as the closest 2025 snapshot, then cross-check advanced economies with OECD and Eurostat releases.
Does a higher annual-hours figure mean workers in that country are more productive?
No. Long annual working time often signals the opposite: more labour time is needed to generate a given level of output. Productivity depends on capital intensity, technology, sector mix, skills and management quality, not on time spent at work alone.
Why do Denmark, Norway, Germany and the Netherlands appear near the bottom?
Because low annual hours can coexist with strong economies. These labour markets combine high output per hour, broader leave, more flexible part-time options and institutions that do not rely on very long schedules to sustain income and production.
Why are Singapore, the United Arab Emirates and Qatar still so high despite being relatively rich?
They are important exceptions to the usual rich-country pattern. Their labour markets are more time-intensive than those of much of Western Europe, and in the Gulf cases migrant-labour structures and business intensity also help keep annual working time elevated.
Is average annual working hours the same thing as the legal workweek?
No. Annual hours reflect time actually worked across the whole year. Legal weekly limits, overtime, paid leave, sick leave, part-time work, absences and multiple jobs all affect the annual result.
Can very long working hours become a health risk rather than just a labour-market characteristic?
Yes. WHO and ILO have linked very long working time, especially 55 hours or more per week, with a higher risk of stroke and ischemic heart disease. That is why a long-hours ranking should never be read as a simple badge of economic strength.
Why can OECD, Eurostat and broad global annual-hours datasets show different numbers for the same country?
Because they are different statistical products. They vary by country coverage, reference year, survey design, treatment of absences and the distinction between annual hours and weekly hours. That is why the ranking uses one source for the table and official OECD and Eurostat releases for context and validation.
Sources
- Our World in Data — Annual working hours per worker. Main cross-country series used for the ranking layer.
https://ourworldindata.org/grapher/annual-working-hours-per-worker - OECD — Hours worked. Official definition of annual hours actually worked per worker and OECD reference framework.
https://www.oecd.org/en/data/indicators/hours-worked.html - OECD Data Explorer — Average annual hours actually worked per worker. Official cross-check for OECD economies such as Colombia, Mexico, Costa Rica and Germany.
https://data-explorer.oecd.org/vis?df%5Bag%5D=OECD.ELS.SAE&df%5Bds%5D=DisseminateFinalDMZ&df%5Bid%5D=DSD_HW%40DF_AVG_ANN_HRS_WKD&df%5Bvs%5D=1.0&lc=en - Eurostat — People in the EU worked on average 36 hours per week. 2024 EU context, including Greece at 39.8 hours and the Netherlands at 32.1 hours.
https://ec.europa.eu/eurostat/web/products-eurostat-news/w/ddn-20250514-1 - Eurostat — Actual and usual hours of work. Statistical background for weekly-hours interpretation in Europe.
https://ec.europa.eu/eurostat/statistics-explained/index.php?title=Actual_and_usual_hours_of_work - ILOSTAT — Working time. International labour-statistics context for working-time concepts and measurement.
https://ilostat.ilo.org/topics/working-time/ - WHO / ILO — Long working hours and health risk. Evidence linking 55+ weekly hours with higher risk of stroke and ischemic heart disease.
https://www.who.int/news/item/17-05-2021-long-working-hours-increasing-deaths-from-heart-disease-and-stroke-who-ilo
Main ranking source: Our World in Data annual working hours dataset. OECD and Eurostat are used for official context and cross-checking.