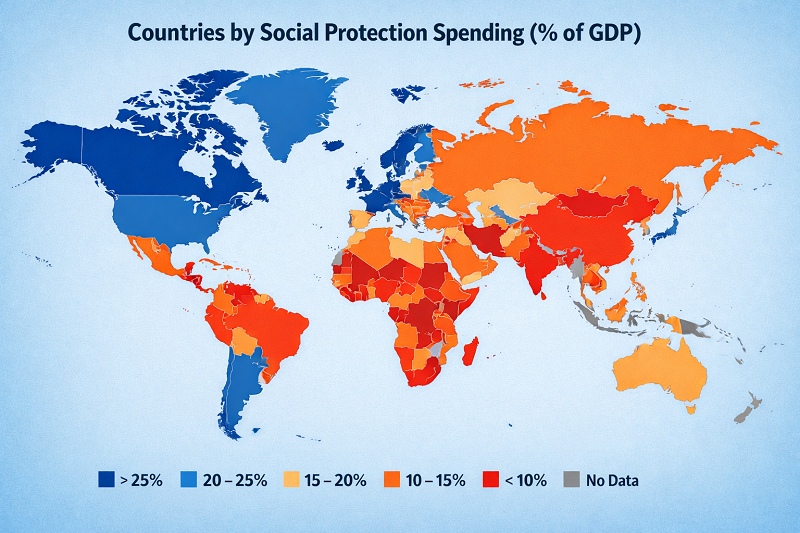
Top Countries by Social Protection Spending (% of GDP) in 2025
Economy · Budget and Taxes · Poverty · Inequality · Pensions · Aging
Social protection spending as a share of GDP is one of the clearest fiscal signals of how far a state goes in cushioning households against income shocks, disability, unemployment, old-age risks and family vulnerability. It matters because it connects macro policy to everyday outcomes: poverty reduction, pension adequacy, redistribution, labor-market resilience and the political capacity of the state to absorb social stress. This ratio is more useful than generic talk about “big” or “small” government because it shows how much national output is actually routed into the protective side of public policy.
This ranking uses the latest internationally reported values available in UNICEF’s 2025 Statistical Compendium for government expenditure on social protection as a percentage of GDP and sorts all non-missing country observations from highest to lowest. That gives a global Top 100 rather than an OECD-only view. It also produces a different hierarchy from broad OECD and Eurostat welfare-state tables, because this series is narrower and reporting coverage is less complete. The result is a cleaner comparison of the reported cross-country social protection effort in this specific international series.
Top 10 countries by social protection spending (% of GDP), 2025 snapshot
The upper end of the ranking is led by Georgia at 9.3% of GDP, followed by Lesotho at 5.6%, Ukraine at 5.4% and Timor-Leste at 5.3%. Kosovo (UNSCR 1244) and South Africa both stand at 4.6%, while Dominica, Trinidad and Tobago, Chile and Colombia complete the top ten. This is not the same pattern as a broad Western European welfare-state league table.
Within this Top 100, the average reported value is 1.66% of GDP and the median is 1.3%. That tells you how top-heavy the distribution is. A few countries sit far above the rest, while a large share of the table clusters between about 0.4% and 2.0% of GDP.
Top 100 countries by social protection spending (% of GDP)
Ranking includes only countries and territories with a reported non-missing value in the UNICEF Table 19 column “On social protection” under government expenditure as a share of GDP. Entries marked with a dash in the source are excluded from the ranking rather than being treated as zero.
| Rank | Country | Spending (% of GDP) |
|---|---|---|
| 1 | Georgia | 9.3% |
| 2 | Lesotho | 5.6% |
| 3 | Ukraine | 5.4% |
| 4 | Timor-Leste | 5.3% |
| 5 | Kosovo (UNSCR 1244) | 4.6% |
| 6 | South Africa | 4.6% |
| 7 | Dominica | 4.1% |
| 8 | Trinidad and Tobago | 3.7% |
| 9 | Chile | 3.5% |
| 10 | Colombia | 3.4% |
| 11 | Argentina | 3.3% |
| 12 | Mauritius | 3.3% |
| 13 | Botswana | 3.0% |
| 14 | Egypt | 2.9% |
| 15 | Bosnia and Herzegovina | 2.8% |
| 16 | Namibia | 2.8% |
| 17 | Libya | 2.7% |
| 18 | Kyrgyzstan | 2.6% |
| 19 | Seychelles | 2.6% |
| 20 | Belarus | 2.4% |
| 21 | Algeria | 2.3% |
| 22 | Estonia | 2.3% |
| 23 | Mauritania | 2.3% |
| 24 | Mongolia | 2.2% |
| 25 | Burundi | 2.1% |
| 26 | Central African Republic | 2.0% |
| 27 | Grenada | 2.0% |
| 28 | Morocco | 2.0% |
| 29 | Albania | 1.9% |
| 30 | Bolivia (Plurinational State of) | 1.9% |
| 31 | Mozambique | 1.9% |
| 32 | Hungary | 1.8% |
| 33 | Montenegro | 1.8% |
| 34 | North Macedonia | 1.8% |
| 35 | Maldives | 1.7% |
| 36 | Kazakhstan | 1.6% |
| 37 | Mexico | 1.6% |
| 38 | Nepal | 1.6% |
| 39 | Thailand | 1.6% |
| 40 | Viet Nam | 1.6% |
| 41 | Armenia | 1.5% |
| 42 | Jamaica | 1.5% |
| 43 | Afghanistan | 1.4% |
| 44 | Burkina Faso | 1.4% |
| 45 | El Salvador | 1.4% |
| 46 | India | 1.4% |
| 47 | Brazil | 1.3% |
| 48 | Dominican Republic | 1.3% |
| 49 | Guatemala | 1.3% |
| 50 | Iraq | 1.3% |
| 51 | Kiribati | 1.3% |
| 52 | Paraguay | 1.3% |
| 53 | Peru | 1.2% |
| 54 | Romania | 1.2% |
| 55 | Russian Federation | 1.2% |
| 56 | Bulgaria | 1.1% |
| 57 | China | 1.1% |
| 58 | Republic of Moldova | 1.1% |
| 59 | Türkiye | 1.1% |
| 60 | Uruguay | 1.1% |
| 61 | Bhutan | 1.0% |
| 62 | Ecuador | 1.0% |
| 63 | Jordan | 1.0% |
| 64 | Latvia | 1.0% |
| 65 | Poland | 1.0% |
| 66 | Sierra Leone | 1.0% |
| 67 | Cambodia | 0.9% |
| 68 | Guinea | 0.9% |
| 69 | Sudan | 0.9% |
| 70 | Bangladesh | 0.8% |
| 71 | Czechia | 0.8% |
| 72 | Panama | 0.8% |
| 73 | Tajikistan | 0.8% |
| 74 | Uzbekistan | 0.8% |
| 75 | Democratic Republic of the Congo | 0.7% |
| 76 | Ethiopia | 0.7% |
| 77 | Fiji | 0.7% |
| 78 | Rwanda | 0.7% |
| 79 | Azerbaijan | 0.6% |
| 80 | Indonesia | 0.6% |
| 81 | Malaysia | 0.6% |
| 82 | Mali | 0.6% |
| 83 | Angola | 0.5% |
| 84 | Philippines | 0.5% |
| 85 | Tunisia | 0.5% |
| 86 | Benin | 0.4% |
| 87 | Comoros | 0.4% |
| 88 | Congo | 0.4% |
| 89 | Kenya | 0.4% |
| 90 | Niger | 0.4% |
| 91 | Pakistan | 0.4% |
| 92 | Sri Lanka | 0.4% |
| 93 | Uganda | 0.4% |
| 94 | Djibouti | 0.3% |
| 95 | Honduras | 0.3% |
| 96 | Zimbabwe | 0.3% |
| 97 | Côte d'Ivoire | 0.2% |
| 98 | Madagascar | 0.2% |
| 99 | Somalia | 0.2% |
| 100 | United Republic of Tanzania | 0.2% |
Bottom edge of the Top 100 starts at 0.2% of GDP in this reporting cycle. Countries below the cut-off are those with lower reported values or with no reported value in the source table.
Methodology
The methodology uses a 2025 snapshot rather than assuming that every country already has a finalized 2025 fiscal-year outcome. The base source is UNICEF’s 2025 Statistical Compendium, Table 19: Economic Indicators. In that table, government expenditure on social protection is reported as a percentage of GDP and the relevant observation window is labeled “2015–2023 (R),” where “R” indicates the most recent year available during the period. This means the exact underlying year can differ across countries, but the series is still internationally compiled and comparable enough for cross-country comparison.
UNICEF’s general note explains that the statistical tables reflect information compiled and updated from January through October 2024, and the main source note for Table 19 states that the government expenditure data come from the World Development Indicators with a last update in April 2024. The ranking uses the reported country values in the “On social protection” column, excludes rows marked as missing, and sorts the remaining observations from highest to lowest to form the Top 100.
A second methodological limitation matters even more: this indicator is narrower than the broadest OECD and Eurostat social expenditure measures. Broad public social spending tables include large mature welfare states such as Austria, Finland and France at the top of the distribution, often around or above 30% of GDP in recent official releases. That does not contradict this ranking. It shows that different international datasets measure different layers of the welfare state. The analysis stays faithful to one global series rather than merging unlike concepts into a misleading hybrid table.
Insights and takeaways
One clear insight is that social protection effort does not map neatly onto income level. Georgia, Lesotho and Timor-Leste do not appear at the top of the ranking because they are the richest countries in the world. They rank highly because, in this specific official reporting series, social protection absorbs an unusually large share of GDP. That can happen because a country has an expansive transfer architecture, because its economy is small relative to its obligations, or because both forces are operating at once.
A second insight is that conflict, fragility and fiscal stress can push countries higher in the ranking. Ukraine’s 5.4% illustrates this pattern. In crisis conditions, social needs intensify while the denominator — GDP — may weaken. The result is a higher ratio that reflects both policy choice and macro stress. That is why this indicator should not be read as a simple generosity score.
A third insight is the extent of regional diversity. The top of the table is not just Europe, not just Africa, and not just Latin America. It is a mixed group of post-socialist systems, Southern African redistributive states, small islands, middle-income Latin American economies and conflict-affected countries. That makes the ranking more analytically valuable than a standard rich-country welfare list.
A fourth insight is that most of the table sits at relatively low levels. Once the first few outliers are removed, the distribution flattens fast. A country can still make the Top 100 with a value near 0.2% of GDP. That indicates two things at once: coverage in this particular series is limited, and the fiscal space devoted to reported social protection remains modest in much of the developing world.
- High ratios can reflect policy design, crisis conditions, weak GDP growth or a combination of all three.
- The latest reported leaders are more geographically mixed than classic OECD welfare-state tables.
- The gap between the top of the table and the median is very large, showing a strongly skewed distribution.
- Broader social expenditure datasets and this narrower global reporting series should not be treated as interchangeable.
What this means for readers
For readers following poverty and inequality, this ranking shows where the state is placing a visible macroeconomic weight behind social cushioning. A higher ratio does not guarantee better targeting or better delivery, but it does tell you that social protection is not fiscally marginal.
For readers focused on pensions and aging, the indicator is an important fiscal signal. Once social protection consumes a larger share of GDP, governments eventually face trade-offs over taxes, pension ages, indexation rules, eligibility thresholds and debt sustainability. In older societies, these are structural questions, not temporary ones.
For business and investment readers, the ratio helps frame future tax and reform pressure. Countries with larger social commitments often face sharper debates over payroll burdens, pension financing and public spending efficiency. At the same time, stronger social floors can support household demand and reduce social volatility.
For internationally mobile workers and households, the number is useful as context rather than a promise. A country may spend more on social protection and still require long contribution histories, strict residency tests or narrow eligibility. The ratio tells you where the state sits in the economy, not whether every resident can easily access the system.
FAQ
Why is Georgia first in this ranking?
Because in the latest internationally reported observation used in this ranking, Georgia’s social protection expenditure equals 9.3% of GDP. That is unusually high for this specific series and puts it well above the rest of the table.
Why do countries like France or Finland not dominate this table?
In broader OECD and Eurostat social spending statistics they do sit at the top. This ranking is based on a narrower globally reported UNICEF/WDI series, so the hierarchy looks different. Different datasets capture different definitions and different reporting coverage.
Does a higher ratio always mean a better welfare state?
No. A higher ratio means a larger share of GDP is devoted to reported social protection, but it does not tell you whether the system is efficient, well-targeted, corruption-resistant or easy to access.
Can war or recession push a country up the ranking?
Yes. Social spending ratios can rise because spending increases, because GDP falls, or because both happen together. That is why crisis-affected countries can rank high even without resembling classic high-income welfare states.
Why are countries with missing values excluded instead of shown as zero?
Because a dash in the source means data not available, not zero spending. Treating missing observations as zero would distort the ranking and create a false bottom of the table.
What should this metric be combined with?
Poverty rates, labor informality, pension coverage, demographic dependency ratios, public debt and social insurance design. On its own, the ratio is informative. Combined with those indicators, it becomes much more explanatory.
Sources
-
UNICEF — The State of the World’s Children 2025, Statistical Compendium, Table 19
Primary source for the ranking. The Top 100 table above is built from the reported country values in the “On social protection” column under government expenditure as a percentage of GDP.
UNICEF Statistical Compendium PDF -
OECD — Social spending
Used to explain why broader public social spending rankings place mature European welfare states much higher than this narrower global UNICEF-based series.
OECD social spending overview -
Eurostat — Early estimates on social protection benefits in 2024
Used for current EU context on broad social protection benefits as a share of GDP.
Eurostat 2024 early estimates -
ILO — World Social Protection Report 2024–26: In figures
Used for global context on average social protection expenditure and the difference between excluding healthcare and total social protection spending.
ILO in figures
The ranking is built from the latest reported country values in the current international reporting cycle. Countries with no reported value in the source column are excluded rather than assigned a zero.