

Top 10 countries for the production of reinforcement bars and structural steel in 2025
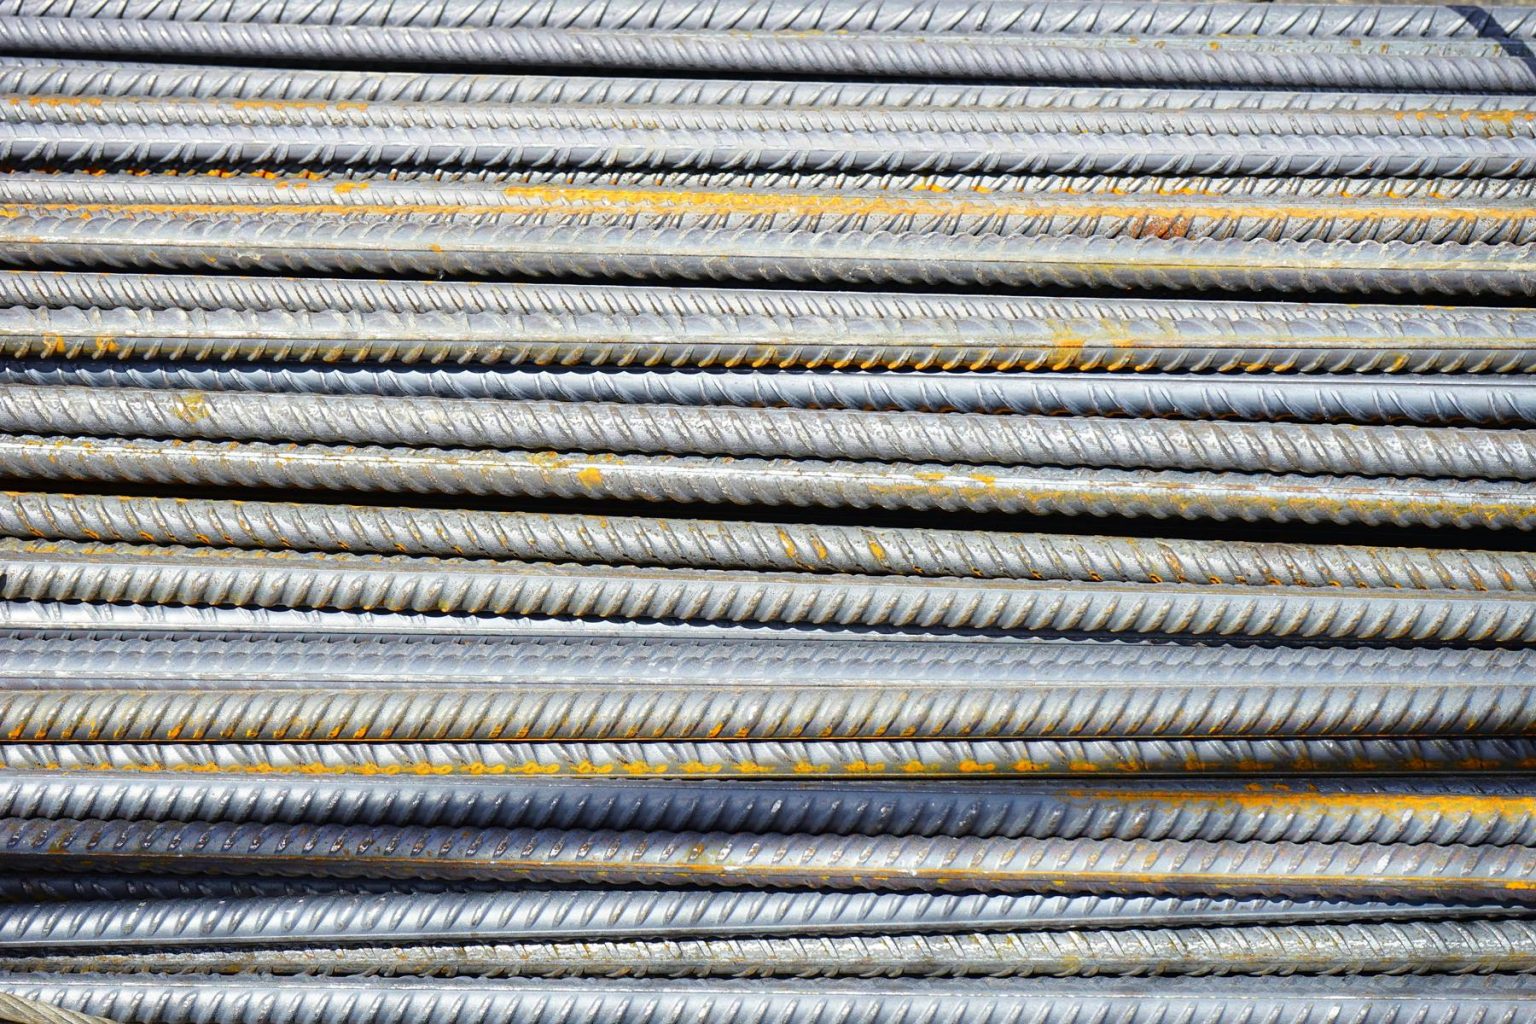
This ranking uses crude steel output as the most reliable country-level proxy for rebar and structural steel supply. No comparable global database tracks rebar-only production by country on a standardised basis, so crude steel remains the best cross-country benchmark for scale, capacity and market weight.
Using confirmed 2024 worldsteel data together with full-year 2025 totals reported in January 2026, the market remained highly concentrated. Global crude steel production reached 1,849.4 Mt in 2025, down from 1,882.6 Mt in 2024, while China still accounted for more than half of world output.
Methodology and data notes
All figures refer to crude steel production reported by the World Steel Association. That is broader than rebar alone, but it is the most consistent global measure of steelmaking scale. Countries with construction-heavy output mixes, such as China, India, Türkiye and Iran, tend to devote a larger share of crude steel to long products including rebar. Countries such as Japan, South Korea and Germany are more tilted toward flat steel and engineering-grade products.
Global steel at a glance
Top 10 steel producers in 2025
The order below follows full-year 2025 totals. The production figures in the KPI lines show confirmed 2024 output and the 2024 year-on-year change, while the country notes explain how each producer fits into the broader rebar and structural steel landscape.
China remained overwhelmingly dominant in both 2024 and 2025. Its scale still defines global pricing power, especially when weak domestic construction pushes more tonnage into export markets. China is also one of the most rebar-intensive major steel systems because of its historically construction-heavy demand profile.
India is the strongest structural growth story in the ranking. Infrastructure, housing and industrial expansion continue to lift domestic demand, and a large share of output feeds long products such as rebar. In 2025, India widened its lead over all producers except China.
The United States moved ahead of Japan in the 2025 annual ranking. Its steel base is heavily electric-arc-furnace driven, which is particularly relevant for rebar and other long products. Domestic policy support and trade protection continue to shape the market environment.
Japan remains one of the world's most advanced steel producers, but its output mix is less tied to rebar than in China, India or Türkiye. Much of its strength lies in flat products, specialty grades and high-quality engineering steel rather than construction-led volume growth.
Russia stayed fifth in 2025, but output remained below pre-war levels. The country still has major industrial scale, yet sanctions, rerouted trade flows and weaker access to premium markets continue to weigh on the sector.
South Korea is a major producer relative to its size, but like Japan it is more exposed to higher-value flat products and industrial steel than to mass-market rebar. That makes its crude steel rank stronger than its direct relevance to construction steel alone.
Türkiye is one of the most important rebar-oriented producers in the Top 10. Its product mix is heavily tied to long steel, domestic construction and exports to nearby markets. That makes Türkiye more important to rebar trade than several countries that produce more crude steel overall.
Germany stayed eighth in the 2025 annual ranking, ahead of Brazil and Iran. It remains Europe's largest producer, but its market profile is centered more on industrial and automotive steel than on rebar-heavy construction demand.
Brazil recovered in 2024 and held a Top 10 position in 2025. It has a more balanced mix across construction and industrial uses, with domestic building activity still an important driver for long products and bar demand.
Iran remained in the Top 10 in 2025, but the annual total did not move it ahead of Germany or Brazil. The country's steel system is still highly relevant to regional rebar supply because a large share of output is linked to housing and infrastructure rather than flat steel for export manufacturing.
Table 1. Top 10 crude steel producers — 2024 confirmed data with 2025 totals
2024 country values come from World Steel in Figures 2025. The final column shows full-year 2025 totals from worldsteel's January 2026 release. World 2024 total: 1,882.6 Mt.
| 2025 Rank | Country | Region | 2024 Production ↕ | YoY 2024 ↕ | 2025 Total |
|---|---|---|---|---|---|
| 1 | China | Asia | 1,005.1 Mt53.39% | −2.3% | 960.8 Mt |
| 2 | India | Asia | 149.4 Mt7.94% | +6.1% | 164.9 Mt |
| 3 | United States | Americas | 79.5 Mt4.22% | −2.3% | 82.0 Mt |
| 4 | Japan | Asia | 84.0 Mt4.46% | −3.4% | 80.7 Mt |
| 5 | Russia | Europe / CIS | 71.0 Mt3.77% | −6.6% | 67.8 Mt |
| 6 | South Korea | Asia | 63.6 Mt3.38% | −4.6% | 61.9 Mt |
| 7 | Türkiye | Europe | 36.9 Mt1.96% | +9.5% | 38.1 Mt |
| 8 | Germany | Europe | 37.2 Mt1.98% | +5.1% | 34.1 Mt |
| 9 | Brazil | Americas | 33.8 Mt1.80% | +5.6% | 33.3 Mt |
| 10 | Iran | MENA | 31.4 Mt1.67% | +2.3% | 31.8 Mt |
Source: World Steel Association. Share = country 2024 output divided by the world 2024 total. The table stays fully readable without JavaScript; search, ranking view and unit switching only improve navigation.
Chart 1. Top 10 crude steel producers, 2024
Production is shown in million metric tonnes for 2024 confirmed data. China's scale is real and compresses the rest of the ranking visually; the chart does not use an artificial break in scale.
Chart 2. 2024 production versus 2024 year-on-year change
Each point combines a country's 2024 crude steel output with its 2024 versus 2023 growth rate. This helps separate the very large producers from the faster-growing construction-oriented systems.
Source: World Steel Association annual and monthly releases.
What the ranking actually shows
China still sets the tone, but the center of growth is elsewhere
China remains by far the largest steel producer in the world, yet the growth momentum is now elsewhere. India is the clearest long-term expansion story, while China's slower domestic construction cycle keeps export pressure elevated. For rebar and structural steel buyers, that means international pricing is still heavily influenced by Chinese supply conditions even when domestic Chinese demand softens.
Crude steel rank is not the same as rebar relevance
The ranking is useful, but product mix matters. Japan and South Korea sit high in crude steel output because they produce large volumes of industrial and flat steel. Türkiye and Iran, by contrast, have smaller crude steel totals but a much stronger link to long products and construction steel. That is why they matter more directly to regional rebar markets than a simple tonnage table might suggest.
The United States matters because of market structure, not only tonnage
The United States ranked third in 2025 and remains especially important for long-product economics because of its high electric-arc-furnace share and its protected domestic market. That combination affects rebar pricing, scrap demand and import opportunities very differently from more export-exposed systems.
Europe's ranking strength masks structural pressure
Germany remains a leading producer, but Europe is under pressure from energy costs, decarbonisation investment requirements and weak industrial momentum. For construction steel, that creates a growing contrast between premium regional production and lower-cost imported supply.
Practical reading of the table:
- Use China and India to understand global scale and future capacity direction.
- Use Türkiye and Iran to read regional long-product and rebar competition.
- Use the United States to understand scrap-based, tariff-protected rebar economics.
- Use Germany, Japan and South Korea as large steelmakers whose product mix is less rebar-heavy than their crude steel rank suggests.
What this means for readers
For builders and procurement teams
The ranking helps identify which countries shape supply risk and price pressure. China still dominates the background market, but Türkiye, India and regional trade barriers often matter more directly when sourcing long products for real projects.
For market analysts and investors
A country can be a large steel producer without being the most relevant rebar supplier. The better question is where crude steel growth intersects with construction demand, export orientation and electric-arc-furnace competitiveness.
For policy readers
Steel rankings also reflect industrial policy. India's rise is tied to sustained capital formation, while Europe's stagnation and Russia's weaker position illustrate how energy costs, sanctions and trade structure can reshape output even in established steel economies.
Frequently asked questions
Primary sources
The figures below are taken from official or primary industry datasets. Values shown on the page are lightly rounded for readability.
