

Global Plastic Production and Waste Management
Global plastic production and the waste-management gap
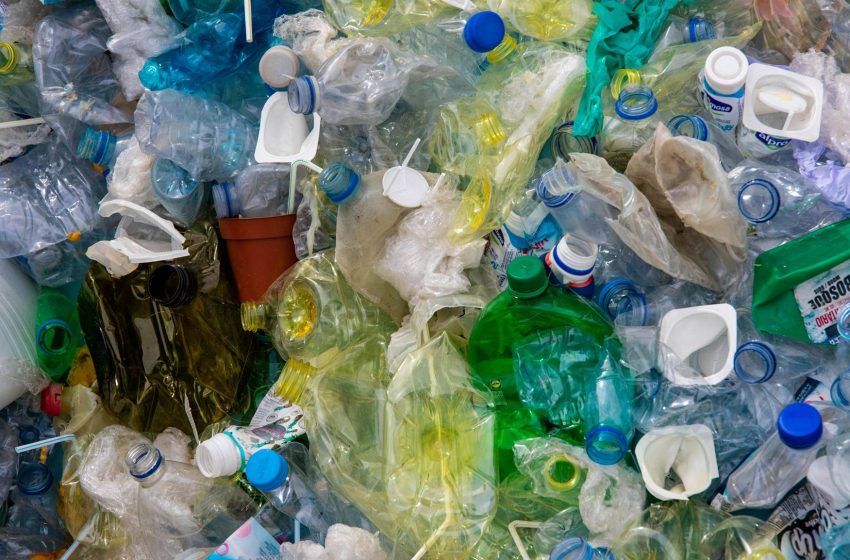
Plastics remain essential to packaging, healthcare, and construction, but waste systems have not scaled at the same pace. The result is a persistent split between what the world produces and what it can safely collect, sort, and recycle.
Scale and trend snapshot
- Global production (2023): 413.8 million metric tonnes (Mt), up ~1.6% vs 2022.
- Production concentration: Asia leads; China is the single largest producer (~32% of global output in the cited estimate).
- Where plastics go: Packaging dominates (~44%), followed by construction (~18%) and automotive (~10%).
- The structural issue: production keeps rising faster than reuse + recycling capacity, so leakage and mismanagement persist.
Plastic waste management by region (2023)
| Region | Plastic waste generated (Mt) | Mismanaged waste (Mt) | Recycling rate (%) |
|---|---|---|---|
| Asia | 180 | 90 | 8 |
| North America | 50 | 10 | 9 |
| Europe | 40 | 5 | 25 |
Notes: “Mismanaged” refers to waste not recycled, incinerated with controls, or placed in sealed sanitary landfills (definition varies by source). The regional figures shown here match the dataset summarized in the page draft.
Visualization: waste generated vs mismanaged (2023)
Bar chart; values in million tonnes (Mt). If charts are blocked, the list below remains readable.
- Asia — generated 180; mismanaged 90
- North America — generated 50; mismanaged 10
- Europe — generated 40; mismanaged 5
Methodology (how these numbers are used)
This page uses the provided 2023 production and waste metrics as the most recent full-year snapshot in the draft. Regional figures are presented as reported in the cited sources and rounded for readability. “Production” refers to polymer output (not final products), while “waste generated” reflects post-consumer waste streams and may exclude some industrial scrap depending on reporting practice. “Recycling rate” is shown as the share of plastic waste recycled, and cross-country comparability is limited by collection definitions, contamination, informal-sector recovery, and exports of waste for processing.
Limits: revisions can occur as national accounting improves; mismanagement estimates are model-based in many studies; and high-income recycling rates can be influenced by trade flows and how “recycled” is counted (collected vs actually reprocessed). Use the trends to compare directions and scale, not as precise point estimates for every jurisdiction.
Insights: what stands out in the map
- Concentration: the biggest waste volumes track population and manufacturing concentration, so Asia dominates totals.
- Capacity gap: recycling remains a minority pathway; scaling collection + sorting usually matters more than “new recycling tech” alone.
- Leakage risk: mismanaged waste is a proxy for the probability of leakage into rivers and coastal systems.
- Policy leverage: extended producer responsibility (EPR), deposit systems, and standardized packaging design can lift capture rates fastest.
What this means for the reader
- Households: the biggest impact usually comes from reducing single-use packaging and choosing easily recyclable formats (mono-material when possible).
- Businesses: packaging choices affect compliance costs and access to retailers that require recycled content and traceable recovery.
- Communities: local collection rules matter—contamination can turn “recyclable” material into landfill.
- Investors/industry: watch regulation paths (EPR, recycled-content mandates) that shift demand toward recyclate and redesign.
FAQ
Why is global recycling still so low?
Recycling depends on capture, clean sorting, and stable end-markets. Mixed polymers, additives, food contamination, and weak collection systems reduce usable yield. Even when material is collected, it may be downcycled or rejected if quality is too inconsistent.
Is banning single-use plastics enough?
Bans help in targeted categories, but system change usually comes from redesign (standard packaging formats), producer responsibility, and scale-up of collection and sorting. Without infrastructure, substitution can shift impact rather than remove it.
What does “mismanaged waste” actually indicate?
It’s a risk indicator: waste that is openly dumped, littered, or otherwise not contained is more likely to leak into waterways. Definitions vary, so compare carefully across sources.
Does “recycled” mean it becomes the same product again?
Often no. Many streams are downcycled into lower-value products due to polymer degradation and contamination. Closed-loop recycling is more feasible for simpler, cleaner streams.
Can chemical or enzymatic recycling solve the problem?
These methods can help with hard-to-recycle streams, but they are energy-intensive and still face scale, cost, and feedstock-quality constraints. They complement—not replace—collection and design changes.
What is the biggest near-term win?
Improving collection and reducing contamination through clearer rules, better bins, and packaging standardization usually delivers faster gains than relying only on new materials.
Cement: scale, emissions, and why it matters
Cement is foundational to buildings and infrastructure. The sector is also emissions-intensive because both fuel combustion and limestone calcination release CO₂. The table and charts below use the figures from the page draft to show scale and intensity.
- Global cement output (2023): ~4.1 billion tonnes.
- China’s share (cited): ~51% of global output; India ~10%; EU ~4%.
- Emissions channel: process (calcination) + energy use in kilns and grinding.
Cement production and environmental footprint (2023)
| Region | Production (Mt) | CO₂ emissions (Mt) | Electricity intensity (kWh/t) |
|---|---|---|---|
| China | 2,100 | 1,200 | 100 |
| India | 400 | 240 | 95 |
| European Union | 180 | 100 | 90 |
Notes: “Electricity intensity” captures grinding and plant operations; thermal energy in kilns is the larger energy component but is not shown in this table.
Scatter: cement production vs CO₂ emissions (2023)
Each point is a region from the table. If charts are blocked, the fallback list remains visible.
- China: 2,100 → 1,200
- India: 400 → 240
- European Union: 180 → 100
Where plastics and cement intersect
- Construction demand: plastics (pipes, insulation, coatings) ride on the same urbanization wave as cement and concrete.
- Co-processing: some systems use plastic-derived fuels in cement kilns to reduce coal use, but it requires strict controls and consistent feedstock.
- Net sustainability: the largest gains typically come from material efficiency, product design, and lower-carbon energy, not a single end-of-pipe solution.
Future outlook and policy takeaways
Without intervention, plastic production and waste are expected to keep rising, while cement demand follows urbanization and infrastructure buildout. The practical question is not whether these materials disappear, but how quickly systems can reduce leakage, lower emissions intensity, and expand circular flows.
Plastics: what works at scale
- Design for recovery: fewer polymer types, clearer labels, and standardized packaging formats improve yield and lower contamination.
- EPR and deposit systems: shifting costs to producers can fund collection and reward easy-to-recycle formats.
- Infrastructure first: collection, sorting, and safe disposal prevent leakage faster than relying only on advanced recycling.
- Targeted reduction: focus on high-leakage single-use items and hard-to-control microplastic sources where substitutes are credible.
Cement: decarbonization levers
- Lower clinker ratios: more blended cements and supplementary materials can cut emissions per tonne.
- Alternative fuels + efficiency: kiln upgrades, waste heat recovery, and better fuels reduce combustion emissions.
- Carbon capture: potentially important for process emissions, but depends on cost, power, and CO₂ transport/storage infrastructure.
- Demand-side efficiency: better design, longer life, and circular construction reduce total material needs.
Shared priority: measurable outcomes
- Track leakage reduction (not only “recyclable” claims).
- Separate “collected” from “actually reprocessed” recycling metrics.
- Report cement emissions intensity and clinker ratios transparently across markets.
Sources
-
Plastics
UNEP — Plastic Pollution
Overview of plastic pollution impacts, pathways to ecosystems, and international policy efforts. -
Plastics
US EPA — Plastics: Material-Specific Data
U.S. waste generation and recycling indicators for plastics, including category-level context. -
Cement
IEA — Cement
Global cement sector overview, energy use, and decarbonization pathways. -
Plastics
OECD — Plastics
Policy analysis and global waste-management challenges, including economic instruments. -
Data
World Bank Data
Cross-country indicators that support broader environmental and infrastructure context (definitions vary by series).


