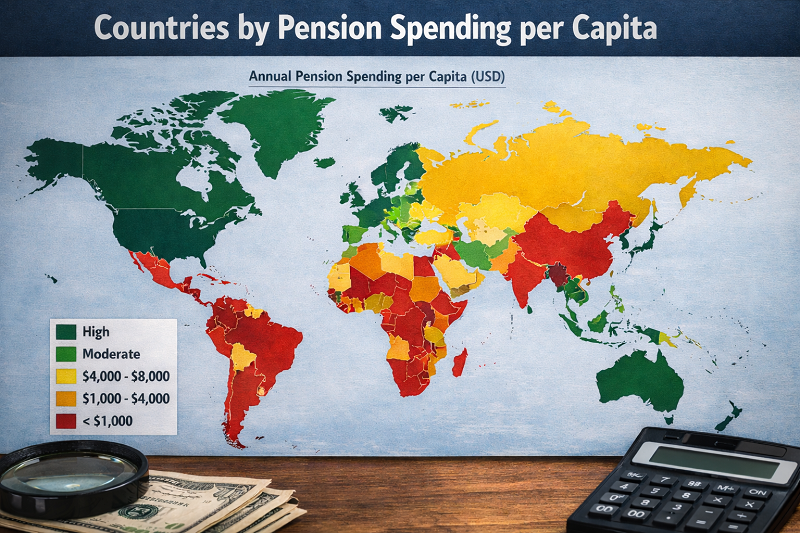
Top 100 Countries by Pension Spending per Capita, 2025
Public pension spending per capita is one of the clearest ways to compare how much fiscal capacity countries devote to supporting older populations. For an internationally comparable 2025 snapshot, this ranking estimates pension-related public spending per person by combining official public old-age expenditure ratios with the latest broad-coverage PPP income data. The result is not a measure of the average pension payment received by one retiree. It is an economy-wide per-person estimate of how large public pension spending is relative to national output and local price levels.
This matters because ageing, labour-force pressure and public-finance constraints are no longer niche policy topics. Countries with both high output per person and mature public pension systems can sustain far higher pension spending per resident than countries where fiscal space is thin, coverage is incomplete or pension systems remain modest in size. In this ranking, Europe dominates the top tier because it combines high PPP income with large old-age expenditure ratios, while many emerging economies remain well below that frontier even when they are ageing quickly.
What stands out in the top of the ranking
The upper end of the table is overwhelmingly European. 18 of the top 20 positions are held by European economies, reflecting a combination of higher income, older age structures and long-established public pension systems. Luxembourg ranks first because extremely high GDP per capita lifts the per-resident spending estimate even though its pension ratio is lower than Italy’s or France’s. Austria, Italy, France and Germany sit near the very top because they combine both ingredients: high PPP output and very large public pension spending ratios.
Another important pattern is that very rich economies do not automatically lead this ranking. Singapore, Hong Kong and Ireland sit far above most countries in income per person, yet leaner public old-age spending ratios keep them below large continental welfare states in pension spending per capita. The ranking therefore rewards fiscal commitment and system maturity, not just headline prosperity.
- Luxembourg — estimated pension spending per capita: 11,961 PPP int$.
- Austria — 10,348 PPP int$.
- Italy — 9,649 PPP int$.
- France — 8,827 PPP int$.
- Germany — 8,091 PPP int$.
- Ireland — 7,793 PPP int$.
- Sweden — 7,723 PPP int$.
- Norway — 7,561 PPP int$.
- Belgium — 7,498 PPP int$.
- Finland — 7,277 PPP int$.
Top 20 pension-spending-per-capita chart
The bars below show the estimated public pension spending per resident in PPP international dollars. They are fully embedded in HTML, so the chart remains visible even if JavaScript does not run.
Full Top 100 table
By default, the table is set to Top 20. Use the controls to switch to Top 10 or view all 100 countries.
| Rank | Country | Estimated pension spending per capita (PPP int$) | Public pension spending (% of GDP) |
|---|---|---|---|
| 1 | Luxembourg | 11,961 | 7.67% |
| 2 | Austria | 10,348 | 14.00% |
| 3 | Italy | 9,649 | 15.56% |
| 4 | France | 8,827 | 14.11% |
| 5 | Germany | 8,091 | 11.00% |
| 6 | Ireland | 7,793 | 5.84% |
| 7 | Sweden | 7,723 | 10.75% |
| 8 | Norway | 7,561 | 7.41% |
| 9 | Belgium | 7,498 | 10.20% |
| 10 | Finland | 7,277 | 11.13% |
| 11 | Malta | 7,273 | 10.41% |
| 12 | Denmark | 6,689 | 8.17% |
| 13 | Portugal | 6,444 | 12.47% |
| 14 | Switzerland | 6,330 | 6.56% |
| 15 | Slovenia | 6,268 | 10.96% |
| 16 | Cyprus | 6,244 | 9.91% |
| 17 | Japan | 6,156 | 11.83% |
| 18 | Poland | 6,069 | 11.84% |
| 19 | United States | 5,912 | 6.89% |
| 20 | Greece | 5,833 | 13.16% |
| 21 | Spain | 5,727 | 9.88% |
| 22 | Croatia | 5,252 | 10.60% |
| 23 | Netherlands | 5,231 | 6.07% |
| 24 | Hungary | 5,074 | 10.45% |
| 25 | Czechia | 4,898 | 8.55% |
| 26 | Lithuania | 4,362 | 7.89% |
| 27 | Romania | 4,353 | 8.87% |
| 28 | Serbia | 4,216 | 12.84% |
| 29 | United Kingdom | 4,192 | 6.76% |
| 30 | Estonia | 4,032 | 8.07% |
| 31 | Montenegro | 3,747 | 11.00% |
| 32 | Australia | 3,656 | 5.07% |
| 33 | Latvia | 3,641 | 8.39% |
| 34 | Slovak Republic | 3,543 | 7.36% |
| 35 | Bulgaria | 3,488 | 8.31% |
| 36 | Belarus | 3,301 | 10.00% |
| 37 | Uruguay | 3,241 | 8.90% |
| 38 | Russian Federation | 3,224 | 6.80% |
| 39 | Turkiye | 3,186 | 6.98% |
| 40 | Israel | 3,016 | 5.27% |
| 41 | Canada | 2,843 | 4.40% |
| 42 | New Zealand | 2,633 | 4.74% |
| 43 | Bosnia and Herzegovina | 2,354 | 9.40% |
| 44 | Aruba | 2,178 | 4.30% |
| 45 | North Macedonia | 2,160 | 8.00% |
| 46 | Argentina | 2,066 | 6.79% |
| 47 | Iceland | 1,871 | 2.22% |
| 48 | Kuwait | 1,836 | 3.50% |
| 49 | Brazil | 1,733 | 7.76% |
| 50 | Mauritius | 1,598 | 5.02% |
| 51 | Mongolia | 1,497 | 7.82% |
| 52 | Ukraine | 1,465 | 7.90% |
| 53 | Korea, Rep. | 1,441 | 2.36% |
| 54 | Albania | 1,388 | 5.20% |
| 55 | Moldova | 1,378 | 7.40% |
| 56 | Hong Kong SAR, China | 1,203 | 1.60% |
| 57 | Chile | 1,194 | 3.30% |
| 58 | Kazakhstan | 1,104 | 2.70% |
| 59 | Georgia | 1,103 | 3.90% |
| 60 | Singapore | 1,055 | 0.70% |
| 61 | Azerbaijan | 1,054 | 4.20% |
| 62 | Thailand | 1,038 | 4.20% |
| 63 | Trinidad and Tobago | 1,017 | 2.80% |
| 64 | Barbados | 1,013 | 4.08% |
| 65 | Algeria | 906 | 5.14% |
| 66 | Costa Rica | 859 | 2.76% |
| 67 | Antigua and Barbuda | 835 | 2.50% |
| 68 | Armenia | 831 | 3.64% |
| 69 | Jordan | 813 | 7.51% |
| 70 | Bahamas, The | 795 | 1.93% |
| 71 | China | 783 | 2.89% |
| 72 | Colombia | 782 | 3.50% |
| 73 | Iran, Islamic Rep. | 715 | 3.60% |
| 74 | Uzbekistan | 683 | 5.75% |
| 75 | Dominica | 671 | 3.15% |
| 76 | Bahrain | 669 | 1.00% |
| 77 | Marshall Islands | 583 | 7.11% |
| 78 | Egypt, Arab Rep. | 573 | 3.00% |
| 79 | Iraq | 564 | 3.90% |
| 80 | Viet Nam | 513 | 3.13% |
| 81 | Mexico | 492 | 1.88% |
| 82 | St. Kitts and Nevis | 453 | 1.30% |
| 83 | Peru | 440 | 2.47% |
| 84 | Maldives | 435 | 1.66% |
| 85 | Grenada | 404 | 2.00% |
| 86 | Namibia | 374 | 3.20% |
| 87 | Bolivia | 348 | 2.70% |
| 88 | Malaysia | 345 | 0.89% |
| 89 | St. Lucia | 331 | 1.20% |
| 90 | St. Vincent and the Grenadines | 319 | 1.50% |
| 91 | Morocco | 302 | 2.90% |
| 92 | Paraguay | 302 | 1.63% |
| 93 | Libya | 286 | 2.00% |
| 94 | Ecuador | 285 | 1.80% |
| 95 | Cabo Verde | 280 | 2.50% |
| 96 | Botswana | 269 | 1.31% |
| 97 | Sri Lanka | 263 | 1.68% |
| 98 | Angola | 253 | 2.50% |
| 99 | El Salvador | 225 | 1.70% |
| 100 | Dominican Republic | 193 | 0.70% |
Calculation: public pension or older-person cash spending ratio (% of GDP) × GDP per capita, PPP (current international dollars). Figures rounded to the nearest whole international dollar. Source logic: official ILO old-age expenditure tables plus World Bank PPP income data; used here as a harmonized 2025 analytical snapshot.
Methodology
This page uses a transparent harmonized method because there is no single official global 2025 release that already provides directly comparable pension-spending-per-capita values for all countries in the ranking. The starting point is the public spending ratio on pensions or other non-health cash benefits for older persons, expressed as a share of GDP in official International Labour Organization social protection tables. That ratio is then multiplied by the World Bank’s latest broad-coverage GDP per capita figure in PPP-adjusted current international dollars for 2024. The result is an estimated amount of pension-related public spending per resident, expressed in a unit that is more comparable across countries than nominal local currency spending.
The year choice matters. The World Bank PPP series gives a wide and current cross-country macro base for 2024, which is used here as the closest practical benchmark for a 2025 snapshot. Pension expenditure ratios do not have the same globally synchronized release pattern. In some economies the latest internationally comparable official old-age spending observation is older than 2024. To keep wide coverage and avoid inventing missing values, the page uses the latest comparable official ratios available in the ILO cross-country tables and applies them to the 2024 PPP base.
That makes the ranking analytically useful, but it also creates clear limits. First, the indicator is not the same as the average pension received by a retiree. It spreads public pension expenditure across the whole population, not only beneficiaries. Second, some official old-age ratios include broader non-health benefits for older persons, not just contributory old-age pensions in a narrow legal sense. Third, revisions to GDP, PPP factors or pension accounting rules can move countries up or down. For that reason, the ranking should be read as a cross-country spending-capacity estimate rather than as a precise budget ledger.
Insights from the ranking
The first insight is that pension spending per capita is much more concentrated than simple ageing headlines suggest. Rich European welfare states dominate because they combine large old-age expenditure ratios with high output per person. In the top 100, 46 places are held by Europe and Europe-and-Central-Asia economies, far ahead of every other region. That is not just a demographic story. It also reflects institutional depth: long contribution histories, broader formal employment bases and larger tax capacity.
The second insight is that the middle of the ranking contains a wide mix of fiscal models. Countries such as Canada, New Zealand and Australia spend meaningful amounts per resident, but they sit well below continental Europe because their public pension systems are typically smaller relative to GDP. At the same time, several upper-middle-income European countries, including Serbia, Romania and Bulgaria, rank above richer but leaner systems because their public pension burdens remain large relative to domestic output.
The third insight is that public pension spending per capita can stay modest even in economies that are rich or ageing. Singapore is the clearest example: its PPP income is among the world’s highest, yet it ranks only 60th here because its public old-age spending ratio is low by advanced-economy standards. Hong Kong shows a similar pattern. That is why the indicator is useful. It separates public pension effort from raw national prosperity.
What this means for the reader
If you are trying to understand where retirement systems appear fiscally strong, this ranking is a better starting point than a simple age-structure table. It shows where governments already devote large resources to old-age support after adjusting for price-level differences. For migrants, expats and internationally mobile workers, that can help explain why the tax-and-benefit balance feels very different across countries. For investors and policy watchers, it highlights where pension commitments are already structurally large and may keep shaping budget choices, debt dynamics and labour-market reform debates.
At the same time, the indicator should never be read in isolation. High spending per capita does not automatically mean generous outcomes for every retiree, nor does lower spending necessarily mean pension systems are failing. Coverage rules, retirement ages, private pillars, replacement rates, healthcare costs and housing conditions all change the lived experience of old age. The ranking is most useful when paired with pension adequacy, old-age poverty and demographic dependency indicators.
FAQ
Why is Luxembourg first if Italy or France spend a bigger share of GDP on pensions?
Because this ranking is per capita, not just a ratio. Luxembourg’s pension burden as a share of GDP is lower than Italy’s, but its GDP per capita is so high that the estimated amount of pension spending per resident comes out on top.
Is this the same as the average pension paid to one retiree?
No. The calculation spreads public pension expenditure across the entire population. A country can rank high here while still having wide differences between retirees, contribution histories and household circumstances.
Why do European countries dominate this list?
Because they combine three advantages at once: ageing populations, long-established public pension systems and high PPP-adjusted income per person. Many emerging economies have one or two of those ingredients, but not all three together.
Why use PPP-adjusted GDP per capita instead of nominal government spending in dollars?
PPP helps compare countries with different price levels. A nominal-dollar ranking would overstate some high-price economies and understate the real domestic purchasing power of pension-related public spending in others.
Why is this called a 2025 snapshot when some pension-ratio observations are older?
Because there is no single official global 2025 release with directly comparable pension-spending-per-capita values for 100 countries. The page uses the latest broad-coverage 2024 PPP macro base and the latest comparable official old-age expenditure ratios available across countries, then combines them into one analytical snapshot.
Can a country with a small pension ratio still rank high?
Yes. Very high income per person can lift per-capita pension spending even when the public system is relatively lean. Ireland, Singapore and Hong Kong illustrate that effect in different ways.
Sources
-
World Bank — GDP per capita, PPP (current international $)
Source
Broad-coverage PPP income series used as the 2024 macro base for the per-capita conversion. -
ILO — Social protection for older persons: key policy trends and statistics
Source
Official ILO paper with global country tables on public expenditure for older persons and pension-related social protection. -
ILO — World Social Protection Report 2024–26
Source
Used for current global context on social protection spending and regional differences in older-person expenditure. -
ILO — World Social Protection Report 2024–26: in figures
Source
Short official summary page with recent global spending context. -
OECD — Pension spending / Pensions at a Glance 2025
Source
Useful for pension-spending definitions and current OECD context, especially the distinction between old-age and survivors’ benefits.
Updated on a 2025 snapshot basis using 2024 PPP income data and the latest comparable official old-age expenditure ratios available across countries.