
Top Countries by Passenger Car Production (Units), 2025
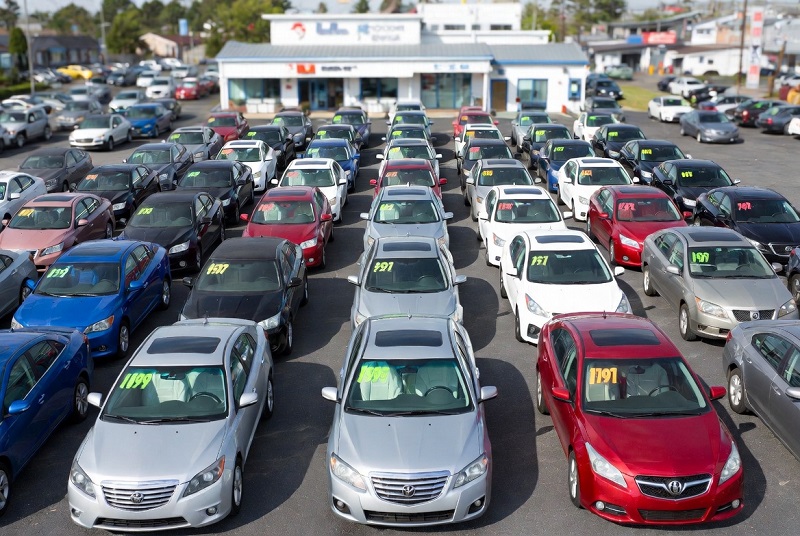
Mobility · Manufacturing · Passenger cars Passenger car production is not the same thing as total motor vehicle output. This

Mobility · Manufacturing · Passenger cars Passenger car production is not the same thing as total motor vehicle output. This

Global vehicle fleet age • safety • ownership cost Oldest car fleets: where “old vehicles” dominate — and why it
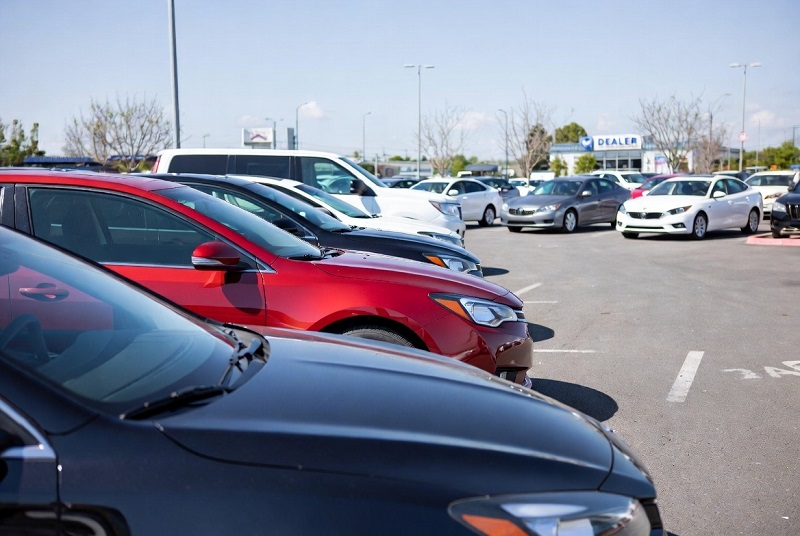
United States · Calendar year 2025 · Passenger cars & SUVs (fuel-focused) Top-selling brands by passenger car & SUV sales

All-in-one page — Part 1/3 Sales snapshot (unit sales) — by year, half-year, and region This section summarizes Mercedes-Benz unit

A model-level ranking of the world’s highest-volume vehicles in 2025, with a practical, publisher-friendly layout: overview, methodology, a Top 100
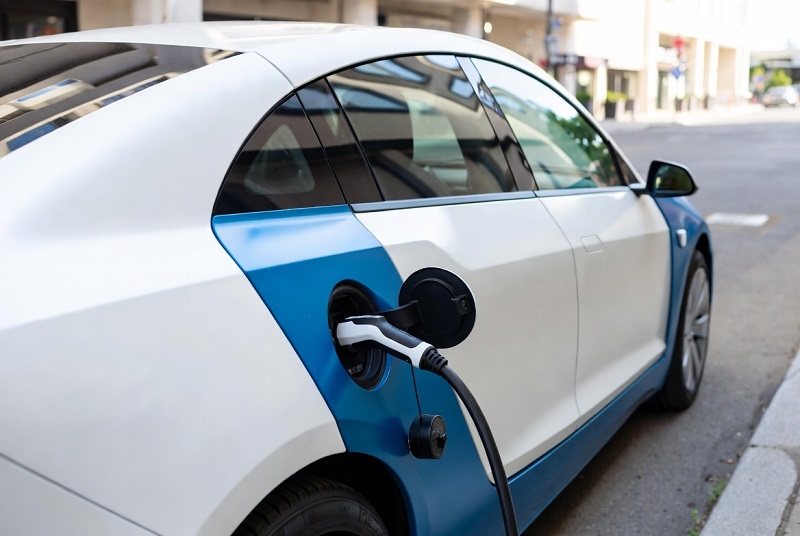
Top Electric Vehicles by Maximum Range (EPA Miles per Charge), 2025 Mobility • Rankings • 2025 Top Electric Vehicles by
StatRanker · Mobility This 2025 ranking focuses on real-world-friendly efficiency signals: EPA combined MPG for gasoline/hybrids and combined MPGe +
Mobility · Safety ranking · 2025 edition “Safest car” is not a single star rating, and it is not only

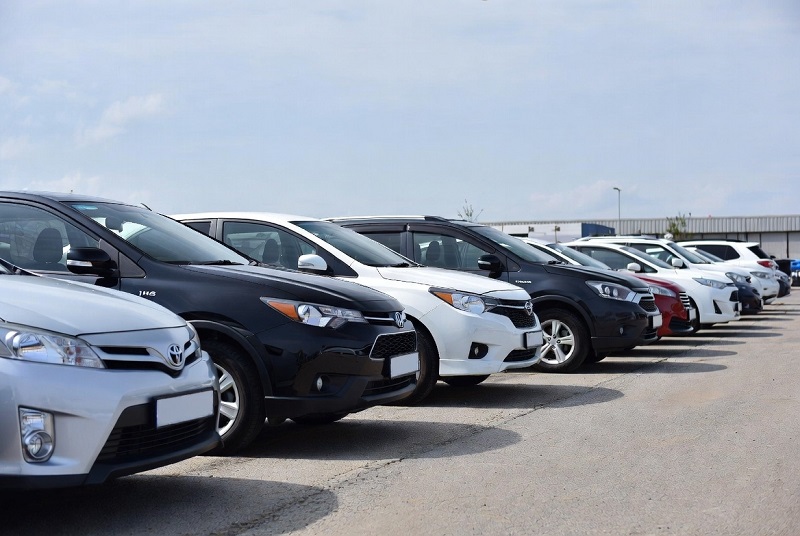
Mobility • Vehicle market “Best-selling” sounds simple until you define the unit of counting. In the U.S. market, sales leadership

“Most sold cars” sounds like a simple list. In practice it’s a measurement problem: the same badge on the trunk

This “car insurance cost by state” ranking uses the latest NAIC state average expenditure data available at publication time. It’s

Mobility • U.S. Insurance • 2026 composite ranking Composite score (0–100) Complaints • Claims • Financial strength Coverage & UX

“Cheapest” is only meaningful if everyone is priced on the same driver profile, the same coverage limits, and the same

World ranking • Fuel markets Diesel is the “workhorse” fuel behind freight, agriculture, construction and public transport, so pump prices

StatRanker • Automotive exports What this ranking measures This page ranks countries by the export value of automotive products. In
Overview: Top 100 Most Reliable Car Models, 2025 Reliability is most actionable when it is comparable at the model level.
Overview This ranking compares countries by the estimated share of road traffic fatalities where alcohol impairment (above the national legal

Mobility intensity Overview Vehicle-kilometers traveled per capita (VKT per person) summarizes how many kilometers road vehicles travel in a country,

Overview Gasoline prices by country in 2025 (USD per liter) Gasoline pump prices vary widely across countries even within the
Overview This ranking compares countries by the share of DC fast chargers within the public charging mix. The metric looks

Mobility · Road safety · Risk per distance Road deaths per 1 billion vehicle-kilometres — 2025 edition (maximum available country

Overview This page compares reported motor vehicle theft intensity across countries using a population-normalised rate: cases per 100,000 people. The

Public transport access in “major-city” terms: the SDG 11.2.1 lens behind this ranking “Public transport use” is often reported as

Mobility · Transport infrastructure · checked version Motorway and paved road density in 2025: how to read the ranking safely

Road fatalities per 100,000 inhabitants: what the 2025 edition measures This ranking tracks the estimated road traffic death rate per

Mobility · Electrification · New car market EV share in new car sales shows which markets are moving fastest from

How to read the 2025 travel-time ranking for urban congestion This page is built around one headline metric from the
