
Top 100 Importing Countries in the World, 2025
Where global import demand is concentrated in 2025 This ranking uses the latest full-year 2024 imports of goods and services
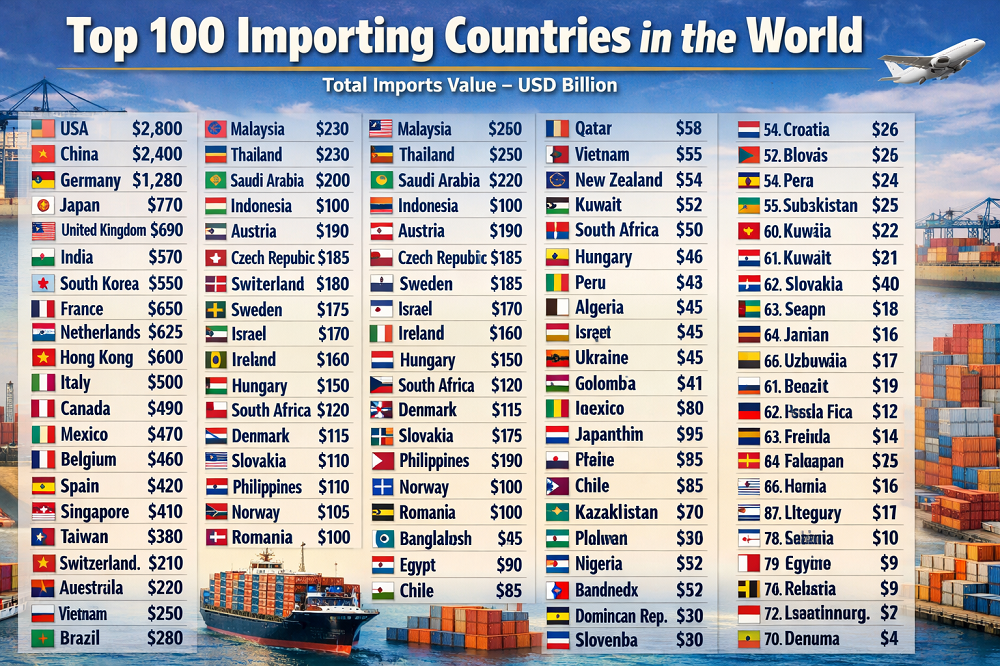
Where global import demand is concentrated in 2025 This ranking uses the latest full-year 2024 imports of goods and services

Economy · Trade · Exports How to read the world export ranking in 2025 This ranking tracks exports of goods
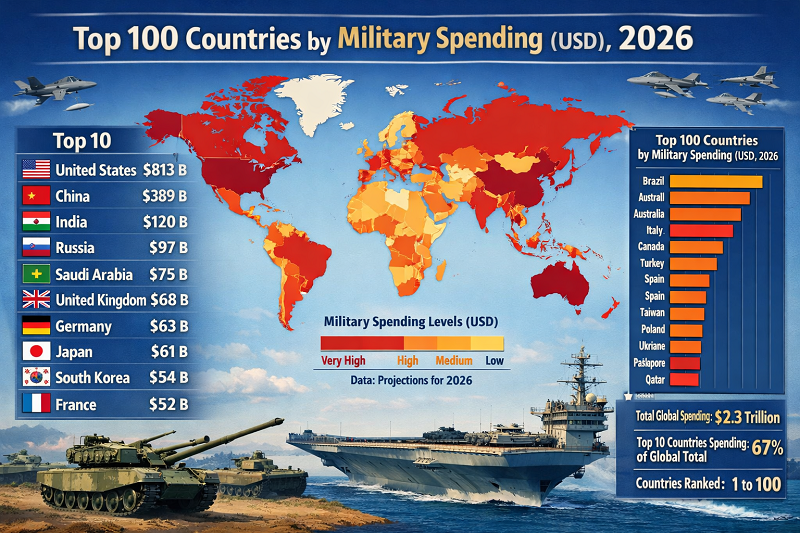
Military spending in 2026 is best read as a budget hierarchy, not a finished outturn table A clean 2026 ranking
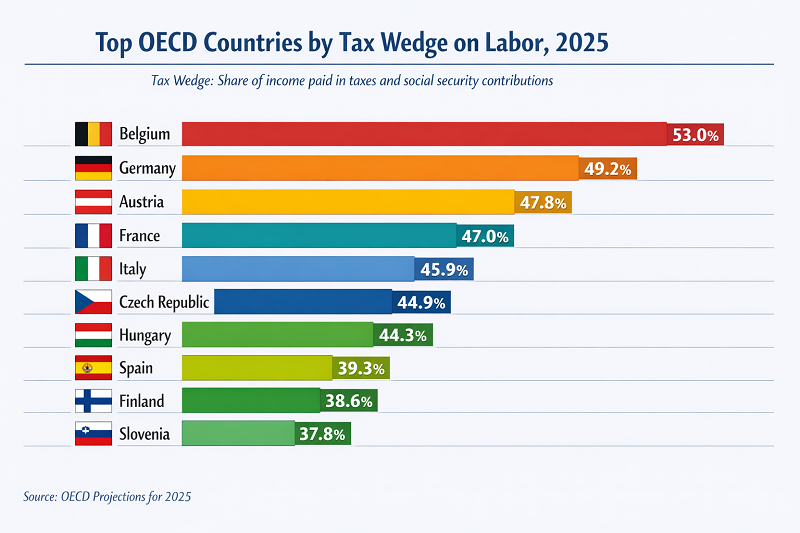
Economy · Budget and taxes · OECD labour taxation The tax wedge is the gap between what an employer pays

Economy · reserve assets · central banks · monetary gold Official gold reserves are the monetary gold holdings reported by

Foreign trade · Logistics · Maritime infrastructure How to read the latest World Bank container port traffic ranking Container port
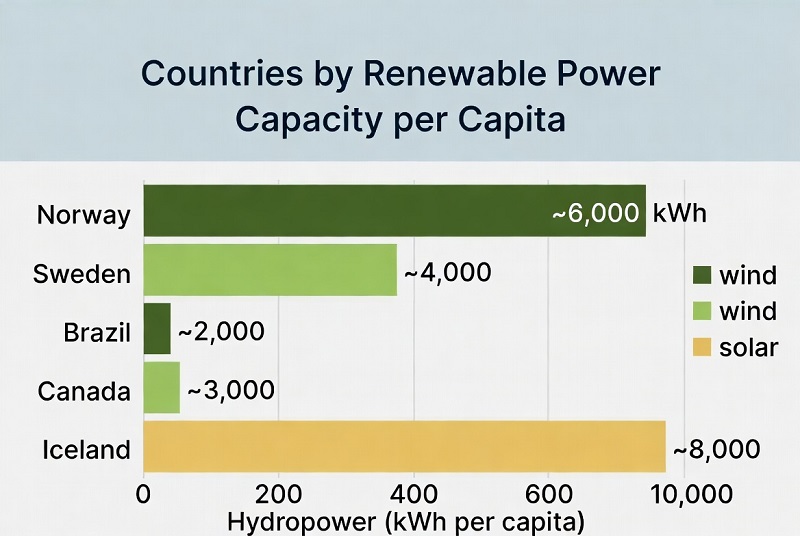
Renewable power capacity per person changes the ranking lens Installed renewable power per person highlights a different side of the
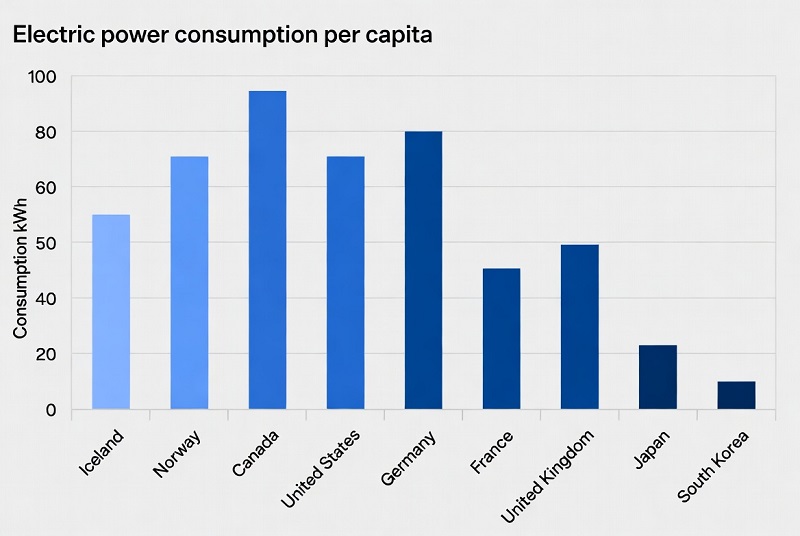
Energy · Utilities · Infrastructure What electric power consumption per capita shows in the latest World Bank / IEA comparison
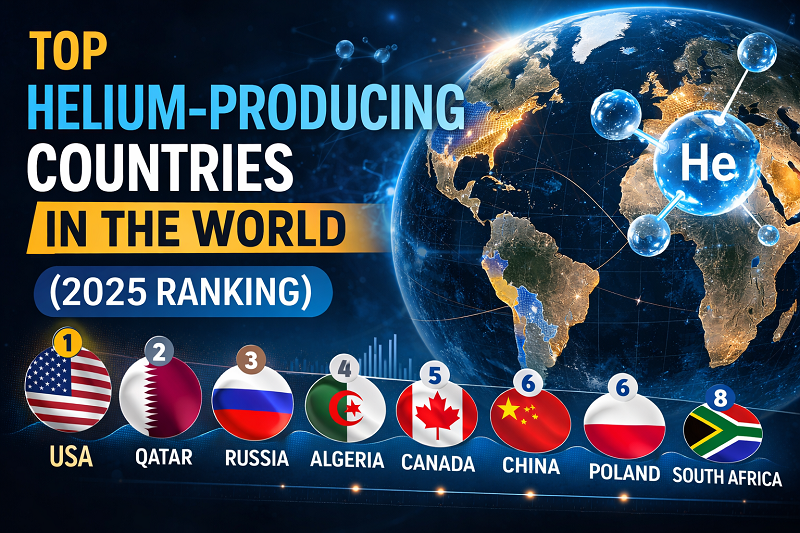
Table Methodology FAQ Sources Helium is one of the smallest commodity markets in volume terms, but it sits inside a
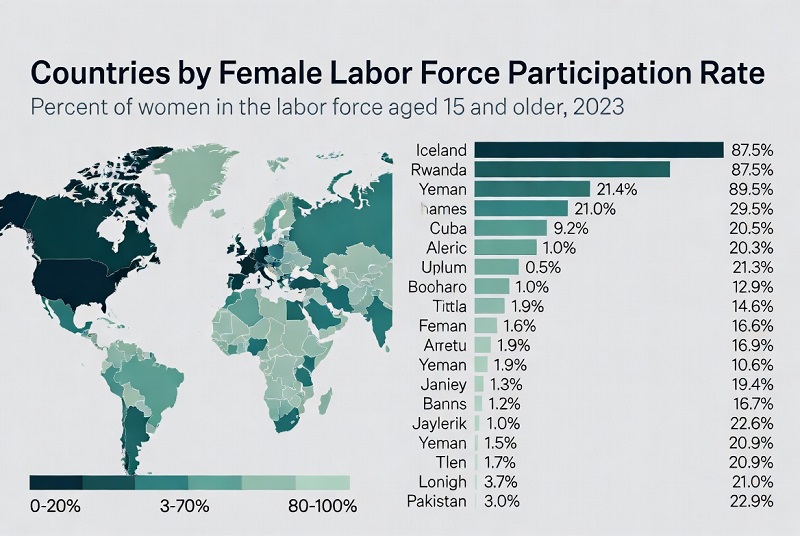
Economy · Demography · Gender statistics Why female labor force participation is one of the clearest cross-country signals in the

Travel data · inbound tourism · 2025 edition Why international tourist arrivals still matter International tourist arrivals are one of

Geopolitics · Defense budgets · SIPRI How military expenditure as a share of GDP shows defense burden in 2025 Military
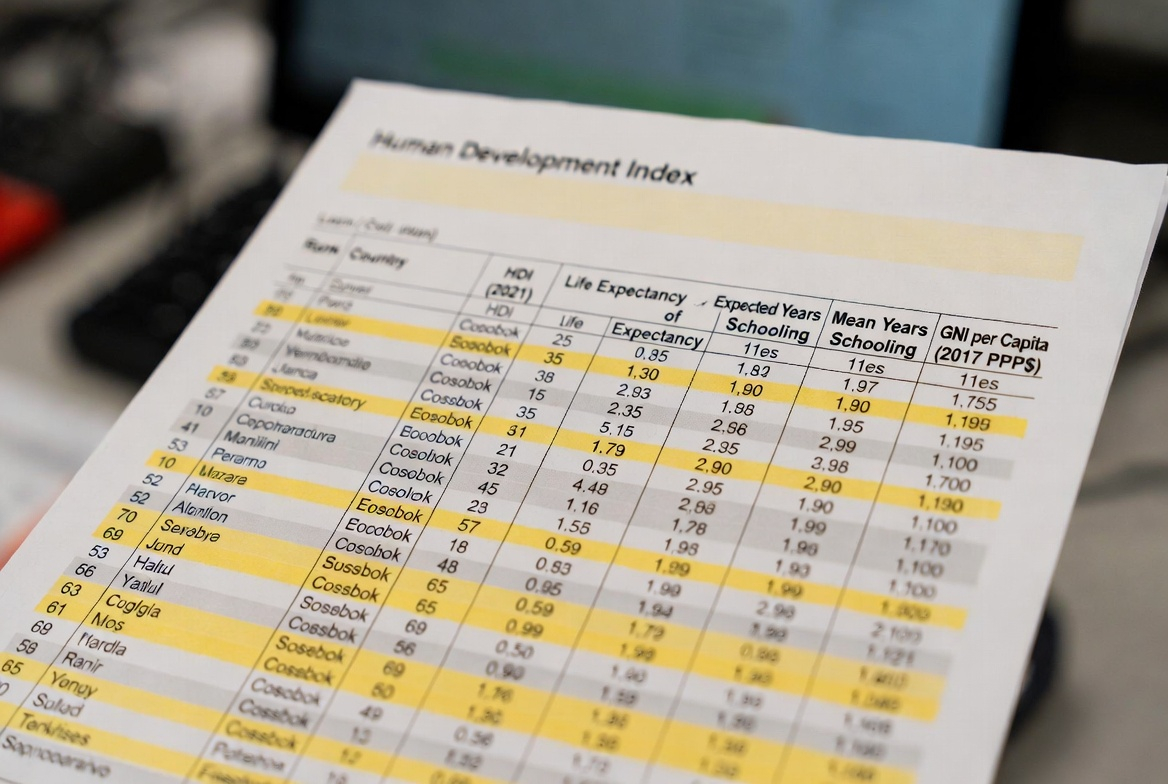
Society · Development · Composite index Human Development Index (HDI): a composite ranking of health, education, and living standards The
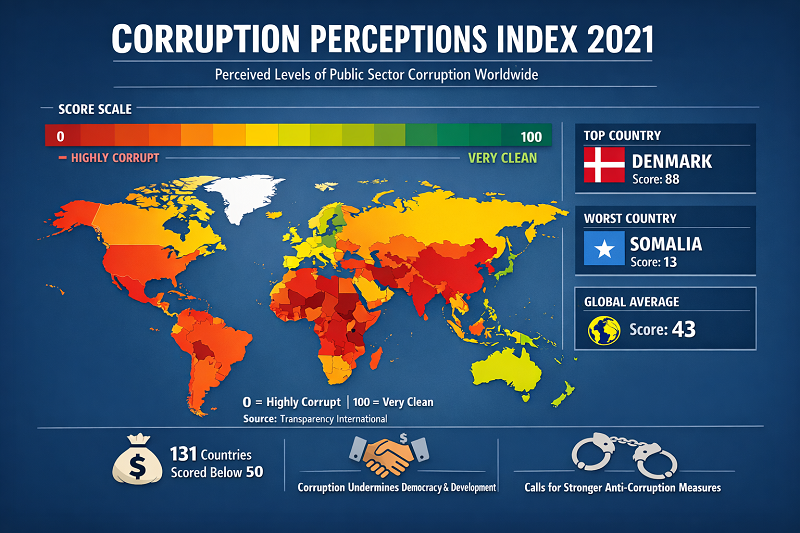
Governance · Transparency International · CPI 2025 The Corruption Perceptions Index (CPI) scores 182 countries and territories on perceived public-sector
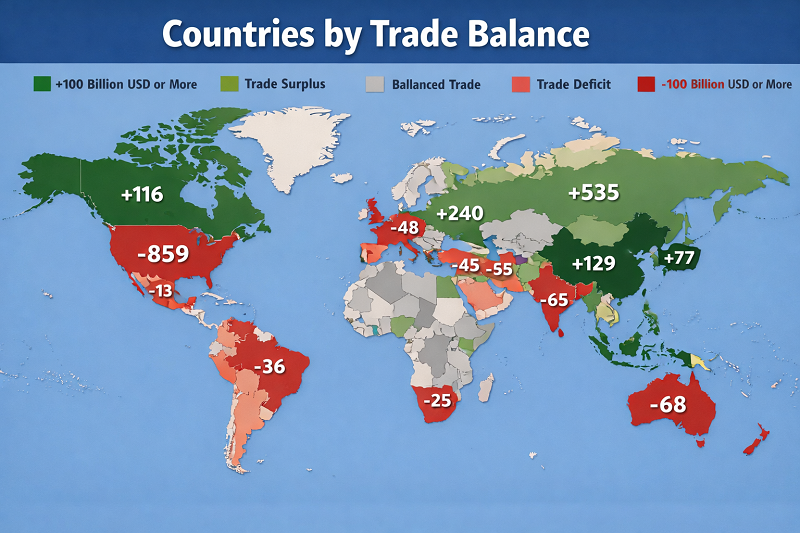
Metric: Trade balance (net exports), current USD Proxy year: 2023 (latest widely available) Extracted: February 16, 2026 Trade balance snapshot
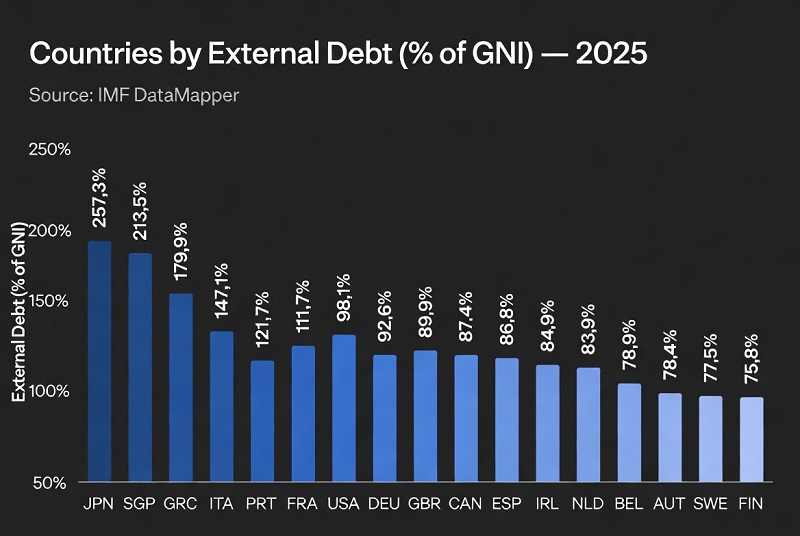
External debt snapshot (2025, using latest available year as proxy) What this ranking measures This ranking compares economies by external
Private credit depth (bank lending to the private sector) This benchmark tracks how large bank credit to households and non-financial

Metric: Interest payments (% of revenue) Snapshot: latest available year (often 2022–2024) Coverage: government reporting varies by country When interest

What this ranking measures Inflation volatility is a practical way to describe how unpredictable price growth is. Instead of focusing
External sector · Balance of payments Countries by current account balance (% of GDP) — 2025 snapshot (latest full-year data
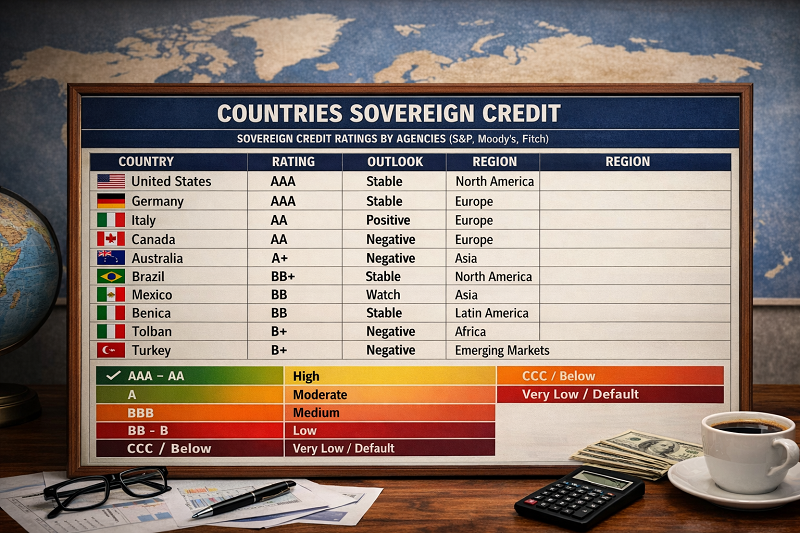
Snapshot date: February 15, 2026 Score: 0–100 (higher = stronger) Focus: long-term sovereign ratings (foreign-currency where available) What this ranking measures A sovereign

Finance · Macroeconomics · Reserve Assets Countries by Foreign Exchange Reserves — 2025 Ranking StatRanker Editorial March 26, 2026 Data:
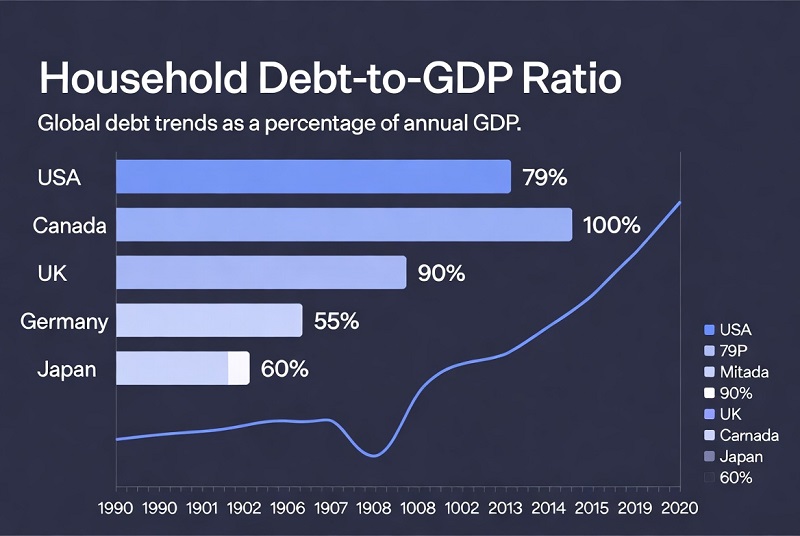
Metric: Household debt / GDP Unit: % of GDP Snapshot: 2025 (latest available quarter, BIS) Reference: Q2 2025 (end-of-quarter) What
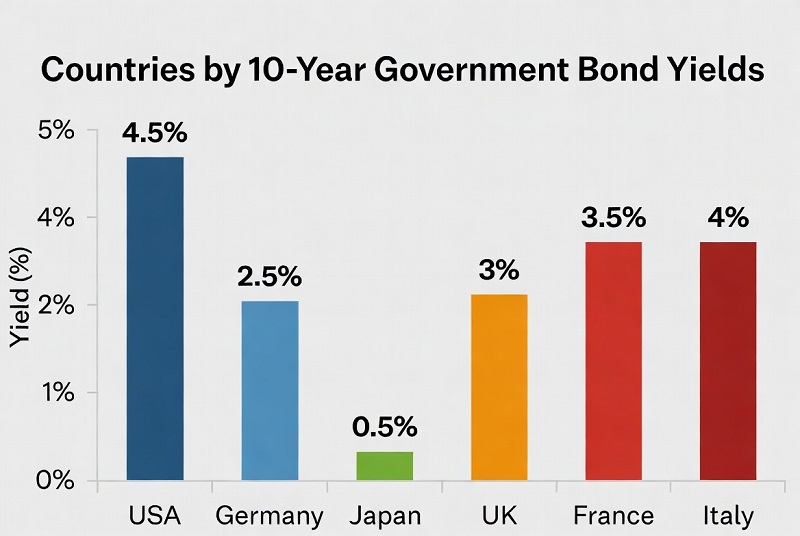
Sovereign yields · highest borrowing costs Countries by 10-year government bond yields (latest snapshot) A 10-year government bond yield is
Global FX · Depreciation vs USD · 2025–2026 Currency Depreciation vs USD (YoY): Worst Performing Currencies This ranking tracks year-over-year
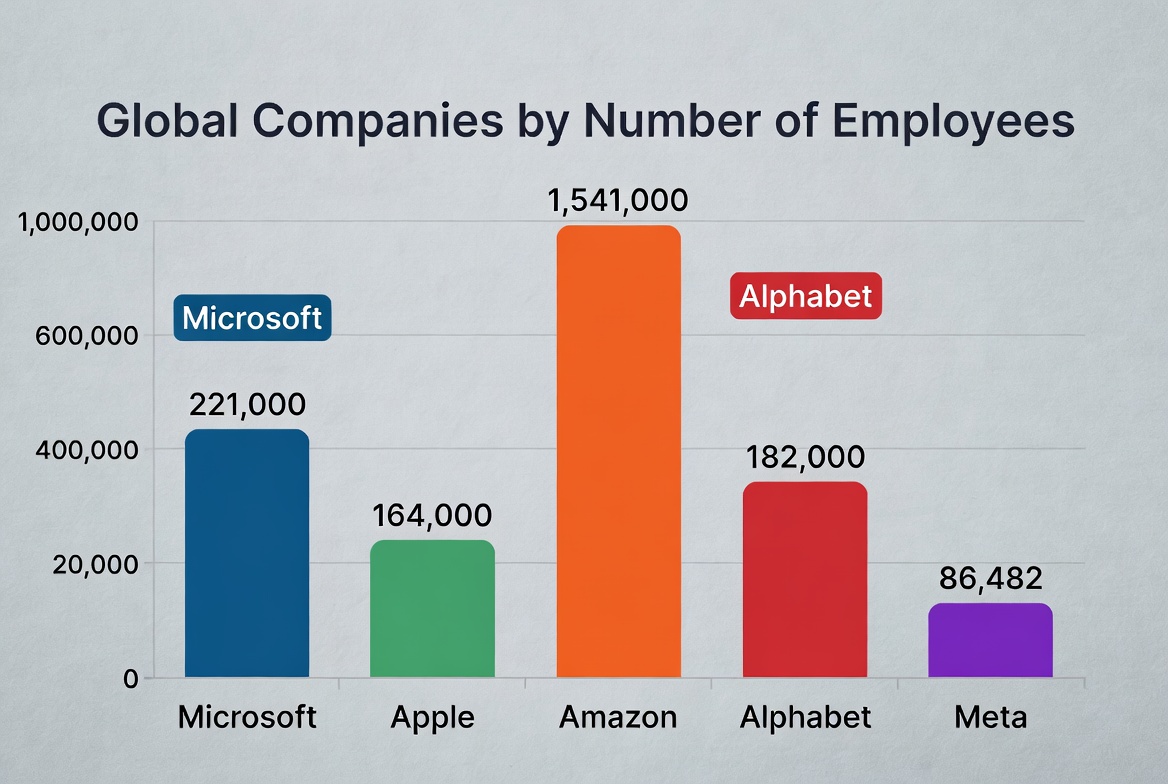
Largest employers • global public-company snapshot Employee headcount is a pure scale signal. It captures operating footprint, service capacity, and
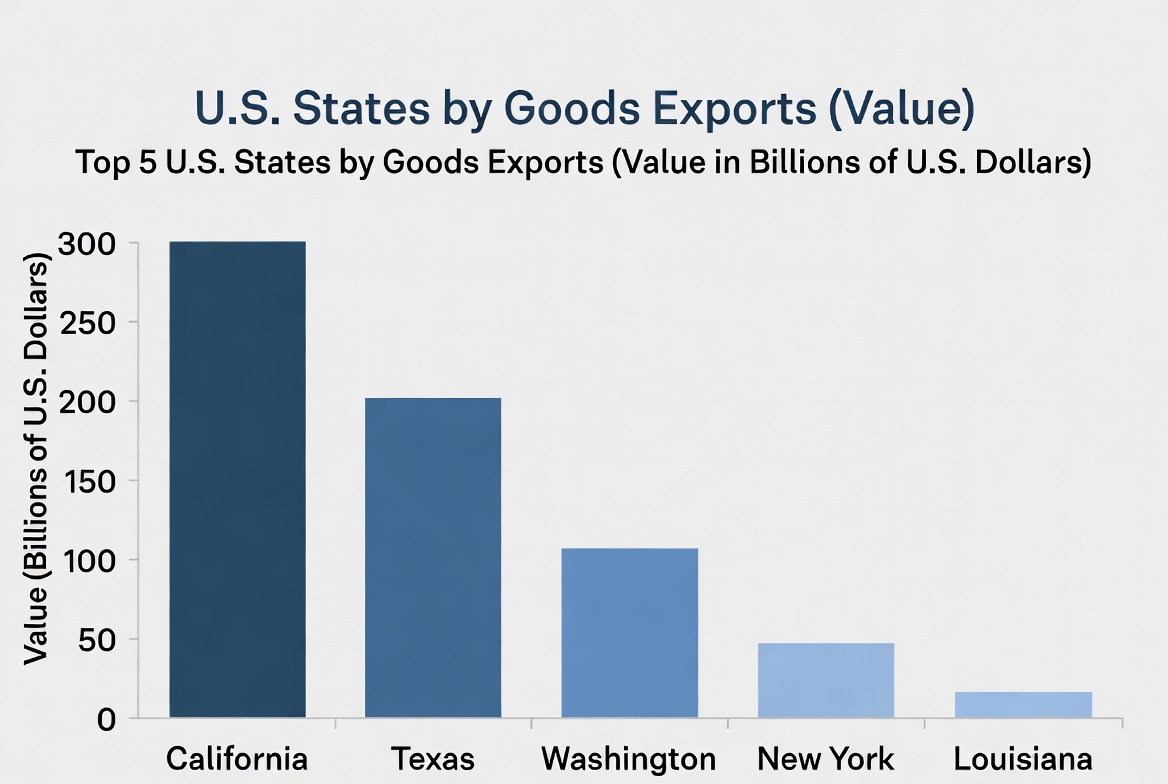
Ranking • State trade Metric: Goods exports (origin of movement) Latest full year in this snapshot: 2024 Units: USD billions (nominal) Updated: 2026-02-05 Where U.S. goods
