

Countries by Renewable Electricity Generation per Capita, 2025
Installed renewable capacity tells you how much equipment is connected to the grid. It does not tell you how much renewable electricity those assets actually produced for residents over the year. A per-capita generation ranking answers the more practical comparison question: which countries generate the most renewable electricity for each person.
This 2025 snapshot uses the latest comparable cross-country values available at publication time. To keep the metric conservative, the total combines hydro, wind, solar, and other renewables per capita, while obviously duplicated components were not counted twice.
Iceland sits far above every other country in the ranking, showing how a small population and very strong renewable output can create an extreme per-capita result.
Continue exploring
More StatRanker rankings on climate, environment, resources and sustainability.
Top 100 Countries by Share of Renewable Energy in Power Generation, 2025
Open rankingTop 100 Countries by Annual CO₂ Emissions per Capita, 2025
Open rankingTop 100 Countries by Total CO₂ Emissions, 2026 Snapshot
Open rankingIceland, Norway, Canada, Bhutan, Greenland, New Zealand, Paraguay, Austria and Switzerland all rank high because hydropower still produces the largest per-person renewable volumes.
Sweden, Finland, Denmark, Germany, Portugal and Uruguay stand out because they do not rely on a single renewable source.
What stands out at the top of the ranking
The upper end of the list is shaped by geography before anything else. Iceland and Norway are not just renewable leaders by share; they are outliers in annual renewable electricity available per resident. Canada, Bhutan, Greenland, New Zealand and Paraguay show the same pattern in different forms: strong hydrology combined with relatively small populations produces very high per-capita output.
The second pattern is diversification. Sweden and Finland do not depend on one stream alone. Denmark, Germany, Portugal and Uruguay demonstrate how wind can materially change the ranking when it is scaled well and backed by other renewable sources. By the time the list reaches Costa Rica at rank 20, the level has already fallen to 2,265.71 kWh per person, which shows how steeply the distribution drops after the hydro outliers.
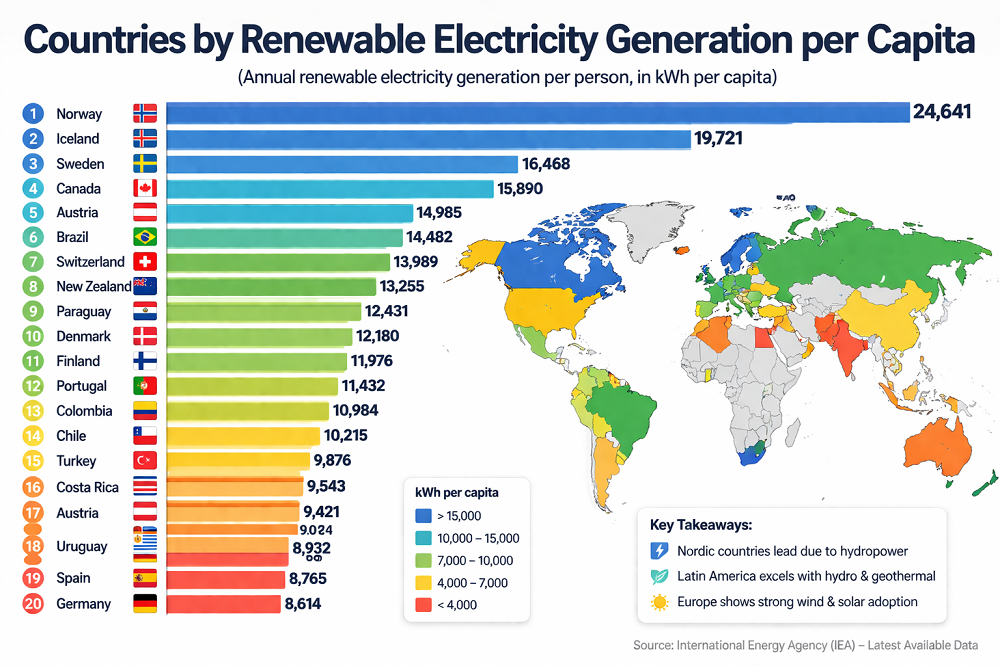
Chart 1. Top 20 countries by renewable electricity generation per capita
The bar chart makes the shape of the ranking easier to read. Iceland and Norway form a separate tier, while the rest of the Top 20 compresses much more quickly into a narrower band.
- Iceland — 56,800.62
- Norway — 26,170.77
- Canada — 11,406.88
- Sweden — 11,102.41
- Bhutan — 8,663.61
- Greenland — 7,229.71
- New Zealand — 7,203.37
- Paraguay — 7,071.85
- Austria — 6,116.21
- Finland — 6,079.65
- Switzerland — 4,767.42
- Montenegro — 3,992.29
- Denmark — 3,708.66
- Uruguay — 3,650.47
- Germany — 3,039.96
- Portugal — 3,000.30
- United States — 2,501.31
- Australia — 2,451.14
- Brazil — 2,400.32
- Costa Rica — 2,265.71
Values are shown in kilowatt-hours per person. The chart uses the same ranking values as the table below and only improves readability; it does not replace the visible HTML data.
Full ranking table
| Rank | Country | Renewable electricity per capita (kWh) | Primary profile |
|---|---|---|---|
| 1 | Iceland | 56,800.62 | Hydro + Other renewables |
| 2 | Norway | 26,170.77 | Hydro |
| 3 | Canada | 11,406.88 | Hydro |
| 4 | Sweden | 11,102.41 | Hydro + Wind |
| 5 | Bhutan | 8,663.61 | Hydro |
| 6 | Greenland | 7,229.71 | Hydro |
| 7 | New Zealand | 7,203.37 | Hydro + Other renewables |
| 8 | Paraguay | 7,071.85 | Hydro |
| 9 | Austria | 6,116.21 | Hydro |
| 10 | Finland | 6,079.65 | Hydro + Other renewables |
| 11 | Switzerland | 4,767.42 | Hydro |
| 12 | Montenegro | 3,992.29 | Hydro |
| 13 | Denmark | 3,708.66 | Wind + Other renewables |
| 14 | Uruguay | 3,650.47 | Wind + Hydro |
| 15 | Germany | 3,039.96 | Wind + Solar |
| 16 | Portugal | 3,000.30 | Hydro + Wind |
| 17 | United States | 2,501.31 | Wind + Hydro |
| 18 | Australia | 2,451.14 | Wind + Solar |
| 19 | Brazil | 2,400.32 | Hydro |
| 20 | Costa Rica | 2,265.71 | Hydro |
| 21 | Ireland | 2,250.83 | Wind |
| 22 | Georgia | 2,233.60 | Hydro |
| 23 | Falkland Islands | 2,233.33 | Wind |
| 24 | Panama | 2,192.89 | Hydro |
| 25 | French Guiana | 2,106.30 | Hydro |
| 26 | Chile | 2,006.24 | Hydro + Solar |
| 27 | Croatia | 1,985.78 | Hydro + Wind |
| 28 | Belgium | 1,936.41 | Wind + Other renewables |
| 29 | United Kingdom | 1,903.24 | Wind + Other renewables |
| 30 | France | 1,888.56 | Hydro + Wind |
| 31 | Netherlands | 1,831.54 | Wind + Solar |
| 32 | Albania | 1,796.58 | Hydro |
| 33 | Estonia | 1,695.23 | Other renewables + Wind |
| 34 | Greece | 1,665.13 | Wind + Solar |
| 35 | Serbia | 1,566.63 | Hydro |
| 36 | Bosnia and Herzegovina | 1,563.37 | Hydro |
| 37 | China | 1,537.20 | Hydro + Wind |
| 38 | Turkey | 1,493.50 | Hydro + Wind |
| 39 | Russia | 1,482.12 | Hydro |
| 40 | Ecuador | 1,438.78 | Hydro |
| 41 | Aruba | 1,384.08 | Wind |
| 42 | Romania | 1,281.69 | Hydro + Wind |
| 43 | New Caledonia | 1,252.70 | Hydro |
| 44 | Japan | 1,202.02 | Solar + Other renewables |
| 45 | Belize | 1,122.51 | Hydro + Other renewables |
| 46 | Luxembourg | 1,093.45 | Wind + Other renewables |
| 47 | Bulgaria | 1,078.97 | Hydro + Solar |
| 48 | Peru | 1,018.51 | Hydro |
| 49 | Colombia | 978.23 | Hydro |
| 50 | Czechia | 910.88 | Other renewables + Solar |
Ranking values reflect the latest comparable figures available at publication time and are presented here as a 2025 cross-country snapshot.
What the table shows: countries with very high renewable electricity output relative to population, not simply countries that installed a lot of renewable capacity. Small and mid-sized hydro-rich systems dominate the top, while larger diversified economies rise when wind, solar and other renewables materially add to the total.
Methodology
The indicator is renewable electricity generation per person, measured in kilowatt-hours per capita. It is meant to compare actual annual renewable output, not the installed size of the generating fleet. That difference matters because capacity can look impressive on paper while annual generation remains modest if utilisation is low.
The calculation combines hydro, wind, solar, and other renewables per capita. The methodological anchor for the metric is the Our World in Data renewable-electricity-per-person series, while IRENA electricity statistics provide the official international reference point for generation and capacity coverage. The country ranking uses the latest comparable cross-country values available at publication time as a 2025 snapshot.
There are also limits readers should keep in mind. Per-capita generation is not the same thing as renewable share of electricity, and it is not a full decarbonisation score for the whole economy. It does not capture transport fuels, heating, industrial combustion, storage adequacy, grid congestion or retail power prices. It is strongest as a clean-electricity output benchmark.
Key insights
The first pattern is structural concentration. Hydropower still creates the most extreme per-capita outcomes because a large river-based system can generate enormous volumes relative to a small national population. That is why Iceland and Norway sit so far above the rest, and why Canada, Bhutan, Greenland and Paraguay also score unusually high.
The second pattern is technology mix. Countries such as Sweden, Finland, Denmark, Germany, Portugal and Uruguay remain important because they show a different route into the upper tier: not just one dominant source, but a broader portfolio where wind, hydro, solar and other renewables all contribute to a more resilient output profile.
The third pattern is interpretive. A country can rank very high on renewable share with a smaller electricity system, yet still produce less renewable electricity per resident than a hydro-rich country with a much larger output base. That is why per-capita generation should be treated as a distinct ranking rather than a repackaged renewable-share list.
What this means for the reader
This ranking is useful for anyone comparing energy systems in practical terms. It shows where renewable electricity is genuinely abundant per resident, which matters for long-term industrial competitiveness, electrification capacity, clean-power narratives and country benchmarking.
It is also a reminder to read energy headlines carefully. A country can install a lot of wind turbines or solar panels and still rank lower than expected if its overall generation per person remains modest. Conversely, a hydro-heavy system with a smaller population can look extraordinary in per-capita terms even if its broader energy transition still has unresolved weaknesses elsewhere in the economy.
For investors, analysts and readers tracking climate policy, the indicator is most useful when paired with other measures: renewable share of electricity generation, total electricity generation per capita, grid reliability and price outcomes. Together, those metrics tell a much fuller story than any single ranking on its own.
FAQ
Why is generation per capita more useful than installed capacity per capita?
Why do hydro-heavy countries dominate this ranking so often?
Is this the same as renewable share of electricity generation?
Does a high result automatically mean lower electricity prices?
Why are some diversified wind-and-solar countries still below hydro outliers?
How should this ranking be used together with other energy indicators?
Sources
-
Our World in Data — Electricity generation from renewables per person
Source
Metric definition and public indicator basis for renewable electricity per capita.
-
IRENASTAT — Electricity statistics by country and technology
Source
Official international reference for electricity generation and installed capacity by country and technology.
-
IRENA — Renewable Energy Statistics 2025
Source
Publication context for generation and power-capacity coverage.
-
Dewesoft — The most common electricity source in each country
Source
Supplementary cross-country comparison used only as contextual background for country-level generation mix.
The table remains fully readable as part of the page content, while the controls above make it easier to search, sort, and filter the ranking.
Related rankings
More StatRanker rankings on climate, environment, resources and sustainability.
Top 100 Countries by Water Stress Level, 2025
Open rankingTop 100 Countries by PM2.5 Air Pollution (Annual Mean), 2025
Open rankingTop 100 Countries by Climate Risk Index (Heat, Floods, Storms), 2025
Open rankingExtreme Weather Disaster Pressure by Country: Exposure Patterns, Risks and Resilience
Open rankingStatRanker (Website)
administrator
