

Average Annual Working Hours by OECD Country, 2025
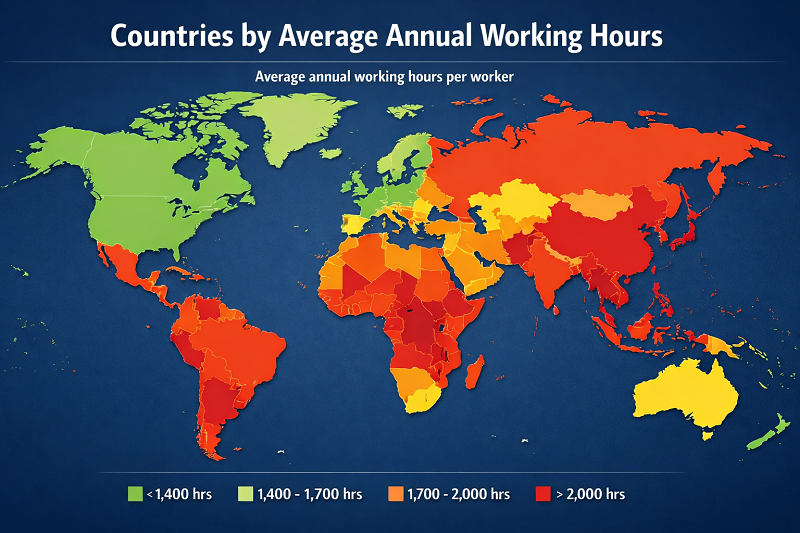
Which OECD countries report the highest annual-hours values in 2025?
Among OECD member countries with a published 2025 observation, Mexico has the highest underlying value at 2,205.4 hours actually worked per worker, followed by Costa Rica at 2,182.9 and Chile at 1,912.0. Germany has the lowest included value at 1,332.2 hours.
This page orders official OECD values for average annual hours actually worked per worker. It covers 36 of the OECD's 38 member countries because Colombia and Türkiye do not have a 2025 observation in the selected series. Higher raw values rank higher.
All 36 country values are directly published OECD observations. No country value is calculated, forecast or projected, and no missing 2025 observation is replaced with an older year.
Mexico; official_value; hours actually worked per worker.
Germany; official_value; OECD 2025.
OECD members with an available 2025 observation in the selected series.
Average annual hours actually worked per worker.
36 official_value; 0 calculated; 0 forecasts; 0 modeled projections.
What average annual hours actually worked measures
OECD defines the indicator as total hours actually worked during the year divided by the average number of people in employment during that year. Coverage includes employees and self-employed workers.
Actual hours include regular working time, paid and unpaid overtime and hours worked in additional jobs. Time not worked because of public holidays, annual leave, illness, injury, maternity or parental leave, training, strikes and other specified absences is excluded.
For a separate measure of output generated per hour worked, see StatRanker's productivity per hour worked ranking.
A broader comparison based on weekly working hours is available in the global weekly-hours comparison. It uses a different metric and should not be treated as interchangeable with this OECD annual-hours series.
Top 10 published OECD annual-hours values in 2025
Mexico and Costa Rica are the only included OECD members above 2,000 hours per worker in the underlying 2025 data. Ranking is based on the unrounded numeric value rather than a rounded whole-hour display.
Top 10 OECD members by average annual hours actually worked per worker, 2025
| Rank | Country | Hours | Region / note |
|---|---|---|---|
| 1 | Mexico | 2,205.4 | Americas; official_value; OECD 2025; raw value used for rank. |
| 2 | Costa Rica | 2,182.9 | Americas; official_value; OECD 2025; raw value used for rank. |
| 3 | Chile | 1,912.0 | Americas; official_value; OECD 2025; raw value used for rank. |
| 4 | Greece | 1,874.3 | Europe; official_value; OECD 2025; raw value used for rank. |
| 5 | Israel | 1,870.0 | Middle East; official_value; OECD 2025; raw value used for rank. |
| 6 | Korea | 1,833.0 | Asia-Pacific; official_value; OECD 2025; raw value used for rank. |
| 7 | Czechia | 1,823.6 | Europe; official_value; OECD 2025; raw value used for rank. |
| 8 | United States | 1,800.2 | Americas; official_value; OECD 2025; raw value used for rank. |
| 9 | Poland | 1,776.0 | Europe; official_value; OECD 2025; raw value used for rank. |
| 10 | Portugal | 1,764.3 | Europe; official_value; OECD 2025; raw value used for rank. |
Values are shown to one decimal place so countries that round to the same whole hour are not incorrectly treated as ties.
Chart: 20 highest published OECD values
Bar length uses the same raw values as the ranking table and is scaled to Mexico's 2,205.4-hour value.
Methodology
The ranking uses the OECD dataset Average annual hours actually worked per worker, series DSD_HW@DF_AVG_ANN_HRS_WKD, with worker status set to Total and target year 2025. Country order is calculated from the underlying numeric observations rather than from whole-hour values displayed by some OECD interfaces.
Metric
Total hours actually worked during the year divided by the average number of people in employment during that year.
Unit and direction
Hours per worker per year. Raw value descending: a larger annual-hours value ranks higher.
Coverage
36 OECD members with an available 2025 observation. Colombia and Türkiye are excluded because the selected series does not provide a 2025 value for them.
Data status
36 official_value rows. No calculated_value, official_forecast or modeled_projection rows are included.
Raw-value ranking
Ranks use the underlying decimal observations. Display precision is one decimal place, preventing false ties caused by rounding to whole hours.
Missing values
No earlier year is substituted for a missing 2025 observation. This keeps every included country on the same target year.
Conflict rule
Country values from alternative databases are not averaged with OECD observations. The numeric table uses one OECD annual-hours series throughout.
Region labels
Americas, Europe, Asia-Pacific and Middle East are StatRanker navigation groupings used only for filtering and do not affect ranking values.
No formula is used to calculate country values. Each included observation is classified as official_value. The chart only converts each raw value into a bar width relative to the highest value and does not affect rank.
OECD includes regular working hours, paid and unpaid overtime and hours worked in additional jobs. Hours not worked because of public holidays, leave, illness, training, strikes and other specified absences are excluded.
The metric does not measure labor productivity, wages, job quality, work intensity, statutory weekly hours, unemployment or worker well-being.
Target year: 2025. Official OECD source checked September 24, 2026.
2025 OECD annual-hours ranking: 36 member countries
Search by country, filter by region or change the display order. Every included row uses the same OECD metric, target year and official-value status.
OECD average annual hours actually worked per worker, 2025
| Rank | Country | Hours | Region / note |
|---|---|---|---|
| 1 | Mexico | 2,205.4 | Americas; official_value; OECD 2025; raw value used for rank. |
| 2 | Costa Rica | 2,182.9 | Americas; official_value; OECD 2025; raw value used for rank. |
| 3 | Chile | 1,912.0 | Americas; official_value; OECD 2025; raw value used for rank. |
| 4 | Greece | 1,874.3 | Europe; official_value; OECD 2025; raw value used for rank. |
| 5 | Israel | 1,870.0 | Middle East; official_value; OECD 2025; raw value used for rank. |
| 6 | Korea | 1,833.0 | Asia-Pacific; official_value; OECD 2025; raw value used for rank. |
| 7 | Czechia | 1,823.6 | Europe; official_value; OECD 2025; raw value used for rank. |
| 8 | United States | 1,800.2 | Americas; official_value; OECD 2025; raw value used for rank. |
| 9 | Poland | 1,776.0 | Europe; official_value; OECD 2025; raw value used for rank. |
| 10 | Portugal | 1,764.3 | Europe; official_value; OECD 2025; raw value used for rank. |
| 11 | New Zealand | 1,723.0 | Asia-Pacific; official_value; OECD 2025; raw value used for rank. |
| 12 | Italy | 1,715.7 | Europe; official_value; OECD 2025; raw value used for rank. |
| 13 | Canada | 1,687.0 | Americas; official_value; OECD 2025; raw value used for rank. |
| 14 | Lithuania | 1,673.1 | Europe; official_value; OECD 2025; raw value used for rank. |
| 15 | Hungary | 1,670.7 | Europe; official_value; OECD 2025; raw value used for rank. |
| 16 | Ireland | 1,639.0 | Europe; official_value; OECD 2025; raw value used for rank. |
| 17 | Australia | 1,633.0 | Asia-Pacific; official_value; OECD 2025; raw value used for rank. |
| 18 | Spain | 1,632.7 | Europe; official_value; OECD 2025; raw value used for rank. |
| 19 | Slovak Republic | 1,618.9 | Europe; official_value; OECD 2025; raw value used for rank. |
| 20 | Estonia | 1,609.7 | Europe; official_value; OECD 2025; raw value used for rank. |
| 21 | Slovenia | 1,599.4 | Europe; official_value; OECD 2025; raw value used for rank. |
| 22 | Japan | 1,597.5 | Asia-Pacific; official_value; OECD 2025; raw value used for rank. |
| 23 | Latvia | 1,588.1 | Europe; official_value; OECD 2025; raw value used for rank. |
| 24 | Belgium | 1,586.0 | Europe; official_value; OECD 2025; raw value used for rank. |
| 25 | United Kingdom | 1,532.9 | Europe; official_value; OECD 2025; raw value used for rank. |
| 26 | Switzerland | 1,512.2 | Europe; official_value; OECD 2025; raw value used for rank. |
| 27 | France | 1,498.3 | Europe; official_value; OECD 2025; raw value used for rank. |
| 28 | Finland | 1,491.9 | Europe; official_value; OECD 2025; raw value used for rank. |
| 29 | Luxembourg | 1,459.0 | Europe; official_value; OECD 2025; raw value used for rank. |
| 30 | Austria | 1,442.2 | Europe; official_value; OECD 2025; raw value used for rank. |
| 31 | Netherlands | 1,436.0 | Europe; official_value; OECD 2025; raw value used for rank. |
| 32 | Sweden | 1,421.2 | Europe; official_value; OECD 2025; raw value used for rank. |
| 33 | Iceland | 1,420.8 | Europe; official_value; OECD 2025; raw value used for rank. |
| 34 | Norway | 1,385.7 | Europe; official_value; OECD 2025; raw value used for rank. |
| 35 | Denmark | 1,369.3 | Europe; official_value; OECD 2025; raw value used for rank. |
| 36 | Germany | 1,332.2 | Europe; official_value; OECD 2025; raw value used for rank. |
Rank is calculated from the raw numeric value before display formatting. Source checked September 24, 2026. Colombia and Türkiye are excluded rather than filled with observations from another year.
What stands out in the 2025 OECD data
Key Insight
Mexico and Costa Rica form a distinct top pair at 2,205.4 and 2,182.9 hours. Their raw values differ by only 22.5 hours.
Notable Pattern
The drop from Costa Rica to third-ranked Chile is 270.9 hours, much larger than the gap between the first two countries.
Regional Concentration
Europe accounts for 26 of the 36 included countries. This mainly reflects OECD membership composition and should not be interpreted as a regional working-hours effect.
Outlier
Germany's 1,332.2-hour value is 37.1 hours below Denmark, the next-lowest country in the included 2025 table.
How to interpret the ranking
Read the table as an ordering of annual-hours values published by OECD for 2025, not as a precise league table of how hard people work. Part-time employment, self-employment, overtime, leave and national statistical methods can affect country values.
Hours worked should also not be confused with productivity. A country can record fewer annual hours and still produce more output per hour.
Small differences deserve particular caution because OECD identifies cross-country comparability limitations. Changes within the same country over several years are generally a stronger use of this series than interpreting a very small one-year gap between two countries.
Download the Average Annual Working Hours by OECD Country, 2025 dataset
Average Annual Working Hours by OECD Country, 2025
36 ranked entries · Excel + CSV + methodology + sources + chart · Snapshot: 2025 OECD · Version 1.0
No signup required. The archive includes machine-readable data, methodology and source documentation. Quick human verification is required before the ZIP is delivered.
Download Excel + CSV Data PackFAQ
Which OECD country has the highest annual-hours value in 2025?
Mexico has the highest underlying 2025 value among OECD members with an available observation, at 2,205.4 hours actually worked per worker.
Is Mexico being identified as the country with the longest working hours in the world?
No. This page covers OECD member countries with available 2025 observations. It is not a global all-country ranking.
Why are only 36 OECD countries included?
The OECD has 38 member countries, but the selected annual-hours series does not provide a 2025 observation for Colombia or Türkiye. Earlier years are not substituted.
Are these official published values?
Yes. Every country value is classified as official_value because it comes from the OECD annual-hours dataset. StatRanker does not calculate or forecast country values in this table.
Why do some values differ from the whole-hour number shown in the OECD table interface?
The ranking uses the underlying numeric observations to one decimal place. Some OECD table views display rounded whole hours, which can make different raw values appear equal.
What counts as hours actually worked?
The measure includes regular hours, paid and unpaid overtime and hours worked in additional jobs. Holidays, leave, illness and other specified periods not worked are excluded.
Is this the same as the legal or standard workweek?
No. Legal or contractual weekly hours describe scheduled working time, while this indicator measures actual annual hours across the employed population.
Can the country values be compared directly?
Only with caution. OECD states that differences in national sources and calculation methods limit strict comparisons of annual-hour levels between countries.
Does a higher value mean higher productivity?
No. This indicator measures labor time, not output per hour. Productivity requires a separate output-per-hour measure.
Sources
OECD Data Explorer — Average annual hours actually worked per worker
Primary official dataset for 2025 country observations, coverage and the selected annual-hours series. Worker status: Total.
OECD SDMX API — reproducible raw-value endpoint
Official machine-readable OECD endpoint used for raw numeric observations before display formatting and ranking.
OECD — Hours worked indicator
Official definition of hours actually worked, included and excluded time and cross-country comparability limits.
OECD — Data via API
Official OECD documentation for retrieving Data Explorer observations through the SDMX API and CSV output.
https://www.oecd.org/en/data/insights/data-explainers/2024/09/api.html
OECD — Members and partners
Official source used to confirm OECD membership and the 36-of-38 coverage statement.
Related rankings
Closely related StatRanker pages selected by topic. If no strong match exists, fewer links are shown instead of unrelated recommendations.
