

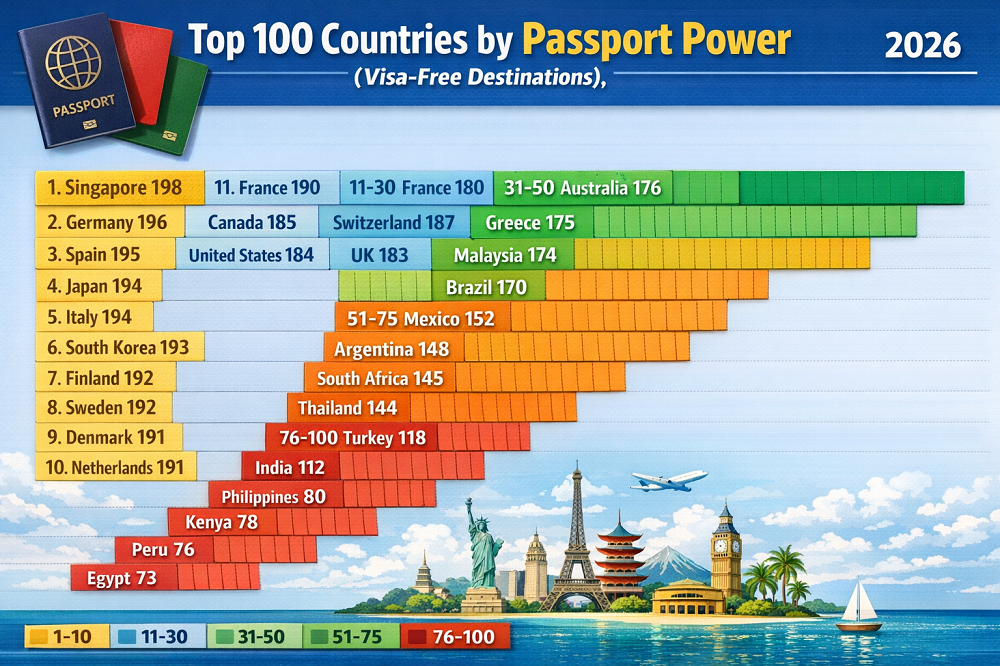
Top 100 Countries by Passport Power (Visa-Free Destinations), 2026
Strongest Passport Ranking 2026: January Henley Passport Index Snapshot
In the January 2026 Henley Passport Index snapshot, the strongest passport is Singapore, with access to 192 destinations without a prior visa. This passport ranking 2026 snapshot places Japan and South Korea at the next shared official Henley rank with 188 destinations, while a dense European group follows closely behind. Many passports share the same official rank, so the table separates entry order from Henley rank.
Answer: Singapore is the strongest passport in 2026 in the January Henley Passport Index snapshot, with 192 destinations accessible without a prior visa. The first 10 entries in the table order are Singapore, Japan, South Korea, Denmark, Luxembourg, Spain, Sweden, Switzerland, Austria and Belgium. These are not 10 separate official Henley ranks, because tied access scores create shared positions.
The January 2026 snapshot is presented as the first 100 passport entries from the published order. Because the source ranking contains many ties, the table keeps the official Henley rank and adds a separate Entry order for easier scanning. The 100th entry in this table is Henley rank 51, not official rank 100.
Strongest passports 2026: top entries in the January Henley Index
The top of the strongest passports 2026 ranking shows two clear patterns. First, the lead group is concentrated in Asia-Pacific and Europe, where long-standing reciprocity and stable travel-document systems support broad mobility. Second, the upper tier is tight: several passports are separated by only one or two destinations, and many share the same official Henley rank. Passport power is best read as a measure of travel friction rather than as a simple league table.
Henley rank 1. The strongest passport in the January 2026 snapshot and a clear example of Asia’s continuing strength in global mobility.
Henley rank 2. Japan remains part of the elite tier, showing how deeply embedded its global travel access still is.
Henley rank 2. South Korea matches Japan and reinforces East Asia’s presence near the very top.
Henley rank 3. Denmark sits inside a dense European cluster where broad and stable access matters more than small month-to-month shifts.
Henley rank 3. A small state with very broad travel access, supported by European integration and strong international trust in its documentation systems.
Henley rank 3. Spain stays firmly among the most practical passports in the world for both leisure and business mobility.
Henley rank 3. Sweden shows how consistency in institutions and reciprocity translates into long-run passport strength.
Henley rank 3. Switzerland remains one of the clearest cases where international trust supports everyday travel convenience.
Henley rank 4. Just one destination below the group above, which shows how narrow the spread is at the top.
Henley rank 4. Belgium closes the first ten passports shown on this page, but it is still part of the same high-mobility European band.
Strongest passports 2026 top 10 entries table
| Entry | Passport | Henley rank | Access score |
|---|---|---|---|
| 1 | Singapore | 1 | 192 |
| 2 | Japan | 2 | 188 |
| 3 | South Korea | 2 | 188 |
| 4 | Denmark | 3 | 186 |
| 5 | Luxembourg | 3 | 186 |
| 6 | Spain | 3 | 186 |
| 7 | Sweden | 3 | 186 |
| 8 | Switzerland | 3 | 186 |
| 9 | Austria | 4 | 185 |
| 10 | Belgium | 4 | 185 |
“Access score” means destinations reachable under Henley’s no-prior-visa methodology, including visa-free access, visa on arrival, visitor’s permits and eligible ETA treatment. Equal scores produce shared official ranks.
Passport ranking 2026 chart: top 20 entries by access score
The chart shows one of the main points of the ranking clearly: the top end is compressed rather than widely spread out. It covers the first 20 entries, not the first 20 official Henley ranks. The distance from the first passport shown here to the twentieth is only 8 destinations. In practice, small position changes near the top often matter less than headlines suggest, while wider gaps lower down the table can change travel planning much more.
The chart uses the first 20 passport entries shown on this page, not the first 20 Henley ranks. That matters because ties can create wide ranking bands.
Passport ranking 2026 table: first 100 Henley entries
The table lists the first 100 passport entries in the January 2026 Henley Passport Index snapshot. It is designed for readers searching for the strongest passports 2026 ranking, but the official Henley rank is preserved in a separate column because tied access scores create shared positions.
| Entry | Passport | Henley rank | Access score |
|---|---|---|---|
| 1 | Singapore | 1 | 192 |
| 2 | Japan | 2 | 188 |
| 3 | South Korea | 2 | 188 |
| 4 | Denmark | 3 | 186 |
| 5 | Luxembourg | 3 | 186 |
| 6 | Spain | 3 | 186 |
| 7 | Sweden | 3 | 186 |
| 8 | Switzerland | 3 | 186 |
| 9 | Austria | 4 | 185 |
| 10 | Belgium | 4 | 185 |
| 11 | Finland | 4 | 185 |
| 12 | France | 4 | 185 |
| 13 | Germany | 4 | 185 |
| 14 | Greece | 4 | 185 |
| 15 | Ireland | 4 | 185 |
| 16 | Italy | 4 | 185 |
| 17 | Netherlands | 4 | 185 |
| 18 | Norway | 4 | 185 |
| 19 | Hungary | 5 | 184 |
| 20 | Portugal | 5 | 184 |
| 21 | Slovakia | 5 | 184 |
| 22 | Slovenia | 5 | 184 |
| 23 | United Arab Emirates | 5 | 184 |
| 24 | Croatia | 6 | 183 |
| 25 | Czechia | 6 | 183 |
| 26 | Estonia | 6 | 183 |
| 27 | Malta | 6 | 183 |
| 28 | New Zealand | 6 | 183 |
| 29 | Poland | 6 | 183 |
| 30 | Australia | 7 | 182 |
| 31 | Latvia | 7 | 182 |
| 32 | Liechtenstein | 7 | 182 |
| 33 | United Kingdom | 7 | 182 |
| 34 | Canada | 8 | 181 |
| 35 | Iceland | 8 | 181 |
| 36 | Lithuania | 8 | 181 |
| 37 | Malaysia | 9 | 180 |
| 38 | United States | 10 | 179 |
| 39 | Bulgaria | 11 | 178 |
| 40 | Romania | 11 | 178 |
| 41 | Monaco | 12 | 177 |
| 42 | Chile | 13 | 175 |
| 43 | Cyprus | 14 | 174 |
| 44 | Andorra | 15 | 171 |
| 45 | Hong Kong (SAR China) | 15 | 171 |
| 46 | Argentina | 16 | 169 |
| 47 | Brazil | 16 | 169 |
| 48 | San Marino | 17 | 168 |
| 49 | Israel | 18 | 165 |
| 50 | Barbados | 19 | 162 |
| 51 | Brunei | 19 | 162 |
| 52 | The Bahamas | 20 | 158 |
| 53 | Mexico | 21 | 157 |
| 54 | St. Vincent and the Grenadines | 22 | 156 |
| 55 | Uruguay | 22 | 156 |
| 56 | St. Kitts and Nevis | 23 | 155 |
| 57 | Antigua and Barbuda | 24 | 154 |
| 58 | Seychelles | 24 | 154 |
| 59 | Vatican City | 25 | 152 |
| 60 | Costa Rica | 26 | 148 |
| 61 | Panama | 26 | 148 |
| 62 | Grenada | 27 | 147 |
| 63 | Mauritius | 27 | 147 |
| 64 | Trinidad and Tobago | 28 | 146 |
| 65 | Dominica | 29 | 145 |
| 66 | Paraguay | 29 | 145 |
| 67 | St. Lucia | 29 | 145 |
| 68 | Ukraine | 30 | 143 |
| 69 | Peru | 31 | 142 |
| 70 | Macao (SAR China) | 32 | 141 |
| 71 | Taiwan (Chinese Taipei) | 33 | 139 |
| 72 | Serbia | 34 | 136 |
| 73 | El Salvador | 35 | 132 |
| 74 | Guatemala | 35 | 132 |
| 75 | Solomon Islands | 36 | 131 |
| 76 | Colombia | 37 | 130 |
| 77 | Honduras | 37 | 130 |
| 78 | Marshall Islands | 38 | 128 |
| 79 | Montenegro | 38 | 128 |
| 80 | North Macedonia | 38 | 128 |
| 81 | Samoa | 38 | 128 |
| 82 | Tonga | 39 | 127 |
| 83 | Nicaragua | 40 | 125 |
| 84 | Tuvalu | 41 | 124 |
| 85 | Bosnia and Herzegovina | 42 | 122 |
| 86 | Georgia | 42 | 122 |
| 87 | Kiribati | 42 | 122 |
| 88 | Albania | 43 | 121 |
| 89 | Micronesia | 43 | 121 |
| 90 | Palau Islands | 43 | 121 |
| 91 | Moldova | 44 | 120 |
| 92 | Venezuela | 45 | 118 |
| 93 | Russian Federation | 46 | 113 |
| 94 | Türkiye | 46 | 113 |
| 95 | Qatar | 47 | 111 |
| 96 | South Africa | 48 | 101 |
| 97 | Belize | 49 | 99 |
| 98 | Kuwait | 50 | 96 |
| 99 | Ecuador | 51 | 94 |
| 100 | Timor-Leste | 51 | 94 |
Source basis: Henley Passport Index, January 2026 global ranking. This table covers the first 100 passport entries in descending score order from that published snapshot. Because official Henley ranks include ties, this is not a list of 100 separate official ranks.
Methodology: how the Henley Passport Index ranks the strongest passports
The table uses the January 2026 release of the Henley Passport Index as its main source. Henley states that the index covers 199 passports and 227 destinations, using IATA travel-information data that is then reviewed and updated through Henley’s own research process. That monthly update cycle matters because mobility rankings are not static. Waiver agreements, temporary suspensions, ETA rollouts, and geopolitical disruptions can all change the score of a passport without changing the passport itself.
Henley’s access score counts destinations that can be reached without obtaining a visa before departure. This includes visa-free access, visa on arrival, a visitor’s permit and ETA where Henley treats the process as equivalent to no prior visa. An e-Visa still counts as prior authorization and is not scored the same way. That distinction is one reason why passport rankings on the same broad topic can produce slightly different results.
The table follows the January 2026 Henley ranking order and preserves shared official ranks. It separates Entry order from Henley rank because many passports share the same official position, and the first 100 entries do not represent 100 separate Henley ranks.
Insights: what the strongest passports in 2026 show
The first conclusion is that the strongest passports form a very compressed top tier. Singapore leads, but the gap from first place to the broader European cluster is small. For readers, that means ranking changes near the top often reflect modest differences in convenience rather than fundamentally different mobility conditions.
The second conclusion is that Asia-Pacific remains strongly positioned at the top. Singapore stays first, Japan and South Korea remain near the summit, and Malaysia is still high by global standards. These positions reflect more than tourism. They also point to secure documentation, broad reciprocity, and consistent external policy.
The third conclusion is that Europe dominates by depth. Even when Europe does not hold the single top score, it fills much of the upper tier with passports that remain highly functional across continents. Schengen integration and long-established bilateral access still give Europe the deepest cluster of high-mobility passports.
A fourth pattern is the importance of mobility strategy. The UAE’s shared Henley rank 5 shows that passport strength can improve over time through active visa diplomacy and sustained openness. Passport power is therefore shaped partly by policy, not only by historical position.
The final point is that the global mobility gap remains severe. Henley’s January 2026 release places the highest score at 192 and the lowest at 24, a spread of 168 destinations. That is why passport rankings matter beyond prestige: they reflect unequal access to travel, education, business opportunity, family connection, and emergency mobility.
What the strongest passports 2026 ranking means for readers
For a frequent traveler, passport power is best understood as a measure of planning friction. A stronger passport usually means fewer appointments, fewer document bundles, fewer uncertain outcomes, and more freedom to book around work and family schedules. The difference becomes most visible when trips are short-notice, multi-country, or tied to strict business timelines.
For internationally mobile professionals, a weaker passport does not block opportunity, but it can make that opportunity harder and more expensive to use. It often requires more lead time, more paperwork, and more buffer for refusals or slow consular processing. In practice, that affects conference attendance, project deployment, relocation timing, and international staffing decisions.
For people researching migration, residence, or second citizenship, this ranking is useful but incomplete. A strong passport improves movement, but it does not tell you enough about tax exposure, cost of living, healthcare, political stability, education systems, or how realistic it is to obtain and keep that status. The practical use of the ranking is narrower: it shows how much cross-border friction a nationality removes, not whether that country is automatically the best long-term destination overall.
FAQ: strongest passports 2026 and Henley tie-ranks
Why is Singapore first in 2026?
Because in the January 2026 Henley snapshot it has the highest access score of any passport: 192 destinations without a prior visa. It is also the only passport alone at the top in that release.
Does “passport power” mean purely visa-free travel?
Not exactly. In Henley’s methodology, the score captures access without a prior visa. ETAs are treated as effectively visa-free for scoring purposes, while e-Visas still involve prior authorization and are not treated the same way. That is why “visa-free” headlines often oversimplify the ranking.
Why do so many countries share the same rank?
Because the source ranking is score-based. If several passports reach the same number of destinations, they share the same official Henley rank. This page separates “Entry” from “Henley rank” so the reader can scan a clean ordered table without losing that original tie structure.
Is this a list of 100 official Henley ranks?
No. It is a list of the first 100 passport entries from the January 2026 snapshot. Because tied scores create shared ranks, the 100th entry shown here corresponds to Henley rank 51.
Why is Europe so strong in the upper tier?
Europe benefits from dense reciprocity, stable documentation standards, Schengen integration, and long-developed diplomatic links. Together, those factors create not just one or two powerful passports, but a broad high-mobility cluster across the region.
Why is the UAE such a notable case in passport rankings?
Because it shows that passport strength can improve materially through policy. Henley identifies the UAE as the strongest long-run climber over the past two decades, making it one of the clearest examples of mobility gains driven by diplomatic strategy rather than legacy advantage alone.
Did the US and UK improve or weaken?
The US returned to the top 10 in the January 2026 release, but Henley also notes that both the US and the UK recorded their sharpest annual losses in access over the previous year and remain below earlier highs. The picture is therefore mixed rather than simply stronger or weaker.
Should I use passport power as a relocation decision tool?
Use it as one decision layer, not the whole answer. Passport strength matters for mobility, but relocation decisions also depend on residency rules, tax treatment, work rights, healthcare access, family considerations, and the realistic path to obtaining or retaining the status in question.
Sources for the strongest passports 2026 ranking
-
Henley Passport Index — official ranking page
Main reference for the current index interface and monthly ranking framework.
https://www.henleyglobal.com/passport-index/ranking -
Henley Passport Index 2026 January Global Ranking PDF
Used for the exact January 2026 score snapshot and the passport-by-passport ordering.
https://cdn.henleyglobal.com/storage/app/media/HPI/Henley%20Passport%20Index%202026%20January%20Global%20Ranking.pdf -
Henley Passport Index — methodology
Defines the data base, destination count, treatment of ETAs, and tie logic.
https://www.henleyglobal.com/passport-index/about -
Henley Global Mobility Report — January 2026
Used for the global average, top-versus-bottom gap, and the broader context behind the rankings.
https://www.henleyglobal.com/publications/global-mobility-report/2026-january -
International Air Transport Association (IATA)
Henley identifies IATA travel-information data as the official underlying data source for the index.
https://www.iata.org/
StatRanker (Website)
administrator
