


Top OECD Countries by Tax Wedge on Labor, 2025
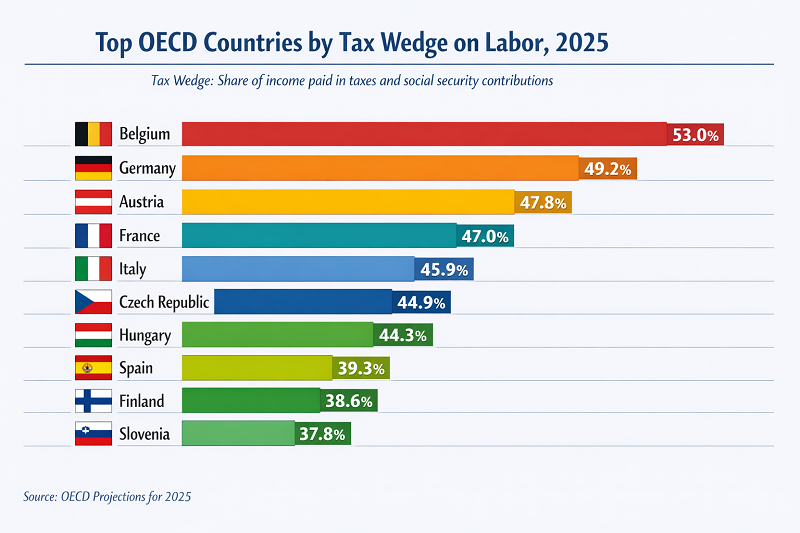
The tax wedge is the gap between what an employer pays to hire a worker and what that worker actually takes home after income tax and social contributions. In plain language, it shows how much of total labour cost is absorbed by taxes and compulsory payroll charges rather than turning into spendable pay. For a 2025 ranking page, the correct benchmark is the latest comparable OECD dataset in Taxing Wages 2025, where the underlying values refer to 2024 tax rules and average wages. The cleanest baseline is a single worker at average wage, no children, because it avoids mixing labour-tax design with family-transfer policy.
Thank you for reading this post, don't forget to subscribe!Top 10 OECD countries by labour tax wedge
The ranking is led by continental European systems where the tax burden on labour is driven not only by personal income tax, but also by large employer and employee social security contributions. A high tax wedge does not always mean that workers face the highest income tax rate in the everyday sense. In several countries, the wedge is pushed up mainly by charges paid on top of gross wages by employers. That distinction matters for salary comparisons, relocation decisions and payroll-cost planning.
| Rank | Country | Tax wedge % | Income tax % | Employee SSC % | Employer SSC % | Net average tax rate % | Take-home pay share % |
|---|---|---|---|---|---|---|---|
| 1 | Belgium | 52.6 | 20.3 | 11.0 | 21.3 | 39.7 | 47.4 |
| 2 | Germany | 47.9 | 13.9 | 17.3 | 16.8 | 37.5 | 52.1 |
| 3 | France | 47.2 | 12.3 | 8.3 | 26.7 | 28.1 | 52.8 |
| 4 | Italy | 47.1 | 15.9 | 7.2 | 24.0 | 30.4 | 52.9 |
| 5 | Austria | 47.0 | 11.6 | 14.0 | 21.6 | 32.7 | 53.0 |
| 6 | Slovenia | 44.6 | 10.4 | 20.3 | 13.9 | 35.7 | 55.4 |
| 7 | Slovak Republic | 42.6 | 8.1 | 10.1 | 24.4 | 24.1 | 57.4 |
| 8 | Finland | 41.9 | 17.4 | 7.8 | 16.6 | 30.2 | 58.1 |
| 9 | Latvia | 41.7 | 14.1 | 8.5 | 19.1 | 27.9 | 58.3 |
| 10 | Sweden | 41.5 | 12.2 | 5.3 | 23.9 | 23.0 | 58.5 |
Tax wedge, income tax and SSC components are shown as a share of labour cost. The net average tax rate is shown as a share of gross wage. Take-home pay share here means the share of total employer labour cost that ends up as the worker’s net pay, so it is the simple complement to the tax wedge. Derived columns are rounded and may differ by one tenth where small cash benefits apply.
Continue exploring
More StatRanker rankings on public finance, tax burden, debt and government spending.
US States by Income Tax Burden, 2026 Snapshot
Open rankingTOP 30 Countries by Tax-to-GDP Ratio (2025)
Open rankingTop 100 Jurisdictions with the Lowest VAT/GST and Sales Tax Rates, 2026 Snapshot
Open rankingFast read: Belgium stands out because both employee-side and employer-side charges are heavy. France reaches a similarly high total wedge through exceptionally large employer SSCs, while Slovenia is unusual because the employee-side contribution is very large relative to peers. That is why two countries can have similar total wedges but very different salary optics for workers and very different payroll burdens for firms.
What sits inside the tax wedge
OECD’s labour-tax model is useful because it does not stop at income tax. It asks a broader question: out of the full cost of employing a standard worker, how much is absorbed by compulsory tax-like charges before the worker receives spendable income? That makes the metric much more informative than casual talk about “high-tax countries.”
Personal income tax
This is the most visible part for workers because it appears directly on the payslip. But it is not always the dominant component of the wedge. Denmark is the clearest counterpoint: it has a very high income-tax component, but relatively limited social contributions compared with many continental systems. In a ranking by tax wedge, Denmark does not lead even though its income-tax share is very high.
Employee social security contributions
These are mandatory deductions from gross pay that reduce what the worker keeps before any consumption decision is made. They matter a lot in systems where pension, sickness and other social insurance branches are financed heavily from payroll. Slovenia, Lithuania and Poland are examples where employee-side charges are a big part of the worker-facing burden.
Employer social security contributions
This is the component that many casual comparisons miss. It does not reduce net pay directly on the payslip, but it does raise the full cost of hiring. France, Italy, Spain, Czechia and Estonia show how a country can look only moderately taxed from the worker’s gross-pay perspective while still imposing a very high total burden on labour cost through employer-side charges.
Cash benefits
In the OECD formula, cash benefits reduce the wedge. For the single-worker benchmark they are usually zero or very small, which is why the ranking is dominated by taxes and social contributions. This changes for family households. Once children enter the model, cash transfers and family tax credits can materially lower the effective burden, which is exactly why household type should never be mixed without explanation.
Household benchmark check
The single worker at average wage is the main ranking scenario because it is clean and widely cited. But family situations can look very different. That is not a flaw in the metric. It reflects the fact that many tax systems deliberately subsidise families through transfers and tax relief.
| Benchmark household | Income assumption | OECD average tax wedge | Why it differs |
|---|---|---|---|
| Single worker, no children | 100% of average wage | 34.9% | Cleanest labour-tax baseline with little or no family support in the model. |
| One-earner couple, two children | 100% of average wage | 25.8% | Family cash benefits and tax relief lower the burden relative to the single benchmark. |
| Single parent, two children | 67% of average wage | 15.8% | Both lower earnings and family support sharply reduce the modelled labour-tax burden. |
Chart 1. Top 15 OECD tax wedges split by component
A stacked horizontal chart is more useful than a plain ranking bar because it shows which mechanism drives the burden. Belgium and Germany combine high worker-side and employer-side charges. France rises mainly because of employer contributions. Denmark has a high income-tax share but does not enter this top 15 because the social-contribution side is much lighter.
The ranking still works without JavaScript. Here is the same Top 15 order used in the chart:
- Belgium — 52.6%
- Germany — 47.9%
- France — 47.2%
- Italy — 47.1%
- Austria — 47.0%
- Slovenia — 44.6%
- Slovak Republic — 42.6%
- Finland — 41.9%
- Latvia — 41.7%
- Sweden — 41.5%
- Hungary — 41.2%
- Czechia — 40.9%
- Spain — 40.6%
- Estonia — 40.6%
- Luxembourg — 40.3%
The chart plots income tax, employee SSC and employer SSC as shares of labour cost. Cash benefits are not plotted as a separate negative bar because, for the single-worker benchmark, they are generally zero or very small. That means totals can differ slightly from the official wedge in countries where small benefits apply.
Why the highest labour tax wedge is not the same as the highest tax-to-GDP ratio
This is the core distinction that prevents intent overlap with a tax-to-GDP page. Tax-to-GDP is a macro fiscal ratio. It tells you how much tax revenue the state collects relative to the size of the economy. Tax wedge is a labour-market cost indicator. It tells you how much of a model worker’s labour cost is absorbed before it becomes take-home pay.
The two rankings overlap only partly. Belgium leads the OECD labour-tax wedge ranking for the standard single worker, but it is not the country with the highest aggregate tax-to-GDP ratio. Denmark leads the latter because its overall tax system collects a very large share of GDP, even though its labour wedge is not the highest. France and Austria sit high on both measures, but again for different structural reasons. Tax-to-GDP depends on the full tax mix: consumption taxes, capital taxation, social contributions, corporate receipts, resource cycles and the size of the tax base. Tax wedge isolates the labour channel for a specific household model.
Practical reading rule: use tax wedge when your question is about payroll cost, net pay, relocation, salary benchmarking or hiring economics. Use tax-to-GDP when your question is about fiscal capacity, state size, revenue structure or macro comparisons across public sectors.
For internal context, read this page together with Top 100 Countries by Tax-to-GDP Ratio (%), 2025 and Top 100 Countries by Median Wage (PPP), 2025. Median wage helps answer the question that tax wedge alone cannot: what level of pay is available before the tax system starts taking its share.
What this means for workers, employers and relocators
For workers, the labour tax wedge is a reminder that a generous-looking gross salary can translate into a much less impressive net outcome, especially in systems with large employee contributions or progressive income taxes. For employers, the same wage can imply very different total payroll costs depending on how much sits in employer SSCs. For relocators, the wedge helps explain why some countries with high wages still feel less attractive on a net-pay basis, while others with lighter payroll burdens convert labour cost into take-home pay more efficiently.
The metric is also useful for interpreting wage rankings. A country can score very well on median wage yet still leave a smaller share of labour cost in the worker’s pocket than another country with a lower gross pay benchmark. That is why salary analysis should usually pair three pages: median wage, disposable or net income, and labour tax wedge. Taken together, they show the path from labour productivity to gross pay and from gross pay to net household purchasing power.
None of this means that a high wedge automatically makes workers worse off in welfare terms. Some high-wedge countries finance strong social insurance, public services and lower out-of-pocket risk. But for an individual comparing contracts, payroll budgets or relocation packages, the wedge is the cleanest first-pass measure of how labour cost is divided between the worker and the state-linked system around the worker.
Methodology
This ranking page is labelled 2025 because it is built from OECD Taxing Wages 2025, the latest fully comparable edition available for OECD labour-tax benchmarking. The underlying country values refer to 2024 tax rules and 2024 average wages. That is the standard timing convention for this indicator and should be stated explicitly to avoid confusion.
The main ranking uses the OECD’s benchmark case of a single full-time worker, no children, earning 100% of the average wage. This is the most cited cross-country scenario and the cleanest one for comparing labour-tax design without introducing family-transfer policy. The tax wedge is defined as personal income tax + employee social security contributions + employer social security contributions + payroll taxes − cash benefits, expressed as a share of labour costs. Labour cost means gross wage plus employer SSCs, not just the worker’s contract salary.
The table keeps the official OECD wedge and component logic, while derived columns are rounded for readability. The net average tax rate is shown as an after-tax burden on gross wage for the benchmark worker. The take-home pay share is shown as the worker’s net pay as a share of total labour cost, which is the direct complement to the wedge. Small differences of one tenth can appear because OECD tables are separately rounded and because cash benefits are zero in most cases but not always perfectly zero.
This page does not rank non-OECD countries, because there is no equally standardised official global dataset with the same household modelling rules. It also does not describe the self-employed, marginal tax rates, top statutory tax rates or total household effective tax burden across all income sources. It is a precise labour-cost benchmark for a specific model worker. The macro comparison block uses OECD Revenue Statistics 2025 for tax-to-GDP context.
FAQ
What is the tax wedge?
It is the share of a worker’s total labour cost that does not become the worker’s net take-home pay. OECD measures it by combining income tax, employee SSCs, employer SSCs and payroll taxes, then subtracting any cash benefits, and dividing the result by labour cost.
Is tax wedge the same as income tax?
No. Income tax is only one part of the wedge. In many OECD systems, employer and employee social contributions are just as important and can even be the main reason the total wedge is high.
Why can a country have a high tax-to-GDP ratio but not the highest labour tax wedge?
Because tax-to-GDP reflects the whole tax system, not just labour. A country can raise large revenues through VAT, capital taxes, resource-related taxes or broad income-tax bases without necessarily imposing the highest wedge on the benchmark worker. Denmark is the classic example in current OECD data.
Why do family households face a different tax wedge?
Because many tax systems deliberately lower the effective burden for households with children through cash transfers, tax credits or spouse-related relief. That changes the result even when gross wage is the same.
Does a high tax wedge always mean workers are worse off?
Not necessarily. A high wedge can finance social insurance, pensions, healthcare or other public services that reduce private out-of-pocket costs. But if your question is specifically about salary conversion, take-home pay or payroll cost, the wedge is still the right first metric.
Is the tax wedge the same as a marginal tax rate?
No. The tax wedge on this page is an average burden for a standard worker at a specific earnings level. A marginal tax rate asks what happens to an extra unit of earnings. Those are related but not interchangeable concepts.
Why use the single worker at average wage as the main ranking?
Because it is the OECD’s most comparable and most frequently cited baseline. It strips away much of the policy noise tied to family transfers and gives a clean cross-country view of labour taxation for a standard employee.
Official sources
- OECD Taxing Wages 2025 — main source for the single-worker ranking, household benchmarks and labour-tax methodology.
- OECD Taxing Wages 2025 Overview and tables — country rankings, component breakdowns and definitions.
- OECD Taxing Wages 2025 brochure — concise benchmark summary for wedge and net personal average tax rate.
- OECD Revenue Statistics 2025 — tax-to-GDP comparison used in the macro versus labour-tax distinction.
Related rankings
More StatRanker rankings on public finance, tax burden, debt and government spending.
Top 10 countries by tax-to-GDP ratio
Open rankingFiscal Federalism: How Taxes Are Shared Between Central and Regional Governments
Open rankingGreen taxation: how is sustainable consumption incentivized?
Open rankingTax Burden on the Self-Employed: New Class or Grey Zone?
Open rankingIntroduction to Digital Tax Systems
Open rankingEffectiveness of Tax Incentives for Businesses in the U.S. (2020–2025)
Open rankingEvolution of the U.S. Tax System, 2020–2025: Major Federal Changes in a 2026 Snapshot
Open rankingUS Federal Budget Structure: Where Citizens’ Taxes Go
Open rankingStatRanker (Website)
administrator
