

Top Helium-Producing Countries in the World (2025 Ranking)
Helium is one of the smallest commodity markets in volume terms, but it sits inside a surprisingly large set of high-value industries. It is essential for MRI systems, semiconductor manufacturing, scientific research, aerospace work, leak detection, controlled atmospheres, and a range of specialist laboratory uses. What makes helium economically unusual is that it is not produced everywhere and it is not easy to replace when very low temperatures are required.
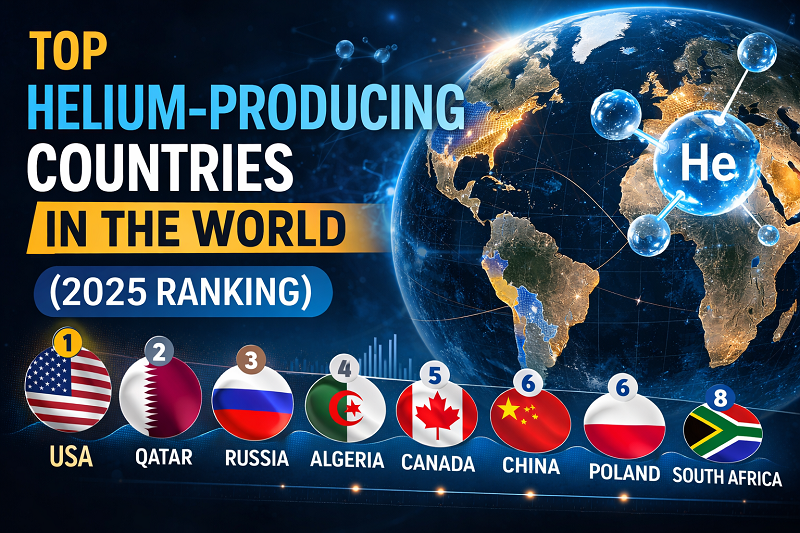
The latest official country table published by the U.S. Geological Survey in February 2026 reports estimated helium production for 2025. It shows a highly concentrated market: the United States and Qatar remain the dominant suppliers by a wide margin, while Russia, Algeria, Canada, China, and Poland form a much smaller second tier. South Africa is also listed as a producer, but at less than half a million cubic meters in the summary table.
Latest available year used here: 2025 estimate, published by USGS in 2026.
Continue exploring
More StatRanker pages connected by topic, category or ranking theme.
Oil Reserves by Country 2026: Proven Crude Oil Reserves at End-2025
Open rankingTop 100 Countries by Installed Solar Capacity, 2026
Open rankingTop 20 Countries by Rare Earth Mine Production, 2025
Open rankingTable 1. Countries producing helium, latest official USGS estimate
| Rank | Country | Helium production, 2025e (million m³) | Share of world total |
|---|---|---|---|
| 1 | United States | 81 | 42.63% |
| 2 | Qatar | 63 | 33.16% |
| 3 | Russia | 18 | 9.47% |
| 4 | Algeria | 11 | 5.79% |
| 5 | Canada | 6 | 3.16% |
| 6 | China | 3 | 1.58% |
| 6 | Poland | 3 | 1.58% |
| 8 | South Africa | <0.5 | <0.30% |
World total: 190 million cubic meters. South Africa is reported by USGS as less than half a million cubic meters rather than a precise figure.
Methodology
This article uses the most recent country production figures published by the U.S. Geological Survey in Mineral Commodity Summaries 2026. The report provides estimated helium production by country for 2025 in million cubic meters. Because this is the latest official comparative country table currently available, it is the correct benchmark for a current ranking snapshot.
Country shares were calculated as each country’s 2025 estimated production divided by the USGS world total of 190 million cubic meters. Numbers are shown exactly as reported where available. South Africa is included because the country is explicitly listed by USGS as a producer, but its output is reported only as less than half a million cubic meters rather than a precise volume.
One important limitation is that helium is not a typical mined commodity with a wide and stable producer map. In most cases it is separated from helium-rich natural gas streams, and only part of the extracted helium reaches the refined market. That means annual output depends not only on underground geology, but also on gas processing, purification capacity, storage, logistics, sanctions, and the commercial decision to recover helium at all.
Key insights
The first major takeaway is concentration. The United States and Qatar alone account for about three-quarters of global output in the 2025 estimate. That is unusually concentrated for a strategically important industrial gas and helps explain why outages, sanctions, refinery delays, or transport disruptions can move the market quickly.
The second takeaway is that helium is really a processing and infrastructure story as much as a resource story. USGS notes that helium is largely extracted as a byproduct of natural gas, and only part of that supply is refined into marketable helium. In practice, refinery capacity and logistics often matter as much as raw resource endowment.
The third takeaway is that the market is not completely static. USGS reported new helium operations in the United States in 2025, a new facility in Canada, and another in South Africa. Even so, the broader USGS outlook says helium capacity is expected to remain broadly stable or grow only moderately through 2029 rather than surge the way lithium or cobalt capacity may.
What this means for readers
For hospitals, chipmakers, laboratories, aerospace firms, universities, and industrial buyers, the ranking is a supply-risk map. A market with very few major producing countries is more exposed to bottlenecks than a broadly diversified commodity market. If one of the top producers has technical problems or export barriers, supply conditions can tighten quickly.
For investors and analysts, helium is a reminder that strategic importance does not require a huge market. The volumes are small compared with many minerals and fuels, but the gas is critical in several advanced applications. The economics therefore depend on reliability, purification, transport, and contract structure, not just raw production.
For general readers, the ranking helps explain why helium is not just about party balloons. The highest-value demand comes from sectors where performance and purity matter, especially cryogenics, electronics, research, and medical imaging.
FAQ
The United States is the largest producer in the latest official USGS estimate, with 81 million cubic meters in 2025. That is a little over 42% of the reported world total.
Qatar is the second-largest producer at 63 million cubic meters and one of the key exporting hubs. Because the global producer base is so narrow, Qatar has an outsized role in keeping international supply balanced.
Usually no. Helium is mostly recovered from helium-rich natural gas streams during processing. Some newer projects are nonhydrocarbon sourced, but the market is still heavily linked to gas infrastructure and purification capacity.
A country needs suitable geology, processing plants, purification capacity, storage, and specialized transport. Having helium in the ground is not enough. The commercial chain from gas field to refined helium is technically demanding and capital intensive.
Not in the most demanding cryogenic uses. USGS notes that nothing substitutes for helium in applications requiring temperatures below minus 429 degrees Fahrenheit. In some other uses, substitution is possible, and recycling can improve resilience.
New activity is appearing, especially in North America and parts of Africa, but the ranking still shows a very concentrated market. Canada is growing, South Africa has entered the producer list, and the United States added new operations in 2025, yet the top of the market remains dominated by the same few countries.
No. Reserves matter, but annual production also depends on project timing, gas processing, refinery capacity, transport, sanctions, and market conditions. Production rankings and reserve rankings do not always line up year by year.
Sources
1. U.S. Geological Survey. Mineral Commodity Summaries 2026: Helium and Rare Gases.
https://pubs.usgs.gov/periodicals/mcs2026/mcs2026-helium.pdf
2. U.S. Geological Survey. Helium Statistics and Information.
https://www.usgs.gov/centers/national-minerals-information-center/helium-statistics-and-information
3. U.S. Geological Survey. World Minerals Outlook—Cobalt, Gallium, Helium, Lithium, Magnesium, Palladium, Platinum, and Titanium Through 2029.
https://pubs.usgs.gov/sir/2025/5021/Version%201.0/sir20255021.pdf
Update basis: latest official country production table available at the time of writing. Production values are USGS estimates for 2025, published in 2026.
Related rankings
More StatRanker pages connected by topic, category or ranking theme.
Countries by Phosphate Rock Mine Production, 2025
Open rankingTop 50 Countries by Uranium Mine Production (2025 Edition)
Open rankingTop 100 Countries by Bauxite Mine Production (2025) — Ranking, Concentration, and Aluminium Linkages
Open rankingTop 30 Countries by Natural Graphite Mine Production, 2025
Open rankingStatRanker (Website)
administrator
