

Renewable Electricity Share by U.S. State: 2025 Generation Ranking
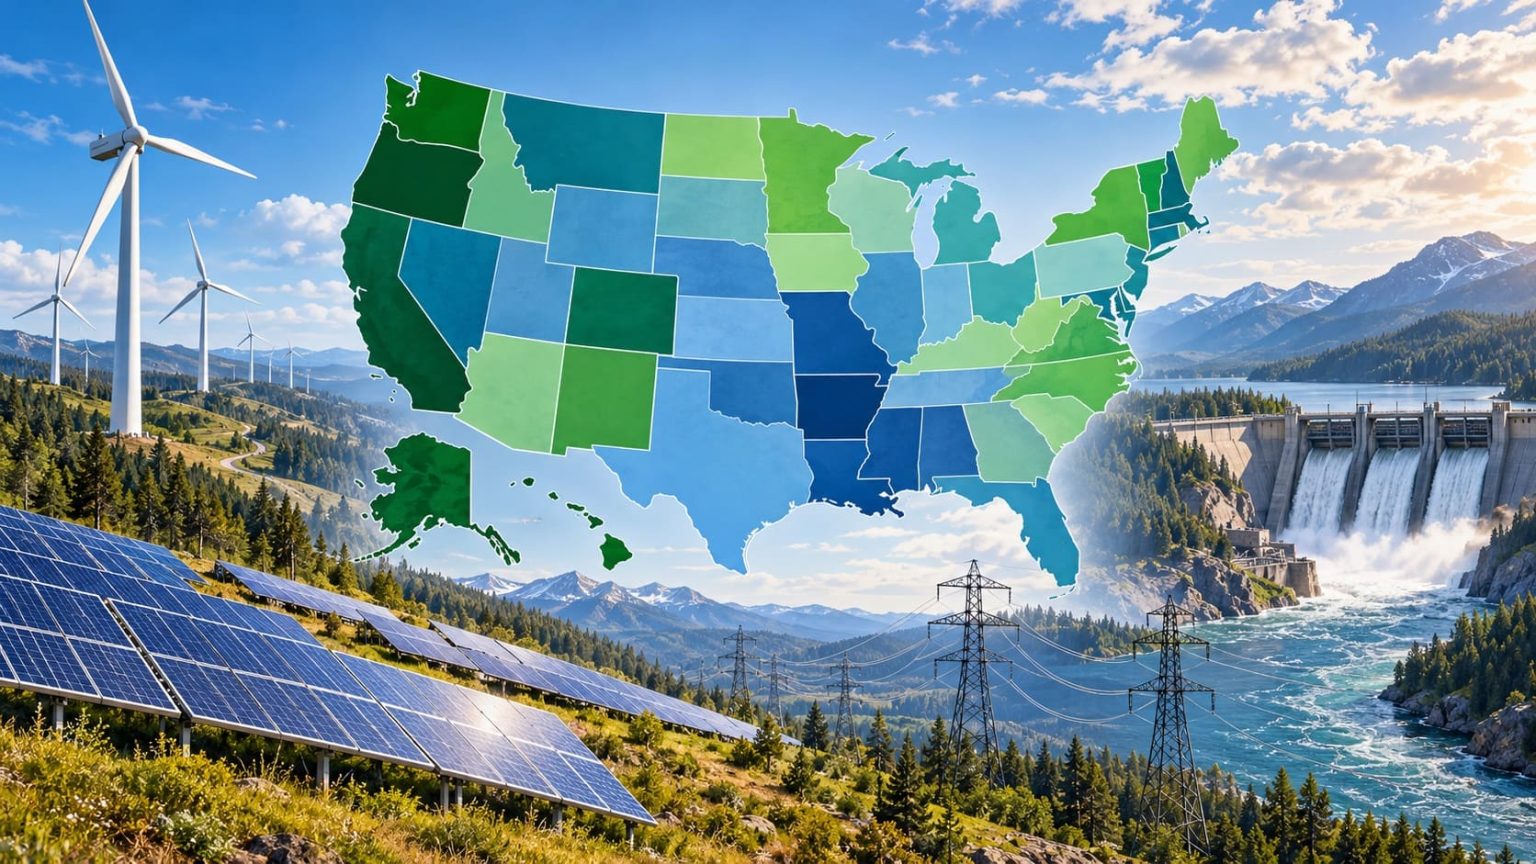
Which U.S. States Generated the Highest Share of Renewable Electricity in 2025?
Vermont ranked first in 2025 at 99.85% renewable electricity, followed by South Dakota (79.53%) and Washington (73.22%). Texas produced the most renewable electricity by volume (198.117 TWh), but ranked 18th by renewable share (32.97%).
This ranking measures renewable electricity as a percentage of in-state utility-scale net generation, not electricity consumption. It covers 49 U.S. states, ranked highest to lowest in percent (%), using final 2025 U.S. Energy Information Administration (EIA) generation data. StatRanker calculated all 49 percentages from published generation figures (calculated_value); none is a forecast or modeled projection. Rhode Island is unranked because EIA reports its 2025 conventional-hydro value as NM. Data retrieved: October 29, 2026.
View the complete 49-state ranking
Vermont, rank 1. Its numerator is 2,030 GWh from 2,033 GWh total generation.
Connecticut, rank 49. Rhode Island has no calculated rank.
Median of the 49 published-input state percentages; unweighted mean: 28.50%.
Texas, 2025. Highest renewable MWh; rank 18 by renewable percentage.
Calculated separately from EIA national 2025 totals; includes all states and D.C.
2025 generation data from EIA. Every state percentage is calculated from reported output; no estimated or forecast figures.
Overview: Share versus production volume
Texas generated 198.117 TWh of renewable electricity in 2025—about 97.6 times Vermont's 2.030 TWh. Yet renewables accounted for only 32.97% of Texas's in-state utility-scale generation, compared with 99.85% in Vermont, a gap of 66.89 percentage points. The ranking measures a state's renewable share, not its total renewable output.
For each state, the numerator combines utility-scale wind, solar, conventional hydropower, biomass and geothermal generation. The denominator is all utility-scale net generation from all sources in the same year. Small-scale rooftop solar is excluded from both so that the numerator and denominator remain comparable.
At the U.S. level, EIA reported 1,064,103 GWh of renewable generation out of 4,425,029 GWh of total utility-scale generation in 2025 (24.05%), versus 976,463 GWh out of 4,308,634 GWh in 2024 (22.66%). The increase is 1.38 percentage points, calculated from unrounded shares; subtracting the two rounded display values gives 1.39 points. This national benchmark includes Rhode Island and D.C. and is not the sum of the 49 ranked state rows.
Top 10 states by renewable electricity share in 2025
The top ten all exceeded 50% of their in-state utility-scale generation from renewable sources. The ranking uses unrounded calculated shares; the displayed percentages and annual movements are rounded to two decimals.
| Rank | State | Renewable share | Region / 2024-to-2025 movement |
|---|---|---|---|
| 1 | Vermont | 99.85% | Northeast; 99.78% in 2024, +0.07 pp in 2025 |
| 2 | South Dakota | 79.53% | Midwest; 81.61% in 2024, -2.07 pp in 2025 |
| 3 | Washington | 73.22% | West; 69.48% in 2024, +3.74 pp in 2025 |
| 4 | Idaho | 68.50% | West; 68.29% in 2024, +0.21 pp in 2025 |
| 5 | Oregon | 64.48% | West; 61.41% in 2024, +3.07 pp in 2025 |
| 6 | Iowa | 62.02% | Midwest; 65.55% in 2024, -3.52 pp in 2025 |
| 7 | Maine | 57.80% | Northeast; 53.82% in 2024, +3.98 pp in 2025 |
| 8 | Montana | 56.36% | West; 57.44% in 2024, -1.09 pp in 2025 |
| 9 | California | 55.26% | West; 50.80% in 2024, +4.46 pp in 2025 |
| 10 | New Mexico | 52.87% | West; 49.44% in 2024, +3.43 pp in 2025 |
Source: EIA Tables 3.7, 3.14 and 3.15; all 2025 and 2024 figures are final. The shares and percentage-point changes are StatRanker calculations.
Chart: Top 20 states by 2025 renewable generation share
Each bar represents the same 2025 value as the full table. The difference between the first and twentieth state is shown on a common 0–100% scale.
Wind, utility-scale solar and hydropower: share leaders and Texas
The 2025 output below is measured in GWh (equivalent to EIA's thousand MWh). The solar column uses the utility-scale field from EIA Table 3.21—not its combined utility-scale-plus-small-scale field. “Other renewables” is calculated as total nonhydro renewable generation minus wind and utility-scale solar PV; it includes biomass, geothermal, solar thermal and any rounding residual.
| State | Wind GWh | Solar PV GWh | Hydro GWh | Other renewables GWh |
|---|---|---|---|---|
| Vermont | 384 | 209 | 1,011 | 426 |
| South Dakota | 12,728 | 449 | 4,194 | 20 |
| Washington | 8,081 | 629 | 64,662 | 1,068 |
| Idaho | 2,825 | 1,628 | 8,851 | 591 |
| Oregon | 8,965 | 2,682 | 28,706 | 1,095 |
| Iowa | 43,573 | 1,286 | 1,150 | 202 |
| Maine | 2,916 | 1,489 | 2,549 | 1,625 |
| Montana | 6,232 | 350 | 8,441 | 38 |
| California | 15,095 | 53,027 | 28,146 | 17,065 |
| New Mexico | 14,389 | 6,265 | 125 | 73 |
| Texas | 130,136 | 66,058 | 885 | 1,038 |
Technology inputs: EIA Table 3.18 (wind), Table 3.21 (utility-scale solar photovoltaic), Table 3.14 (conventional hydro) and Table 3.15 (renewables excluding hydro). For example, Washington produced 64,662 GWh from conventional hydropower; Iowa produced 43,573 GWh from wind; California produced 53,027 GWh from utility-scale solar PV.
Methodology: Official generation inputs, calculated shares
Metric and direction
Share of utility-scale net generation produced from renewable sources in 2025 (%). Higher percentages rank higher. The unit for every EIA input is thousand MWh, identical to GWh.
Numerator and denominator
Numerator = EIA Table 3.14 conventional hydro + Table 3.15 renewable generation excluding hydro. Denominator = EIA Table 3.7 net generation from all sources. Use “All Sectors” fields throughout.
Exact share formula
2025 renewable share (%) = 100 × (hydro GWh 2025 + nonhydro renewable GWh 2025) ÷ all-source utility-scale net generation GWh 2025. All three values and their publication year appear in each row's note.
Historical comparison
2024 share uses the identical formula applied only to 2024 EIA input columns. Change in percentage points (pp) = 2025 share minus 2024 share, calculated before display rounding. It is not the percentage growth rate of generation.
Missing and nonmeaningful values
All 50 states were checked. Rhode Island's 2025 conventional-hydro All Sectors entry is “NM” in EIA Table 3.14. EIA defines NM as “not meaningful” under its reporting criteria, rather than as zero. The exact state share cannot be reproduced from that published cell, so Rhode Island is excluded instead of receiving an estimated value or invented rank. D.C. is excluded because it is not a state.
Status and publication
All 49 ranked shares and changes are calculated_value, derived from official observed EIA values; none is an EIA-published state share or a forecast. Historical State Data was released October 7, 2026; Electric Power Annual 2025 tables were released October 21, 2026. Retrieved October 29, 2026.
Precision and validation
Values shown in EIA annual HTML tables are rounded to thousand MWh. Rank and calculations here use those published inputs, retaining full division precision before displaying two decimal places. Independent rounding can produce small differences from EIA underlying detailed spreadsheets. Iowa Utilities Commission's 2025 EIA-923-based state report confirms Iowa's wind, solar and hydro amounts at finer precision.
What is not measured
This is not electricity consumption, retail electricity sourcing, a carbon-free ranking, installed capacity or an import-adjusted state grid mix. Nuclear is not renewable, pumped-storage hydro is excluded from the renewable numerator, and small-scale rooftop solar is not combined with utility-scale net generation.
Source roles: EIA is the single numeric publishing organization. Different EIA tables are different publications from the same organization, not independent numeric sources. The Iowa Utilities Commission provides a state-level validation cross-check based on EIA reporting. No conflicts were averaged and no missing value was imputed.
Full 2025 renewable electricity share ranking: 49 verified states
Search states, filter regions and data status, sort by share or annual change, or show the top 10, top 20 or all 49 states. Top 10 and Top 20 always refer to overall ranks, even after a region is selected. Each row shows the EIA generation inputs, source years, share change and calculation status.
Final EIA 2025 generation data · Status: calculated_value · Share of utility-scale generation (%)
| Rank | State | Share 2025 | Region / source / method note |
|---|---|---|---|
| 1 | Vermont | 99.85% | Northeast; EIA 2025: (1,019 nonhydro + 1,011 hydro) / 2,033 GWh; EIA 2024: (970 + 1,284) / 2,259 GWh; 2024 share 99.78%; change +0.07 pp; calculated_value. |
| 2 | South Dakota | 79.53% | Midwest; EIA 2025: (13,197 nonhydro + 4,194 hydro) / 21,866 GWh; EIA 2024: (12,432 + 4,601) / 20,872 GWh; 2024 share 81.61%; change -2.07 pp; calculated_value. |
| 3 | Washington | 73.22% | West; EIA 2025: (9,778 nonhydro + 64,662 hydro) / 101,670 GWh; EIA 2024: (10,410 + 60,736) / 102,398 GWh; 2024 share 69.48%; change +3.74 pp; calculated_value. |
| 4 | Idaho | 68.50% | West; EIA 2025: (5,044 nonhydro + 8,851 hydro) / 20,285 GWh; EIA 2024: (4,531 + 9,150) / 20,035 GWh; 2024 share 68.29%; change +0.21 pp; calculated_value. |
| 5 | Oregon | 64.48% | West; EIA 2025: (12,742 nonhydro + 28,706 hydro) / 64,283 GWh; EIA 2024: (12,776 + 26,933) / 64,661 GWh; 2024 share 61.41%; change +3.07 pp; calculated_value. |
| 6 | Iowa | 62.02% | Midwest; EIA 2025: (45,061 nonhydro + 1,150 hydro) / 74,505 GWh; EIA 2024: (45,158 + 1,030) / 70,464 GWh; 2024 share 65.55%; change -3.52 pp; calculated_value. |
| 7 | Maine | 57.80% | Northeast; EIA 2025: (6,030 nonhydro + 2,549 hydro) / 14,843 GWh; EIA 2024: (5,035 + 2,852) / 14,655 GWh; 2024 share 53.82%; change +3.98 pp; calculated_value. |
| 8 | Montana | 56.36% | West; EIA 2025: (6,620 nonhydro + 8,441 hydro) / 26,725 GWh; EIA 2024: (6,216 + 9,220) / 26,873 GWh; 2024 share 57.44%; change -1.09 pp; calculated_value. |
| 9 | California | 55.26% | West; EIA 2025: (85,187 nonhydro + 28,146 hydro) / 205,106 GWh; EIA 2024: (79,350 + 29,454) / 214,191 GWh; 2024 share 50.80%; change +4.46 pp; calculated_value. |
| 10 | New Mexico | 52.87% | West; EIA 2025: (20,727 nonhydro + 125 hydro) / 39,440 GWh; EIA 2024: (19,474 + 153) / 39,697 GWh; 2024 share 49.44%; change +3.43 pp; calculated_value. |
| 11 | Kansas | 47.97% | Midwest; EIA 2025: (29,710 nonhydro + 23 hydro) / 61,985 GWh; EIA 2024: (29,972 + 20) / 57,696 GWh; 2024 share 51.98%; change -4.01 pp; calculated_value. |
| 12 | Oklahoma | 45.34% | South; EIA 2025: (38,300 nonhydro + 2,456 hydro) / 89,895 GWh; EIA 2024: (38,610 + 1,582) / 94,069 GWh; 2024 share 42.73%; change +2.61 pp; calculated_value. |
| 13 | Nevada | 44.14% | West; EIA 2025: (18,067 nonhydro + 1,881 hydro) / 45,193 GWh; EIA 2024: (16,712 + 1,606) / 45,528 GWh; 2024 share 40.23%; change +3.90 pp; calculated_value. |
| 14 | Colorado | 43.12% | West; EIA 2025: (22,703 nonhydro + 1,725 hydro) / 56,645 GWh; EIA 2024: (22,629 + 1,660) / 58,798 GWh; 2024 share 41.31%; change +1.82 pp; calculated_value. |
| 15 | North Dakota | 40.58% | Midwest; EIA 2025: (15,395 nonhydro + 2,005 hydro) / 42,873 GWh; EIA 2024: (14,763 + 2,061) / 42,557 GWh; 2024 share 39.53%; change +1.05 pp; calculated_value. |
| 16 | Minnesota | 33.66% | Midwest; EIA 2025: (19,028 nonhydro + 775 hydro) / 58,830 GWh; EIA 2024: (18,232 + 868) / 58,595 GWh; 2024 share 32.60%; change +1.06 pp; calculated_value. |
| 17 | Nebraska | 33.06% | Midwest; EIA 2025: (12,010 nonhydro + 1,151 hydro) / 39,808 GWh; EIA 2024: (12,169 + 1,183) / 37,229 GWh; 2024 share 35.86%; change -2.80 pp; calculated_value. |
| 18 | Texas | 32.97% | South; EIA 2025: (197,232 nonhydro + 885 hydro) / 600,982 GWh; EIA 2024: (165,753 + 777) / 566,503 GWh; 2024 share 29.40%; change +3.57 pp; calculated_value. |
| 19 | Wyoming | 30.83% | West; EIA 2025: (13,221 nonhydro + 830 hydro) / 45,577 GWh; EIA 2024: (9,425 + 1,017) / 40,709 GWh; 2024 share 25.65%; change +5.18 pp; calculated_value. |
| 20 | New York | 28.83% | Northeast; EIA 2025: (12,815 nonhydro + 24,935 hydro) / 130,936 GWh; EIA 2024: (10,752 + 27,945) / 129,015 GWh; 2024 share 29.99%; change -1.16 pp; calculated_value. |
| 21 | Alaska | 25.80% | West; EIA 2025: (172 nonhydro + 1,773 hydro) / 7,538 GWh; EIA 2024: (174 + 1,715) / 6,691 GWh; 2024 share 28.23%; change -2.43 pp; calculated_value. |
| 22 | Utah | 22.18% | West; EIA 2025: (7,931 nonhydro + 528 hydro) / 38,144 GWh; EIA 2024: (6,581 + 759) / 35,134 GWh; 2024 share 20.89%; change +1.29 pp; calculated_value. |
| 23 | Hawaii | 21.71% | West; EIA 2025: (1,954 nonhydro + 70 hydro) / 9,323 GWh; EIA 2024: (1,846 + 100) / 9,161 GWh; 2024 share 21.24%; change +0.47 pp; calculated_value. |
| 24 | Arizona | 20.31% | West; EIA 2025: (18,878 nonhydro + 4,783 hydro) / 116,471 GWh; EIA 2024: (13,546 + 5,314) / 116,027 GWh; 2024 share 16.25%; change +4.06 pp; calculated_value. |
| 25 | Massachusetts | 17.56% | Northeast; EIA 2025: (3,178 nonhydro + 765 hydro) / 22,456 GWh; EIA 2024: (3,221 + 881) / 20,915 GWh; 2024 share 19.61%; change -2.05 pp; calculated_value. |
| 26 | Illinois | 16.73% | Midwest; EIA 2025: (31,996 nonhydro + 99 hydro) / 191,821 GWh; EIA 2024: (28,192 + 75) / 185,013 GWh; 2024 share 15.28%; change +1.45 pp; calculated_value. |
| 27 | Indiana | 16.19% | Midwest; EIA 2025: (16,997 nonhydro + 305 hydro) / 106,897 GWh; EIA 2024: (13,587 + 375) / 97,013 GWh; 2024 share 14.39%; change +1.79 pp; calculated_value. |
| 28 | Arkansas | 14.07% | South; EIA 2025: (5,731 nonhydro + 3,920 hydro) / 68,607 GWh; EIA 2024: (3,121 + 3,134) / 61,542 GWh; 2024 share 10.16%; change +3.90 pp; calculated_value. |
| 29 | Tennessee | 14.04% | South; EIA 2025: (1,751 nonhydro + 8,840 hydro) / 75,446 GWh; EIA 2024: (1,589 + 8,911) / 76,167 GWh; 2024 share 13.79%; change +0.25 pp; calculated_value. |
| 30 | North Carolina | 13.79% | South; EIA 2025: (14,424 nonhydro + 4,153 hydro) / 134,696 GWh; EIA 2024: (13,828 + 4,829) / 134,965 GWh; 2024 share 13.82%; change -0.03 pp; calculated_value. |
| 31 | Wisconsin | 13.54% | Midwest; EIA 2025: (7,074 nonhydro + 1,899 hydro) / 66,253 GWh; EIA 2024: (5,959 + 2,072) / 65,276 GWh; 2024 share 12.30%; change +1.24 pp; calculated_value. |
| 32 | Missouri | 13.04% | Midwest; EIA 2025: (8,159 nonhydro + 1,170 hydro) / 71,527 GWh; EIA 2024: (7,103 + 1,020) / 66,876 GWh; 2024 share 12.15%; change +0.90 pp; calculated_value. |
| 33 | Georgia | 12.87% | South; EIA 2025: (16,011 nonhydro + 2,740 hydro) / 145,688 GWh; EIA 2024: (14,551 + 2,941) / 139,805 GWh; 2024 share 12.51%; change +0.36 pp; calculated_value. |
| 34 | New Hampshire | 12.63% | Northeast; EIA 2025: (1,315 nonhydro + 1,098 hydro) / 19,112 GWh; EIA 2024: (1,113 + 1,411) / 16,942 GWh; 2024 share 14.90%; change -2.27 pp; calculated_value. |
| 35 | Michigan | 12.58% | Midwest; EIA 2025: (14,879 nonhydro + 1,286 hydro) / 128,532 GWh; EIA 2024: (13,635 + 1,255) / 124,200 GWh; 2024 share 11.99%; change +0.59 pp; calculated_value. |
| 36 | Virginia | 12.54% | South; EIA 2025: (12,308 nonhydro + 1,036 hydro) / 106,389 GWh; EIA 2024: (10,436 + 1,253) / 102,699 GWh; 2024 share 11.38%; change +1.16 pp; calculated_value. |
| 37 | Florida | 10.59% | South; EIA 2025: (28,178 nonhydro + 228 hydro) / 268,263 GWh; EIA 2024: (21,615 + 177) / 266,119 GWh; 2024 share 8.19%; change +2.40 pp; calculated_value. |
| 38 | Maryland | 10.21% | South; EIA 2025: (2,275 nonhydro + 1,563 hydro) / 37,606 GWh; EIA 2024: (1,927 + 1,848) / 35,425 GWh; 2024 share 10.66%; change -0.45 pp; calculated_value. |
| 39 | Alabama | 9.13% | South; EIA 2025: (4,466 nonhydro + 8,583 hydro) / 142,995 GWh; EIA 2024: (4,522 + 8,357) / 142,921 GWh; 2024 share 9.01%; change +0.11 pp; calculated_value. |
| 40 | Kentucky | 8.74% | South; EIA 2025: (2,060 nonhydro + 4,441 hydro) / 74,373 GWh; EIA 2024: (671 + 4,114) / 66,951 GWh; 2024 share 7.15%; change +1.59 pp; calculated_value. |
| 41 | Ohio | 8.08% | Midwest; EIA 2025: (11,257 nonhydro + 483 hydro) / 145,331 GWh; EIA 2024: (7,115 + 468) / 142,747 GWh; 2024 share 5.31%; change +2.77 pp; calculated_value. |
| 42 | West Virginia | 6.84% | South; EIA 2025: (2,231 nonhydro + 1,423 hydro) / 53,389 GWh; EIA 2024: (2,196 + 1,361) / 50,595 GWh; 2024 share 7.03%; change -0.19 pp; calculated_value. |
| 43 | South Carolina | 6.35% | South; EIA 2025: (4,816 nonhydro + 1,783 hydro) / 103,943 GWh; EIA 2024: (4,753 + 2,412) / 100,485 GWh; 2024 share 7.13%; change -0.78 pp; calculated_value. |
| 44 | Mississippi | 6.05% | South; EIA 2025: (4,744 nonhydro + 0 hydro) / 78,429 GWh; EIA 2024: (3,319 + 0) / 77,337 GWh; 2024 share 4.29%; change +1.76 pp; calculated_value. |
| 45 | Louisiana | 5.13% | South; EIA 2025: (4,260 nonhydro + 989 hydro) / 102,392 GWh; EIA 2024: (3,176 + 885) / 99,623 GWh; 2024 share 4.08%; change +1.05 pp; calculated_value. |
| 46 | Delaware | 4.23% | South; EIA 2025: (231 nonhydro + 0 hydro) / 5,462 GWh; EIA 2024: (210 + 0) / 4,799 GWh; 2024 share 4.38%; change -0.15 pp; calculated_value. |
| 47 | Pennsylvania | 3.87% | Northeast; EIA 2025: (6,969 nonhydro + 2,533 hydro) / 245,721 GWh; EIA 2024: (5,841 + 2,721) / 241,499 GWh; 2024 share 3.55%; change +0.32 pp; calculated_value. |
| 48 | New Jersey | 3.66% | Northeast; EIA 2025: (2,223 nonhydro + 6 hydro) / 60,963 GWh; EIA 2024: (2,272 + 4) / 60,175 GWh; 2024 share 3.78%; change -0.13 pp; calculated_value. |
| 49 | Connecticut | 3.62% | Northeast; EIA 2025: (1,289 nonhydro + 295 hydro) / 43,773 GWh; EIA 2024: (1,038 + 369) / 44,761 GWh; 2024 share 3.14%; change +0.48 pp; calculated_value. |
Showing 49 verified states.
Each row's value_status is calculated_value. The numeric components are EIA official_value observations for 2025 and 2024, shown in GWh. No 2025 cell has been estimated. D.C. is not included, and Rhode Island has no rank because its 2025 hydro input is marked NM.
2025 findings: renewable share gaps, regional patterns and annual changes
Key Insight
Vermont ranks first by renewable share at 99.85%, but Texas ranks first by renewable output at 198,117 GWh. Texas generated 97.6 times Vermont's renewable electricity while having a 66.89 pp lower renewable share (32.97%).
Notable Pattern
Exactly 10 of 49 ranked states exceeded 50% renewables. The median is 17.56%, versus an unweighted mean of 28.50%—a gap of 10.94 pp showing how higher-share states pull up the mean.
Regional Concentration
6 of the Top 10 states are in the West, alongside 2 in the Midwest and 2 in the Northeast. The South has 16 of 49 ranked states but none in the Top 10.
Outlier
Wyoming recorded the largest year-on-year increase among included states: +5.18 pp, reaching 30.83% in 2025. Kansas recorded the largest decline: −4.01 pp, reaching 47.97%. These are changes in generation share, not proof of underlying causes.
What the renewable generation ranking does—and does not—mean
A higher position means renewable plants accounted for a larger percentage of electricity generated inside that state during 2025. It does not show the percentage of electricity actually consumed by residents or businesses that originated from renewables; state electricity imports and exports are not allocated to consumers in this table.
Renewable generation comes from different technologies across states. In Washington, conventional hydropower produced 64,662 of 74,440 GWh of renewable electricity in 2025 (86.86% of its renewable total). In Iowa, wind produced 43,573 of 46,211 GWh (94.29% of its renewable total). California generated 53,027 GWh from utility-scale solar PV alone. These technology shares use each state's renewable output as the denominator; they are not percentages of all-source generation.
Annual renewable share also changes when total generation changes. The 2024-to-2025 difference cannot, on its own, establish whether a renewable-energy policy succeeded, whether new plants were installed or why hydropower and other sources changed. The ranking uses final, observed production, not modeled carbon savings or future energy scenarios.
For related context, see why installed renewable capacity differs from actual electricity output and the renewable electricity share ranking by country. The latter is a 2025 snapshot based on 2024 country data and uses a different reporting scope, so its percentages should not be treated as directly equivalent to these 2025 EIA state shares.
Frequently asked questions
Which U.S. state generated the highest percentage of electricity from renewables in 2025?
Vermont ranked first at 99.85% of its utility-scale net generation. Its calculated numerator was 2,030 GWh from 2,033 GWh total EIA-reported utility-scale generation.
Which state generated the greatest quantity of renewable electricity in 2025?
Texas produced 198,117 GWh, or 198.117 TWh, from the renewable sources counted here. It ranks 18th by percentage because its utility-scale electricity system generated 600,982 GWh from all sources in 2025.
Are these percentages published directly by EIA?
No. EIA publishes the observed generation inputs. The 2025 state share is calculated as 100 × (conventional hydro + other renewable sources) ÷ total utility-scale net generation. Every ranked result has status calculated_value, not official_value or a forecast.
Why is Rhode Island missing from the 2025 ranking?
Its 2025 conventional hydro All Sectors value is reported as NM in EIA Electric Power Annual Table 3.14. Rather than treat a missing or nonmeaningful published cell as zero or guess it from aggregate rows, this ranking contains 49 verified states and does not assign Rhode Island a rank.
Does the 2025 renewable share include rooftop solar?
No. Both numerator and denominator use utility-scale generation. EIA Table 3.21 reports both combined solar and a utility-scale-only solar PV column; the technology comparison uses the utility-scale column alone. Adding small-scale PV to the numerator without adjusting the denominator would inflate this particular percentage.
How are the year-on-year changes calculated?
The same EIA fuel and total-generation tables are used for 2024 and 2025. StatRanker subtracts the 2024 renewable share from the 2025 share. The unit is percentage points (pp), not percent growth in the number of gigawatt-hours.
Is nuclear or pumped-storage electricity counted as renewable?
Nuclear electricity remains part of the all-source denominator but not the renewable numerator. Conventional hydro is renewable; pumped-storage hydro is not added to the renewable numerator. Utility-scale solar thermal, wind, geothermal and biomass appear in the EIA nonhydro renewable category.
Is this a 2026 forecast or a 2025 final-data ranking?
It is a historical ranking for calendar year 2025. EIA released final state historical data on October 7, 2026 and its 2025 Electric Power Annual on October 21, 2026. The calculations were checked on October 29, 2026. There are no projections.
Sources and source roles
The numeric dataset comes from one publishing organization, the U.S. Energy Information Administration, using its final annual EIA-923 observations. Different EIA tables are linked separately for reproducibility but are not counted as separate independent numeric providers. An Iowa state publication is used for validation, not to fill the missing Rhode Island value.
EIA Table 3.7 — All utility-scale net generation
Role: numeric_source. Denominator for all 49 rows, all sectors, 2025 and 2024, in thousand MWh.
https://www.eia.gov/electricity/annual/table.php?t=epa_03_07.htmlEIA Table 3.14 — Conventional hydropower
Role: numeric_source and validation_source for missingness. Hydro component in both years; Rhode Island 2025 recorded as NM.
https://www.eia.gov/electricity/annual/table.php?t=epa_03_14.htmlEIA Table 3.15 — Renewables excluding hydro
Role: numeric_source. Nonhydro renewable numerator component for all listed states, 2025 and 2024.
https://www.eia.gov/electricity/annual/table.php?t=epa_03_15.htmlEIA Table 3.18 — Wind generation
Role: numeric_source. 2025 wind generation in the separate technology mix comparison.
https://www.eia.gov/electricity/annual/table.php?t=epa_03_18.htmlEIA Table 3.21 — Solar photovoltaic generation
Role: numeric_source and methodology_source. Only the “Generation at Utility Scale Facilities” 2025 field is used, never combined small-scale solar.
https://www.eia.gov/electricity/annual/table.php?t=epa_03_21.htmlEIA Historical State Data
Role: methodology_source and release validation. Final annual 2025 state data, dated October 7, 2026.
https://www.eia.gov/electricity/data/state/index.phpEIA Electric Power Annual 2025
Role: methodology_source and release validation. Final 2025 annual tables published October 21, 2026.
https://www.eia.gov/electricity/annual/Iowa Utilities Commission — Iowa Electric Profile
Role: validation_source. Separately published state check of EIA-923 final 2025 wind, solar and hydro figures; not an independent underlying survey.
https://iuc.iowa.gov/regulated-industries/electric/iowas-electric-profileRelated rankings
Closely related StatRanker ranking and data pages selected by topic, entity scope and category. Fewer links are shown when strong matches are limited.
