

Mortgage Delinquency Rates by U.S. State: December 2025 Ranking
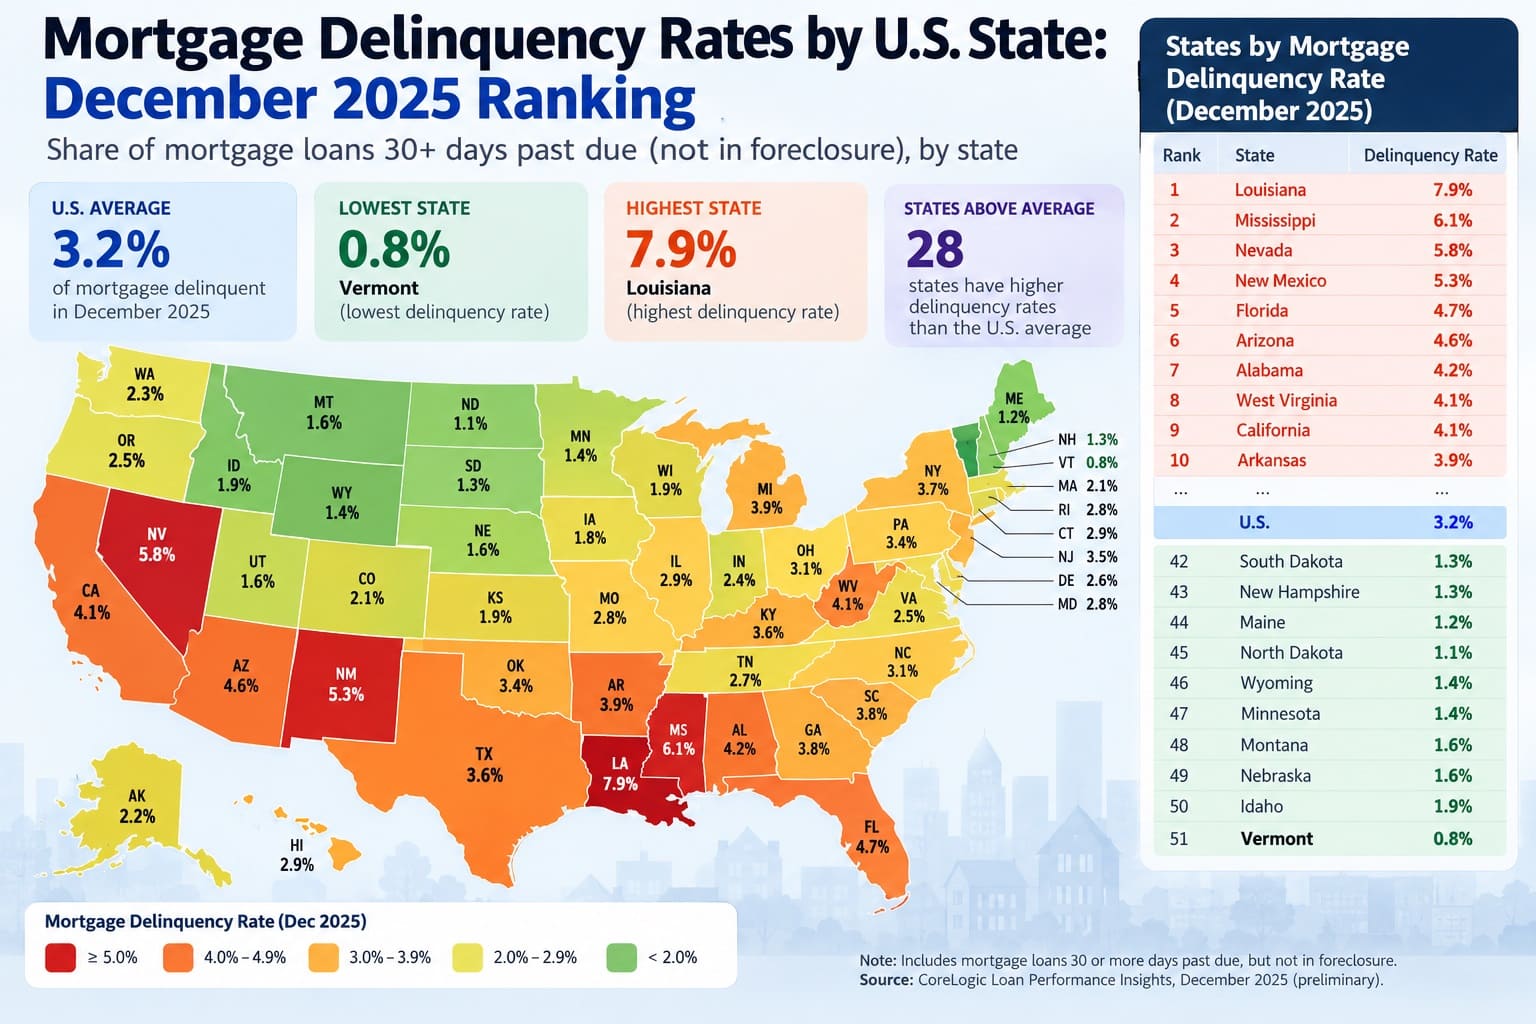
Which States Had the Highest Mortgage Delinquency Rates in December 2025?
Louisiana and Mississippi tied for the highest calculated 30+ mortgage delinquency rate in December 2025, at approximately 6.3% each. Hawaii and Washington had the lowest rates, at 1.7%. The U.S. benchmark was approximately 3.0%.
This ranking compares all 50 U.S. states and Washington, D.C. by the percentage of outstanding residential mortgages at least 30 days past due, excluding loans in foreclosure. Higher rates rank higher. Each figure adds the CFPB's published 30–89-day and 90+-day delinquency rates for the same state and month.
The CFPB/FHFA National Mortgage Database is the single federal numeric source. CFPB publishes two observed components per jurisdiction (102 inputs in total); StatRanker calculated the 51 combined percentages shown here. These are calculated from observed inputs, not an official forecast or projection. CFPB release: August 2026. Source files reviewed: October 25, 2026. Results are approximate because each published component is rounded to one decimal place.
Louisiana and Mississippi share first place.
Hawaii and Washington tie at the low end.
50 states plus D.C.; one month, December 2025.
2.1% early + 0.9% serious; derived from national CFPB rates.
Overview: the Gap Between High- and Low-Delinquency States
West Virginia ranks third at 4.7%, fully 1.6 percentage points below the tied leaders. Across the 51 jurisdictions, the distance between the highest and lowest combined rates is 4.6 percentage points. A higher state rate does not necessarily mean more delinquent loans: the mortgage populations behind these percentages differ in size.
Nationally, CFPB reported 2.1% of mortgages 30–89 days late and 0.9% at least 90 days late but not in foreclosure. Together, these produce the 3.0% national reference rate. The comparable December 2024 components were 1.9% and 0.7%, giving a 2.6% combined reference rate. The year-over-year change is +0.4 percentage points; these readings are observed, not forecasts.
This is a broad first-lien residential mortgage comparison, not an FHA-only study. Ginnie Mae's FHA serious-delinquency measure also includes foreclosure and covers a different loan population. The separate StatRanker FHA portfolio analysis is linked under Sources for readers who need that narrower comparison.
Top 10 Mortgage Delinquency Ranks by State
Louisiana and Mississippi share first place, followed by West Virginia, Alabama and South Carolina. Because Delaware, Florida and Indiana all have 3.6% at rank 10, this table shows 12 entries rather than dropping states that are tied. Ranks reflect the published one-decimal precision of the two CFPB components.
| Rank | State | 30+ late | Region / source and method |
|---|---|---|---|
| 1 | Louisiana | 6.3% | South; CFPB NMDB (Dec 2025); calculated as 4.2% (30–89 days) + 2.1% (90+ days). |
| 1 | Mississippi | 6.3% | South; CFPB NMDB (Dec 2025); calculated as 4.5% (30–89 days) + 1.8% (90+ days). |
| 3 | West Virginia | 4.7% | South; CFPB NMDB (Dec 2025); calculated as 3.6% (30–89 days) + 1.1% (90+ days). |
| 4 | Alabama | 4.3% | South; CFPB NMDB (Dec 2025); calculated as 3.2% (30–89 days) + 1.1% (90+ days). |
| 5 | South Carolina | 4.2% | South; CFPB NMDB (Dec 2025); calculated as 3.0% (30–89 days) + 1.2% (90+ days). |
| 6 | Georgia | 4.1% | South; CFPB NMDB (Dec 2025); calculated as 2.8% (30–89 days) + 1.3% (90+ days). |
| 6 | Texas | 4.1% | South; CFPB NMDB (Dec 2025); calculated as 2.9% (30–89 days) + 1.2% (90+ days). |
| 8 | Arkansas | 4.0% | South; CFPB NMDB (Dec 2025); calculated as 2.7% (30–89 days) + 1.3% (90+ days). |
| 9 | Oklahoma | 3.8% | South; CFPB NMDB (Dec 2025); calculated as 2.6% (30–89 days) + 1.2% (90+ days). |
| 10 | Delaware | 3.6% | South; CFPB NMDB (Dec 2025); calculated as 2.5% (30–89 days) + 1.1% (90+ days). |
| 10 | Florida | 3.6% | South; CFPB NMDB (Dec 2025); calculated as 2.4% (30–89 days) + 1.2% (90+ days). |
| 10 | Indiana | 3.6% | Midwest; CFPB NMDB (Dec 2025); calculated as 2.6% (30–89 days) + 1.0% (90+ days). |
Source-published rates are rounded to 0.1 percentage point. Ties are preserved; alphabetical order is used only within each tied group.
Chart: the 20 Highest Mortgage Delinquency Rates
The chart displays the 20 highest state-level 30+ rates from the ranking. Louisiana and Mississippi share the longest bars at 6.3%; North Carolina, the twentieth entry, is at 3.3%.
North Carolina is 3.0 percentage points below the leaders. Bar length is relative to the highest rate in this chart (6.3%), not the share of all U.S. mortgages.
Methodology and inclusion rules
Population and measurement
The CFPB/FHFA NMDB is a nationally representative 5% sample of outstanding closed-end, first-lien mortgages on 1–4 family residential properties. Each category is a share of outstanding mortgages in the given jurisdiction, not all residents or households.
Source-published inputs
30–89 days means records 30 to 89 days past due divided by outstanding mortgages. 90+ days means records at least 90 days past due but not in foreclosure divided by the same mortgage universe. Both series are published by the CFPB for December 2025.
StatRanker calculation
Combined 30+ rate (%) = CFPB 30–89-day rate (%) + CFPB 90+-day rate (%). Louisiana, for example, has 4.2% early-stage delinquency and 2.1% serious delinquency, totaling 6.3%. The denominator is outstanding first-lien residential mortgages in that jurisdiction. All ranked values carry the machine-readable status calculated_value. No estimates of future performance or additional population weights are used.
Ranking, ties, rounding
States are ordered from the highest combined rate to the lowest. Equal totals share the same competition rank; names are alphabetized only within a tie. The total is computed from the two published component values before display formatting. Because each input is rounded to a tenth of a percentage point, their sum can differ from an unrounded underlying total by up to about 0.1 percentage point.
Coverage, dates and missing data
The comparison contains all 50 states plus the District of Columbia, each with both December 2025 observations. Territories are excluded, and no earlier month replaces a missing reading. CFPB's current file covering December 2025 was published in August 2026 and reviewed on October 25, 2026. Historical comparisons, where shown, are separately labeled.
Geography and source roles
Census Bureau regions are used only to group and filter jurisdictions. CFPB is the sole original numeric publisher; its methodology defines the rates and exclusions. Third-party reproductions are used to check published figures, while ICE provides a distinct industry context rather than ranking inputs. Disagreements are not averaged: CFPB's latest published state series takes precedence.
Limitations: the serious-delinquency category excludes loans already in foreclosure, so the combined rate is not an all-inclusive non-current or foreclosure rate. Credit-reporting gaps, mortgage-servicer reporting, public emergencies and forbearance can suppress reported delinquency; CFPB may revise historical figures. State rates have different mortgage denominators.
What this does not measure: mortgage debt balances, foreclosure inventory, loan-level default probability, price affordability, mortgage-payment amounts, homeowner prevalence or causes of delinquency. The U.S. 3.0% benchmark comes from its own national observations, not an average of 51 state and D.C. rates. The December 2024 comparisons elsewhere on this page use CFPB's separate observed historic series and are not forecast inputs.
Mortgage Delinquency Rates by State: Full December 2025 Ranking
Use the search box and region filter to compare all 51 jurisdictions, or sort the rates from low to high. The Top 10 selection retains ties at rank 10, so it shows 12 states. The original ranking position remains unchanged when the table is filtered.
| Rank | State | 30+ late | Region / source and method |
|---|---|---|---|
| 1 | Louisiana | 6.3% | South; CFPB NMDB (Dec 2025); calculated as 4.2% (30–89 days) + 2.1% (90+ days). |
| 1 | Mississippi | 6.3% | South; CFPB NMDB (Dec 2025); calculated as 4.5% (30–89 days) + 1.8% (90+ days). |
| 3 | West Virginia | 4.7% | South; CFPB NMDB (Dec 2025); calculated as 3.6% (30–89 days) + 1.1% (90+ days). |
| 4 | Alabama | 4.3% | South; CFPB NMDB (Dec 2025); calculated as 3.2% (30–89 days) + 1.1% (90+ days). |
| 5 | South Carolina | 4.2% | South; CFPB NMDB (Dec 2025); calculated as 3.0% (30–89 days) + 1.2% (90+ days). |
| 6 | Georgia | 4.1% | South; CFPB NMDB (Dec 2025); calculated as 2.8% (30–89 days) + 1.3% (90+ days). |
| 6 | Texas | 4.1% | South; CFPB NMDB (Dec 2025); calculated as 2.9% (30–89 days) + 1.2% (90+ days). |
| 8 | Arkansas | 4.0% | South; CFPB NMDB (Dec 2025); calculated as 2.7% (30–89 days) + 1.3% (90+ days). |
| 9 | Oklahoma | 3.8% | South; CFPB NMDB (Dec 2025); calculated as 2.6% (30–89 days) + 1.2% (90+ days). |
| 10 | Delaware | 3.6% | South; CFPB NMDB (Dec 2025); calculated as 2.5% (30–89 days) + 1.1% (90+ days). |
| 10 | Florida | 3.6% | South; CFPB NMDB (Dec 2025); calculated as 2.4% (30–89 days) + 1.2% (90+ days). |
| 10 | Indiana | 3.6% | Midwest; CFPB NMDB (Dec 2025); calculated as 2.6% (30–89 days) + 1.0% (90+ days). |
| 13 | New Mexico | 3.5% | West; CFPB NMDB (Dec 2025); calculated as 2.4% (30–89 days) + 1.1% (90+ days). |
| 13 | Pennsylvania | 3.5% | Northeast; CFPB NMDB (Dec 2025); calculated as 2.5% (30–89 days) + 1.0% (90+ days). |
| 15 | Maryland | 3.4% | South; CFPB NMDB (Dec 2025); calculated as 2.3% (30–89 days) + 1.1% (90+ days). |
| 15 | Ohio | 3.4% | Midwest; CFPB NMDB (Dec 2025); calculated as 2.4% (30–89 days) + 1.0% (90+ days). |
| 17 | Connecticut | 3.3% | Northeast; CFPB NMDB (Dec 2025); calculated as 2.3% (30–89 days) + 1.0% (90+ days). |
| 17 | Illinois | 3.3% | Midwest; CFPB NMDB (Dec 2025); calculated as 2.2% (30–89 days) + 1.1% (90+ days). |
| 17 | Michigan | 3.3% | Midwest; CFPB NMDB (Dec 2025); calculated as 2.4% (30–89 days) + 0.9% (90+ days). |
| 17 | North Carolina | 3.3% | South; CFPB NMDB (Dec 2025); calculated as 2.4% (30–89 days) + 0.9% (90+ days). |
| 21 | Kentucky | 3.2% | South; CFPB NMDB (Dec 2025); calculated as 2.2% (30–89 days) + 1.0% (90+ days). |
| 21 | Missouri | 3.2% | Midwest; CFPB NMDB (Dec 2025); calculated as 2.3% (30–89 days) + 0.9% (90+ days). |
| 21 | Rhode Island | 3.2% | Northeast; CFPB NMDB (Dec 2025); calculated as 2.3% (30–89 days) + 0.9% (90+ days). |
| 21 | Tennessee | 3.2% | South; CFPB NMDB (Dec 2025); calculated as 2.3% (30–89 days) + 0.9% (90+ days). |
| 25 | New York | 3.0% | Northeast; CFPB NMDB (Dec 2025); calculated as 2.0% (30–89 days) + 1.0% (90+ days). |
| 25 | Wyoming | 3.0% | West; CFPB NMDB (Dec 2025); calculated as 2.2% (30–89 days) + 0.8% (90+ days). |
| 27 | Maine | 2.9% | Northeast; CFPB NMDB (Dec 2025); calculated as 2.0% (30–89 days) + 0.9% (90+ days). |
| 27 | New Jersey | 2.9% | Northeast; CFPB NMDB (Dec 2025); calculated as 2.0% (30–89 days) + 0.9% (90+ days). |
| 29 | Arizona | 2.8% | West; CFPB NMDB (Dec 2025); calculated as 2.0% (30–89 days) + 0.8% (90+ days). |
| 29 | Iowa | 2.8% | Midwest; CFPB NMDB (Dec 2025); calculated as 1.9% (30–89 days) + 0.9% (90+ days). |
| 29 | Kansas | 2.8% | Midwest; CFPB NMDB (Dec 2025); calculated as 2.0% (30–89 days) + 0.8% (90+ days). |
| 32 | South Dakota | 2.6% | Midwest; CFPB NMDB (Dec 2025); calculated as 2.0% (30–89 days) + 0.6% (90+ days). |
| 32 | Virginia | 2.6% | South; CFPB NMDB (Dec 2025); calculated as 1.8% (30–89 days) + 0.8% (90+ days). |
| 34 | Alaska | 2.5% | West; CFPB NMDB (Dec 2025); calculated as 1.7% (30–89 days) + 0.8% (90+ days). |
| 35 | Nevada | 2.4% | West; CFPB NMDB (Dec 2025); calculated as 1.6% (30–89 days) + 0.8% (90+ days). |
| 36 | District of Columbia | 2.3% | South; CFPB NMDB (Dec 2025); calculated as 1.4% (30–89 days) + 0.9% (90+ days). |
| 36 | Utah | 2.3% | West; CFPB NMDB (Dec 2025); calculated as 1.6% (30–89 days) + 0.7% (90+ days). |
| 38 | Montana | 2.2% | West; CFPB NMDB (Dec 2025); calculated as 1.6% (30–89 days) + 0.6% (90+ days). |
| 38 | New Hampshire | 2.2% | Northeast; CFPB NMDB (Dec 2025); calculated as 1.6% (30–89 days) + 0.6% (90+ days). |
| 40 | Colorado | 2.1% | West; CFPB NMDB (Dec 2025); calculated as 1.4% (30–89 days) + 0.7% (90+ days). |
| 40 | Idaho | 2.1% | West; CFPB NMDB (Dec 2025); calculated as 1.5% (30–89 days) + 0.6% (90+ days). |
| 40 | Massachusetts | 2.1% | Northeast; CFPB NMDB (Dec 2025); calculated as 1.5% (30–89 days) + 0.6% (90+ days). |
| 40 | Minnesota | 2.1% | Midwest; CFPB NMDB (Dec 2025); calculated as 1.5% (30–89 days) + 0.6% (90+ days). |
| 40 | Vermont | 2.1% | Northeast; CFPB NMDB (Dec 2025); calculated as 1.4% (30–89 days) + 0.7% (90+ days). |
| 45 | Nebraska | 2.0% | Midwest; CFPB NMDB (Dec 2025); calculated as 1.4% (30–89 days) + 0.6% (90+ days). |
| 46 | California | 1.9% | West; CFPB NMDB (Dec 2025); calculated as 1.4% (30–89 days) + 0.5% (90+ days). |
| 46 | North Dakota | 1.9% | Midwest; CFPB NMDB (Dec 2025); calculated as 1.3% (30–89 days) + 0.6% (90+ days). |
| 48 | Oregon | 1.8% | West; CFPB NMDB (Dec 2025); calculated as 1.2% (30–89 days) + 0.6% (90+ days). |
| 48 | Wisconsin | 1.8% | Midwest; CFPB NMDB (Dec 2025); calculated as 1.3% (30–89 days) + 0.5% (90+ days). |
| 50 | Hawaii | 1.7% | West; CFPB NMDB (Dec 2025); calculated as 1.0% (30–89 days) + 0.7% (90+ days). |
| 50 | Washington | 1.7% | West; CFPB NMDB (Dec 2025); calculated as 1.1% (30–89 days) + 0.6% (90+ days). |
Each row shows the two December 2025 CFPB percentages used to calculate the combined rate. Values describe shares of mortgages, not counts of mortgages or homeowners. All 51 rows are calculated from published observations; none is a forecast.
Four Findings from the December 2025 Mortgage Data
Key Insight
The two leaders have equal total rates but different delinquency profiles. Louisiana's 6.3% comprises 4.2% 30–89 days late and 2.1% 90+ days late. Mississippi's 6.3% comprises 4.5% and 1.8%, respectively. The serious-delinquency component is 0.3 percentage points higher in Louisiana.
Notable Pattern
The median state-level rate is 3.0%, calculated from all 51 jurisdictions without weighting them by mortgage count. Compared with the separately calculated 3.0% U.S. rate, 24 jurisdictions are higher, 2 are equal and 25 are lower. The matching median and national rate do not make them the same measure.
Regional / Source Concentration
11 of the 12 states in the first ten rank positions are in the Census South (91.7%). Indiana is the only exception. Across the whole ranking, the South contains 17 of 51 jurisdictions (33.3%). These percentages describe the distribution of ranked jurisdictions, not the distribution of mortgage loans.
Outlier
Florida's 90+ day delinquency rate rose from 0.6% in December 2024 to 1.2% in December 2025, an increase of 0.6 percentage points—the largest increase in this component among the 51 jurisdictions. Florida's combined December 2025 rate is 3.6%, tied at rank 10.
How to Interpret the State Mortgage Delinquency Ranking
A 6.3% rate means that about 6.3 of every 100 outstanding mortgages in the jurisdiction's sampled mortgage population fall into the two past-due groups in December 2025. It does not mean 6.3% of households are behind on a mortgage, and it does not count mortgages already in foreclosure.
The figures are useful for comparing states in the same month, but they are not directly interchangeable with MBA, ICE or Ginnie Mae statistics. Different data providers may include other loan types, use different reporting sources or handle foreclosure differently. The status shown in each row indicates a total calculated from CFPB observations—not a ready-made CFPB 30+ series.
These comparisons cannot establish why a state has a higher rate or predict what will happen to borrowers next. In particular, the regional pattern should not be interpreted as proof that housing costs, insurance prices, incomes or interest rates caused the differences. For a fuller interpretation, examine the early-stage and serious-delinquency components shown alongside every state.
FAQ
Which U.S. state had the highest mortgage delinquency rate in December 2025?
Louisiana and Mississippi tied at an approximate combined 30+ delinquency rate of 6.3%. Both figures are sums of separate official CFPB early- and serious-delinquency rates.
What does the 30+ mortgage delinquency rate include?
Mortgages 30–89 days past due plus those 90 or more days past due but not in foreclosure. Both categories use the same denominator: outstanding first-lien residential mortgages in the relevant NMDB sample.
Does CFPB publish the combined 30+ rate used here?
No. CFPB publishes the 30–89-day and 90+-day rates separately. StatRanker adds them for each of the 51 jurisdictions. The sums are approximate because the published inputs have one decimal place; they are calculations from observed data, not projections.
Does the ranking include mortgages in foreclosure?
No. CFPB defines its 90+ measure as mortgages at least 90 days past due but not in foreclosure. A foreclosure-inclusive non-current mortgage rate uses a different numerator and should not be equated with this table.
Why are 12 states displayed among the Top 10 ranks?
Louisiana and Mississippi share rank 1, Georgia and Texas share rank 6, and Delaware, Florida and Indiana share rank 10 at 3.6%. Showing all ties at rank 10 results in 12 entries.
Why does the ranking include 51 entries rather than 50?
The comparison covers all 50 states plus the District of Columbia, which is treated as a state equivalent for this comparison. Puerto Rico and other territories are not included.
Is the 3.0% U.S. figure an average of the state rates?
No. It is a calculation from the national CFPB observations: 2.1% 30–89 days late plus 0.9% 90+ days late. An unweighted average of states is not a national mortgage-weighted rate.
Are 2024 values mixed into the December 2025 ranking?
No. All 51 ranking values use December 2025 observations. The separate December 2024 serious-delinquency observations are used only for the explicitly labeled year-over-year comparison in the insights.
Can this December 2025 ranking predict mortgage distress in 2026?
No. The figures describe credit-file observations for December 2025, published in August 2026. They do not predict later mortgage performance, and CFPB may revise historical observations in future releases.
Sources and verification
Only one publishing organization supplies numeric inputs: CFPB, using the joint CFPB/FHFA NMDB. Independent websites reproducing the same federal observations are validation checks, not independent numeric source datasets.
CFPB — Download the Data
Official download page for the current, revised state time series. Lists both 30–89-day and 90+-day CSV files covering January 2008 through December 2025, published in August 2026.
https://www.consumerfinance.gov/data-research/mortgage-performance-trends/download-the-data/
CFPB — December 2025 state series
State-level observed monthly percentages, two separate CSV files. Inputs for all 51 calculated rows.
CFPB — About the Data
NMDB sample, delinquency definitions, foreclosure exclusion, revisions, data quality and emergency-related reporting limitations.
https://www.consumerfinance.gov/data-research/mortgage-performance-trends/about-the-data/
U.S. Census Bureau — Census Regions
Defines the Northeast, Midwest, South and West groupings for filters and regional analysis; not a mortgage-rate source.
https://www.census.gov/programs-surveys/economic-census/guidance-geographies/levels.html
My Credit Guide — State mortgage delinquency table
Cross-check for December 2025 early/serious values and December 2024 serious values; not an independently sampled dataset.
https://mycreditguide.org/data/mortgage-delinquency-by-state/
MacroDataHub — Mortgage delinquency by state
Additional cross-check for the December 2025 30–89-day ordering and state-level values; uses CFPB data.
https://macrodatahub.com/data/us-mortgage-delinquency-rates-by-state-1195
ICE — December 2025 First Look
Separate industry mortgage-performance context. Its measures are not merged or averaged with CFPB's state percentages.
https://mortgagetech.ice.com/resources/data-reports/first-look-at-december-2025-mortgage-data
FHA Serious Delinquency Rates in Ginnie Mae's Largest State Portfolios
A separate December 2025 comparison of selected FHA portfolios. Ginnie Mae uses a foreclosure-inclusive serious-delinquency definition and a narrower loan population; the two rankings should not be merged.
https://statranker.org/economy/ginnie-mae-fha-serious-delinquency-rates-december-2025/
Related rankings
Closely related StatRanker ranking and data pages selected by topic, entity scope and category. Fewer links are shown when strong matches are limited.
