

Business Bankruptcy Filings by U.S. State: Year Ending September 2026
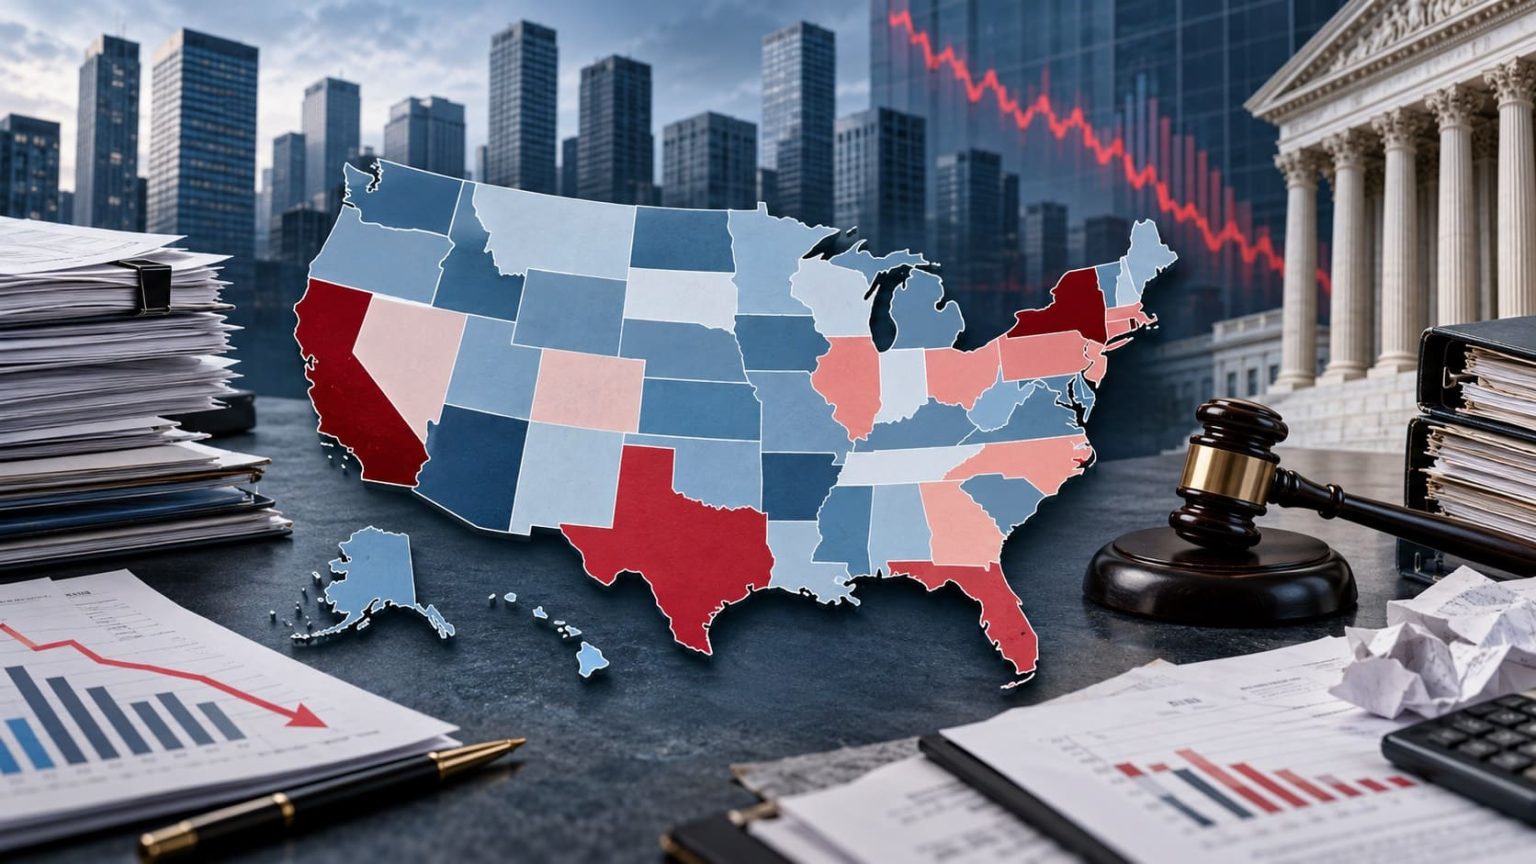
Which U.S. States Had the Most Business Bankruptcy Filings in 2026?
Texas led with 4,325 business bankruptcy cases filed in federal bankruptcy courts during the 12 months ending September 30, 2026. California ranked second (3,433), followed by Florida (2,785). The figures count business-designated cases across all Bankruptcy Code chapters, not business closures or a per-business failure rate.
This 50-state ranking uses the official U.S. Courts Table F-2 for October 1, 2025–September 30, 2026, with higher case counts ranked first. For 27 states, the count appears directly in one official court-district row. The other 23 state totals are calculated by adding the published counts for their districts. These are sums of observed cases, not official statewide forecasts or projections. Unit: cases. Source accessed: October 25, 2026.
Total across four federal bankruptcy court districts in Texas.
Published F-2 total for Vermont's bankruptcy court district.
Filings in the 50 states; excludes the District of Columbia and U.S. territories.
27 directly reported counts and 23 totals calculated from district data. Unit: cases; 12 months to September 2026.
Overview: where business bankruptcy cases were filed
Across all U.S. bankruptcy jurisdictions, courts reported 27,054 business cases for the year ending September 2026, compared with 24,039 a year earlier—a 12.5% increase. The nationwide total includes places outside the 50 states. Removing Washington, D.C. (104 filings), Puerto Rico (153) and the U.S. Virgin Islands (4) leaves 26,793 cases in the 50 states; Guam and the Northern Mariana Islands reported zero business cases.
The state assigned to a filing is the location of the federal bankruptcy court. It may differ from the place where the debtor operates. Federal venue rules allow filing based on factors including principal assets, principal place of business and certain affiliated cases; see the legal source below. Related entities can also file separate cases.
This September report covers October 2025 through September 2026. It is a different rolling 12-month window from the report ending June 2026, not a correction to that earlier release. All 50 states use the same September reporting period; the ranking contains no estimated figures.
Top 10 states for business bankruptcy filings
Texas exceeds California by 892 filings (4,325 versus 3,433). Florida is third with 2,785, followed by New York with 2,128. The Top 10 states account for 17,727 of 26,793 filings in the 50-state dataset, or 66.2%. Between New York (No. 4) and New Jersey (No. 5), the count drops by another 957 cases.
| Rank | State | Filings | Source / method |
|---|---|---|---|
| 1 | Texas | 4,325 | Calculated from U.S. Courts F-2 district counts, 12 months ending Sep 2026: TX,N 1,259 + TX,E 452 + TX,S 1,995 + TX,W 619 = 4,325. |
| 2 | California | 3,433 | Calculated from U.S. Courts F-2 district counts, 12 months ending Sep 2026: CA,N 604 + CA,E 556 + CA,C 1,961 + CA,S 312 = 3,433. |
| 3 | Florida | 2,785 | Calculated from U.S. Courts F-2 district counts, 12 months ending Sep 2026: FL,N 154 + FL,M 1,612 + FL,S 1,019 = 2,785. |
| 4 | New York | 2,128 | Calculated from U.S. Courts F-2 district counts, 12 months ending Sep 2026: NY,N 128 + NY,E 1,166 + NY,S 713 + NY,W 121 = 2,128. |
| 5 | New Jersey | 1,171 | Published U.S. Courts F-2 district count, 12 months ending Sep 2026: NJ: 1,171. |
| 6 | Georgia | 1,140 | Calculated from U.S. Courts F-2 district counts, 12 months ending Sep 2026: GA,N 971 + GA,M 118 + GA,S 51 = 1,140. |
| 7 | Illinois | 941 | Calculated from U.S. Courts F-2 district counts, 12 months ending Sep 2026: IL,N 815 + IL,C 78 + IL,S 48 = 941. |
| 8 | Pennsylvania | 633 | Calculated from U.S. Courts F-2 district counts, 12 months ending Sep 2026: PA,E 283 + PA,M 120 + PA,W 230 = 633. |
| 9 | Colorado | 594 | Published U.S. Courts F-2 district count, 12 months ending Sep 2026: CO: 594. |
| 10 | Delaware | 577 | Published U.S. Courts F-2 district count, 12 months ending Sep 2026: DE: 577. |
For states with multiple court districts, the note shows how the state total was added from the official F-2 district counts. Single-district figures are reported as published.
Chart: the 20 states with the most business bankruptcy filings
Texas sets the chart scale at 4,325 cases (100%). California and Florida account for 79.4% and 64.4% of that count, respectively. The bars compare case totals, not bankruptcy rates adjusted for the number of businesses.
Chart base: Texas, 4,325 cases. The 20th-ranked state is Michigan with 353 filings; all bars use exact observed or calculated counts.
Methodology and verification
Metric and period
Business bankruptcy cases filed, all chapters, U.S. Bankruptcy Courts Table F-2. Unit: number of cases. Period: October 1, 2025–September 30, 2026. Higher count ranks higher.
Source and data classification
The Administrative Office of the U.S. Courts is the sole source of filing counts. For 27 states, a published F-2 district row supplies the state count directly. For 23 states, StatRanker adds the official district counts; each addition is displayed in the ranking. These calculations use observed filings, not projected values.
Geographic scope
50 states only. Washington, D.C., Puerto Rico, Guam, the U.S. Virgin Islands and the Northern Mariana Islands are excluded. Four regions follow U.S. Census Bureau groupings; the Census is a classification source, not a bankruptcy-count source.
Ranking and ties
Rank = 1 + number of states with a strictly larger unrounded integer count. New Mexico and West Virginia each report 79 cases and share rank 41; rank 42 is skipped. Alphabetical order resolves their display order.
Calculation rule: for state s, Filings(s) = sum of business filings for every F-2 bankruptcy reporting district assigned to state s. For example: Texas = 1,259 (Northern) + 452 (Eastern) + 1,995 (Southern) + 619 (Western) = 4,325. Single-line state entries are copied from official F-2 values without adjustment. Arkansas has one joint East/West reporting line (266) and is not double-counted. Every applicable district input is shown in each calculated row.
Reconciliation check: 26,793 (50 states) + 104 (District of Columbia) + 153 (Puerto Rico) + 4 (U.S. Virgin Islands) + 0 (Guam) + 0 (Northern Mariana Islands) = the published 27,054 nationwide business total. The national prior-year total and change are official U.S. Courts figures; a 50-state year-over-year change has not been calculated.
Inclusion and limitations: only 2026 F-2 reporting lines for business filings are counted, across the covered chapters. Circuit subtotals and the nationwide total are excluded from state summations to avoid double-counting. There are no missing state values in this 50-state snapshot. If the source revises its figures, these numbers may change. Official U.S. Courts counts take precedence over third-party estimates; no conflicting estimates were introduced. Values are whole cases, with percentages rounded to one decimal and the mean to two decimals. Court venue can reflect permissible legal filing choices rather than the location of economic harm. This measure does not identify unique businesses, closures, Chapter 11-only cases, small-business Subchapter V cases, credit risk, or bankruptcy incidence per active business.
Full ranking: all 50 states, September 2026 year-end
Find any state or compare regions using the search, status and sorting filters. Choose Top 10, Top 20 or all 50 states. The Top selections always refer to the original filing-count rank, even when the display is sorted differently.
| Rank | State | Filings | Source / method |
|---|---|---|---|
| 1 | Texas | 4,325 | Calculated from U.S. Courts F-2 district counts, 12 months ending Sep 2026: TX,N 1,259 + TX,E 452 + TX,S 1,995 + TX,W 619 = 4,325. |
| 2 | California | 3,433 | Calculated from U.S. Courts F-2 district counts, 12 months ending Sep 2026: CA,N 604 + CA,E 556 + CA,C 1,961 + CA,S 312 = 3,433. |
| 3 | Florida | 2,785 | Calculated from U.S. Courts F-2 district counts, 12 months ending Sep 2026: FL,N 154 + FL,M 1,612 + FL,S 1,019 = 2,785. |
| 4 | New York | 2,128 | Calculated from U.S. Courts F-2 district counts, 12 months ending Sep 2026: NY,N 128 + NY,E 1,166 + NY,S 713 + NY,W 121 = 2,128. |
| 5 | New Jersey | 1,171 | Published U.S. Courts F-2 district count, 12 months ending Sep 2026: NJ: 1,171. |
| 6 | Georgia | 1,140 | Calculated from U.S. Courts F-2 district counts, 12 months ending Sep 2026: GA,N 971 + GA,M 118 + GA,S 51 = 1,140. |
| 7 | Illinois | 941 | Calculated from U.S. Courts F-2 district counts, 12 months ending Sep 2026: IL,N 815 + IL,C 78 + IL,S 48 = 941. |
| 8 | Pennsylvania | 633 | Calculated from U.S. Courts F-2 district counts, 12 months ending Sep 2026: PA,E 283 + PA,M 120 + PA,W 230 = 633. |
| 9 | Colorado | 594 | Published U.S. Courts F-2 district count, 12 months ending Sep 2026: CO: 594. |
| 10 | Delaware | 577 | Published U.S. Courts F-2 district count, 12 months ending Sep 2026: DE: 577. |
| 11 | North Carolina | 550 | Calculated from U.S. Courts F-2 district counts, 12 months ending Sep 2026: NC,E 282 + NC,M 96 + NC,W 172 = 550. |
| 12 | Ohio | 513 | Calculated from U.S. Courts F-2 district counts, 12 months ending Sep 2026: OH,N 226 + OH,S 287 = 513. |
| 13 | Washington | 476 | Calculated from U.S. Courts F-2 district counts, 12 months ending Sep 2026: WA,E 132 + WA,W 344 = 476. |
| 14 | Tennessee | 466 | Calculated from U.S. Courts F-2 district counts, 12 months ending Sep 2026: TN,E 139 + TN,M 247 + TN,W 80 = 466. |
| 15 | Louisiana | 464 | Calculated from U.S. Courts F-2 district counts, 12 months ending Sep 2026: LA,E 312 + LA,M 60 + LA,W 92 = 464. |
| 16 | Arizona | 436 | Published U.S. Courts F-2 district count, 12 months ending Sep 2026: AZ: 436. |
| 17 | Maryland | 417 | Published U.S. Courts F-2 district count, 12 months ending Sep 2026: MD: 417. |
| 18 | Virginia | 400 | Calculated from U.S. Courts F-2 district counts, 12 months ending Sep 2026: VA,E 326 + VA,W 74 = 400. |
| 19 | Massachusetts | 384 | Published U.S. Courts F-2 district count, 12 months ending Sep 2026: MA: 384. |
| 20 | Michigan | 353 | Calculated from U.S. Courts F-2 district counts, 12 months ending Sep 2026: MI,E 255 + MI,W 98 = 353. |
| 21 | Nevada | 343 | Published U.S. Courts F-2 district count, 12 months ending Sep 2026: NV: 343. |
| 22 | Minnesota | 318 | Published U.S. Courts F-2 district count, 12 months ending Sep 2026: MN: 318. |
| 23 | Indiana | 314 | Calculated from U.S. Courts F-2 district counts, 12 months ending Sep 2026: IN,N 96 + IN,S 218 = 314. |
| 24 | Oklahoma | 304 | Calculated from U.S. Courts F-2 district counts, 12 months ending Sep 2026: OK,N 100 + OK,E 31 + OK,W 173 = 304. |
| 25 | Alabama | 278 | Calculated from U.S. Courts F-2 district counts, 12 months ending Sep 2026: AL,N 164 + AL,M 63 + AL,S 51 = 278. |
| 26 | Arkansas | 266 | Published U.S. Courts F-2 district count, 12 months ending Sep 2026: AR,E/W (combined reporting line): 266. |
| 27 | Oregon | 262 | Published U.S. Courts F-2 district count, 12 months ending Sep 2026: OR: 262. |
| 28 | Missouri | 260 | Calculated from U.S. Courts F-2 district counts, 12 months ending Sep 2026: MO,E 137 + MO,W 123 = 260. |
| 29 | Mississippi | 237 | Calculated from U.S. Courts F-2 district counts, 12 months ending Sep 2026: MS,N 73 + MS,S 164 = 237. |
| 30 | Wisconsin | 218 | Calculated from U.S. Courts F-2 district counts, 12 months ending Sep 2026: WI,E 135 + WI,W 83 = 218. |
| 31 | Kansas | 192 | Published U.S. Courts F-2 district count, 12 months ending Sep 2026: KS: 192. |
| 32 | South Carolina | 173 | Published U.S. Courts F-2 district count, 12 months ending Sep 2026: SC: 173. |
| 33 | Kentucky | 163 | Calculated from U.S. Courts F-2 district counts, 12 months ending Sep 2026: KY,E 73 + KY,W 90 = 163. |
| 34 | Utah | 149 | Published U.S. Courts F-2 district count, 12 months ending Sep 2026: UT: 149. |
| 35 | Iowa | 136 | Calculated from U.S. Courts F-2 district counts, 12 months ending Sep 2026: IA,N 52 + IA,S 84 = 136. |
| 36 | Nebraska | 125 | Published U.S. Courts F-2 district count, 12 months ending Sep 2026: NE: 125. |
| 37 | Connecticut | 110 | Published U.S. Courts F-2 district count, 12 months ending Sep 2026: CT: 110. |
| 38 | Idaho | 97 | Published U.S. Courts F-2 district count, 12 months ending Sep 2026: ID: 97. |
| 39 | New Hampshire | 91 | Published U.S. Courts F-2 district count, 12 months ending Sep 2026: NH: 91. |
| 40 | Maine | 84 | Published U.S. Courts F-2 district count, 12 months ending Sep 2026: ME: 84. |
| 41 | New Mexico | 79 | Published U.S. Courts F-2 district count, 12 months ending Sep 2026: NM: 79. |
| 41 | West Virginia | 79 | Calculated from U.S. Courts F-2 district counts, 12 months ending Sep 2026: WV,N 43 + WV,S 36 = 79. |
| 43 | Montana | 61 | Published U.S. Courts F-2 district count, 12 months ending Sep 2026: MT: 61. |
| 44 | Hawaii | 53 | Published U.S. Courts F-2 district count, 12 months ending Sep 2026: HI: 53. |
| 45 | Wyoming | 47 | Published U.S. Courts F-2 district count, 12 months ending Sep 2026: WY: 47. |
| 46 | Rhode Island | 44 | Published U.S. Courts F-2 district count, 12 months ending Sep 2026: RI: 44. |
| 47 | Alaska | 38 | Published U.S. Courts F-2 district count, 12 months ending Sep 2026: AK: 38. |
| 48 | North Dakota | 31 | Published U.S. Courts F-2 district count, 12 months ending Sep 2026: ND: 31. |
| 49 | South Dakota | 28 | Published U.S. Courts F-2 district count, 12 months ending Sep 2026: SD: 28. |
| 50 | Vermont | 27 | Published U.S. Courts F-2 district count, 12 months ending Sep 2026: VT: 27. |
Showing 50 of 50 states.
Notes identify whether the figure was published directly for a district or calculated from several official district counts. All calculations use the same September 2026 reporting period. Equal filing counts share a rank.
Four findings from the 50-state court filing dataset
Key Insight
10,543 cases (39.4%) were filed in Texas (4,325), California (3,433) and Florida (2,785) combined. The denominator is all 26,793 cases in the 50-state dataset, not the nationwide figure that includes D.C. and territories.
Notable Pattern
The median state has 272 filings, compared with the 535.86-case arithmetic mean. The difference of 263.86 cases is calculated from the 50 verified state totals and demonstrates how larger filing states pull the mean above the midpoint.
Regional/Source Concentration
The South has 12,624 of 26,793 filings (47.1%) across 16 states. The West accounts for 6,068 (22.6%), Northeast 4,672 (17.4%), and Midwest 3,429 (12.8%). All regional values are sums of the same F-2-derived state totals.
Outlier
Within Texas, the Southern District alone records 1,995 cases, equal to 46.1% of Texas's 4,325. This highlights concentration by court filing venue within the highest-ranked state; it does not establish where those debtors operated.
What the ranking does—and does not—mean
Texas recorded 4,325 cases and Vermont recorded 27—roughly 160 times as many in Texas. That gap does not show that a business based in Texas is 160 times more likely to fail. These are filing counts, with no adjustment for the number of active firms, and the court location may differ from the debtor's main place of business.
Business-designated filings can include individual debtors with predominantly business obligations, as well as corporations and partnerships. A case filing does not necessarily result in a business closure: some cases concern restructuring, and affiliated legal entities may file separately. Conversely, many business closures occur without any bankruptcy filing.
In the table, a published value comes from one court district, while a calculated state total adds several official district figures. Both rely on U.S. Courts data. For a separate measure of nonbusiness bankruptcies adjusted for population, see StatRanker's 2025 personal bankruptcy filing rates by state; those rates must not be compared directly with the business-case counts here.
FAQ: business bankruptcy filings by state
Which state had the most business bankruptcy filings in the year ending September 2026?
Texas ranked first with 4,325 cases filed in its four bankruptcy court districts. California followed with 3,433, and Florida with 2,785. These are location-of-court figures.
Is this a calendar-year 2026 ranking?
No. The reporting window is October 1, 2025 through September 30, 2026. The publication uses the 12-month F-2 series rather than January–September year-to-date filings or the three-month quarterly series.
Are the state totals officially published by U.S. Courts?
For 27 states, the count is taken directly from one official F-2 district line. For the other 23, the statewide total is calculated from two or more published court-district counts. The full addition is shown in the state's table note; these calculated totals are not separately published as official statewide figures.
Do these figures count only Chapter 11 bankruptcies?
No. They include business cases filed under all chapters appearing in Table F-2. Chapter 7, Chapter 11 and other business-designated cases must not be confused with Chapter 11-only or Subchapter V statistics.
Why does the 50-state sum differ from the national figure of 27,054?
The ranking excludes Washington, D.C. (104), Puerto Rico (153), and the U.S. Virgin Islands (4), together accounting for 261 business cases. Guam and the Northern Mariana Islands reported zero in this category. Thus 27,054 minus 261 equals 26,793.
What is the lowest state and how are ties handled?
Vermont has 27 filings, the lowest of the 50 states. New Mexico and West Virginia each have 79 and share rank 41. Competition-style ranking skips rank 42 after that tie.
Can I use the ranking as a small-business failure rate?
No. It reports case counts without a denominator of active firms, and it does not count unique failed businesses or identify all small-business Chapter 11 Subchapter V cases. Venue rules also limit inferences about the location of underlying business distress.
Sources and provenance
U.S. Courts — Table F-2, September 30, 2026
Role: official numeric sourcePrimary published 12-month bankruptcy filings by court district, business status and Bankruptcy Code chapter. Supplies all 50 states' raw filing observations and the national reconciliation.
https://www.uscourts.gov/data-news/data-tables/2026/09/30/bankruptcy-filings/f-2
U.S. Courts — F-2 original PDF
Role: original numeric table (same publisher)Official downloadable table used for district inputs and business totals. This is a second format of the same U.S. Courts source, not an independent numeric publisher.
https://www.uscourts.gov/sites/default/files/document/bf_f2_0930.2026.pdf
U.S. Courts — October 22, 2026 release
Role: national-total validation (same publisher)Verifies the nationwide 27,054 business cases, 24,039 in the preceding 12 months, and a reported 12.5% year-over-year increase. Not an independent state data source.
https://www.uscourts.gov/data-news/judiciary-news/2026/10/22/bankruptcy-filings-increase-114-percent
U.S. Census Bureau — Census regions
Role: regional classificationDefines the Northeast, Midwest, South and West used to group the 50 state totals. Not used as a source of bankruptcy counts.
https://www.census.gov/programs-surveys/economic-census/guidance-geographies/levels.html
U.S. Code — 28 U.S.C. § 1408, Bankruptcy venue
Role: legal contextExplains how a debtor's residence, main business location, assets or an affiliated case can determine where a bankruptcy case is filed. It provides context only; no case counts come from this source.
