

GDP per Capita by U.S. State: 2025 Ranking
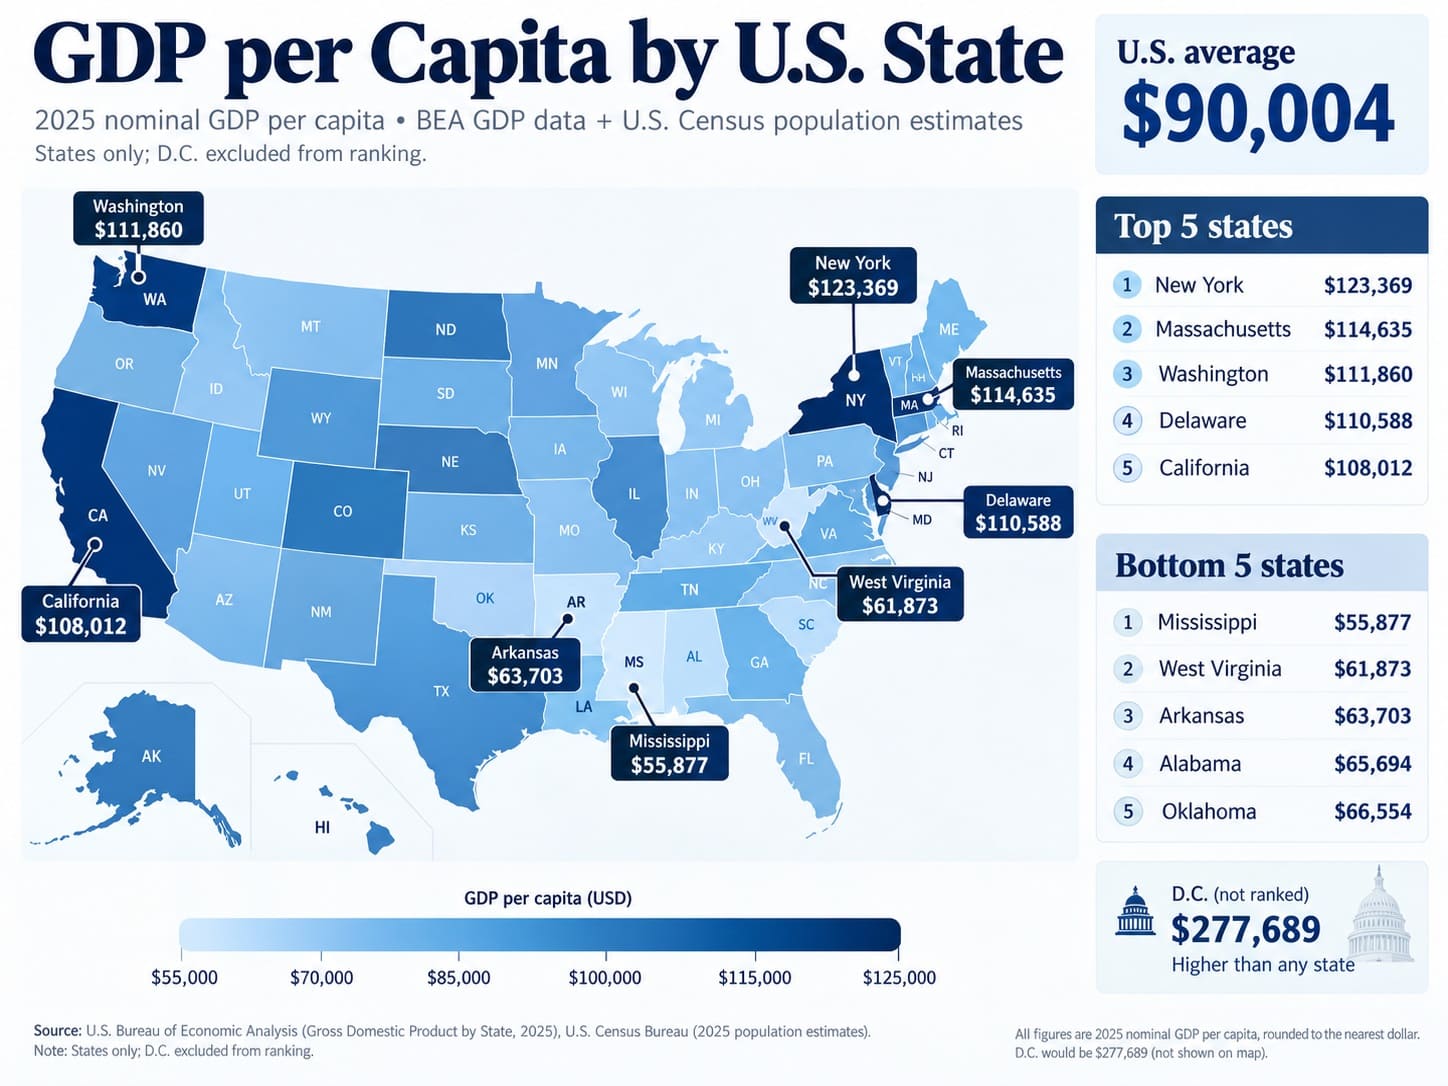
Which U.S. State Had the Highest GDP per Capita in 2025?
New York had the highest nominal GDP per capita among all 50 U.S. states in 2025, at $123,273 per resident. Delaware ($115,043) and Massachusetts ($113,724) followed, while Mississippi ranked last at $55,117. Values are in current U.S. dollars per resident, ranked highest to lowest. StatRanker divided annual state GDP published by the U.S. Bureau of Economic Analysis (BEA) by the U.S. Census Bureau's July 1, 2025 resident population estimates. Sources checked October 24, 2026.
The table is a compiled research dataset based on 2 independent publishing organizations, with row-level source and method notes shown in the ranking table. All 50 results are StatRanker-calculated (status: calculated_value). There are no directly published per-capita values or forecasts among the 50 entries. These figures are calculated from observed inputs, not an official forecast/projection.
BEA state GDP release: September 30, 2026; Census population vintage: January 27, 2026. Washington, D.C. is a federal district, not one of the 50 ranked states.
Overview: output per resident is not personal income
Population changes how states compare. California has the largest 2025 nominal state GDP ($4,297,449.8 million) but ranks fifth in output per resident. Delaware ranks only 41st by total GDP ($121,940.0 million) yet second per resident. GDP is attributed to where production takes place, while the denominator counts residents; neither figure describes an average worker's pay.
The unweighted 50-state median is $81,493, whereas dividing the sum of the 50 states' GDP by their combined population produces $89,429 per resident. That second statistic is a 50-state aggregate calculated here, not BEA's published U.S. national GDP-per-capita figure: it excludes D.C. and U.S. economic activity outside the states.
Both figures are nominal, not inflation-adjusted and not adjusted for local prices. State GDP includes production by businesses, workers and capital located in the state, so this metric is different from median household income, per-capita personal income or labor productivity.
Top 10 states by GDP per capita in 2025
The top 10 includes three Northeastern states, three Midwestern states, three Western states and one Southern state. These are ranks calculated from 2025 GDP and population inputs, not a published BEA per-capita league table.
| Rank | State | Value | Source / method note |
|---|---|---|---|
| 1 | New York | $123,273 | Northeast · BEA SAGDP1 (2025): $2,465,749.3m GDP; Census July 2025: 20,002,427 residents; calculated_value = GDP ($m) × 1,000,000 ÷ residents. |
| 2 | Delaware | $115,043 | South · BEA SAGDP1 (2025): $121,940.0m GDP; Census July 2025: 1,059,952 residents; calculated_value = GDP ($m) × 1,000,000 ÷ residents. |
| 3 | Massachusetts | $113,724 | Northeast · BEA SAGDP1 (2025): $813,590.5m GDP; Census July 2025: 7,154,084 residents; calculated_value = GDP ($m) × 1,000,000 ÷ residents. |
| 4 | Washington | $111,518 | West · BEA SAGDP1 (2025): $892,254.8m GDP; Census July 2025: 8,001,020 residents; calculated_value = GDP ($m) × 1,000,000 ÷ residents. |
| 5 | California | $109,196 | West · BEA SAGDP1 (2025): $4,297,449.8m GDP; Census July 2025: 39,355,309 residents; calculated_value = GDP ($m) × 1,000,000 ÷ residents. |
| 6 | Connecticut | $103,727 | Northeast · BEA SAGDP1 (2025): $382,595.5m GDP; Census July 2025: 3,688,496 residents; calculated_value = GDP ($m) × 1,000,000 ÷ residents. |
| 7 | North Dakota | $103,020 | Midwest · BEA SAGDP1 (2025): $82,349.8m GDP; Census July 2025: 799,358 residents; calculated_value = GDP ($m) × 1,000,000 ÷ residents. |
| 8 | Nebraska | $102,386 | Midwest · BEA SAGDP1 (2025): $206,616.2m GDP; Census July 2025: 2,018,006 residents; calculated_value = GDP ($m) × 1,000,000 ÷ residents. |
| 9 | Alaska | $99,875 | West · BEA SAGDP1 (2025): $73,634.8m GDP; Census July 2025: 737,270 residents; calculated_value = GDP ($m) × 1,000,000 ÷ residents. |
| 10 | Illinois | $97,568 | Midwest · BEA SAGDP1 (2025): $1,240,982.7m GDP; Census July 2025: 12,719,141 residents; calculated_value = GDP ($m) × 1,000,000 ÷ residents. |
Value: 2025 current dollars per resident. Ranks use unrounded ratios; displayed values are rounded to the nearest dollar.
Chart: top 20 GDP per capita states
Bars use the same unrounded ratios as the main table. New York is the 100% reference width; other bars express relative scale, not a share of national GDP.
Methodology: two observed inputs, one calculated ratio
Metric and direction
Annual nominal GDP per resident in current U.S. dollars, highest first. Calculated value = BEA GDP in millions of current dollars × 1,000,000 ÷ Census July 1 resident population for the same state and year.
Release and retrieval dates
Target year: 2025. BEA annual state GDP 2025 estimates were revised September 30, 2026. Census Vintage 2025 state population estimates were published January 27, 2026. Source pages and the matched dataset were checked October 24, 2026.
Scope and exclusions
All 50 states have both 2025 inputs. D.C., Puerto Rico, territories, BEA multi-state regions and U.S. totals are excluded from ranks. D.C. is referenced separately only. States are grouped into the four Census regions: Northeast, Midwest, South and West. These are regions, not the Census Bureau's nine divisions.
Status and source roles
Every row is calculated_value, not official_value: BEA and Census publish the underlying GDP and population figures, while StatRanker calculates the per-capita ratios and ranks. These two federal agencies are the numeric sources. FRED/ALFRED and historical release comparisons are validation references, not additional numeric publishers; BEA methods and Census geography documentation establish definitions and context. If releases disagree, the dated September 30, 2026 BEA revision takes precedence over the April 2026 vintage; conflicting values are never averaged.
Worked example — New York: BEA 2025 nominal GDP $2,465,749.3 million × 1,000,000 ÷ Census population 20,002,427 = $123,272.51 per resident, displayed as $123,273. This is an observed-input calculation, not a BEA-published per-capita observation or a projection.
Revision checks: prefer BEA's September 30, 2026 regional release rather than pre-update 2025 estimates. For example, Delaware's published 2025 GDP changed from $117,218.0 million in the April release to $121,940.0 million in the September release; this is a revision to the same 2025 year, not economic growth from one year to another. Conflicting vintages are not averaged.
Selection and precision: Include only states with a confirmed 2025 GDP numerator and matching 2025 population denominator. Sort unrounded ratios descending; round displayed dollars after sorting. The formula is identical for all 50 states; no imputed rows, synthetic forecasts or stale-year substitutions. The numerator is in millions of dollars; the denominator is a count of residents. GDP source precision is $0.1 million, and no statistical margin of error is supplied for these economic-account estimates.
Interpretation limits: Nominal GDP per resident is not median income, purchasing power, disposable wages, wealth, cost of living, real GDP growth or a causal measure of state policy. Differences can reflect state industrial composition, capital intensity, commuting and changes in population; this ranking alone cannot attribute causes. For longitudinal growth, use real (price-adjusted) GDP and compatible population estimates instead.
Main ranking: all 50 states, 2025
Search a state, filter by Census region or value status, choose a sort order, and show the original Top 10, Top 20 or all 50 states. Filtering and sorting do not recalculate national ranks; all rows are present in the HTML even with JavaScript disabled.
| Rank | State | Value | Source / method note |
|---|---|---|---|
| 1 | New York | $123,273 | Northeast · BEA SAGDP1 (2025): $2,465,749.3m GDP; Census July 2025: 20,002,427 residents; calculated_value = GDP ($m) × 1,000,000 ÷ residents. |
| 2 | Delaware | $115,043 | South · BEA SAGDP1 (2025): $121,940.0m GDP; Census July 2025: 1,059,952 residents; calculated_value = GDP ($m) × 1,000,000 ÷ residents. |
| 3 | Massachusetts | $113,724 | Northeast · BEA SAGDP1 (2025): $813,590.5m GDP; Census July 2025: 7,154,084 residents; calculated_value = GDP ($m) × 1,000,000 ÷ residents. |
| 4 | Washington | $111,518 | West · BEA SAGDP1 (2025): $892,254.8m GDP; Census July 2025: 8,001,020 residents; calculated_value = GDP ($m) × 1,000,000 ÷ residents. |
| 5 | California | $109,196 | West · BEA SAGDP1 (2025): $4,297,449.8m GDP; Census July 2025: 39,355,309 residents; calculated_value = GDP ($m) × 1,000,000 ÷ residents. |
| 6 | Connecticut | $103,727 | Northeast · BEA SAGDP1 (2025): $382,595.5m GDP; Census July 2025: 3,688,496 residents; calculated_value = GDP ($m) × 1,000,000 ÷ residents. |
| 7 | North Dakota | $103,020 | Midwest · BEA SAGDP1 (2025): $82,349.8m GDP; Census July 2025: 799,358 residents; calculated_value = GDP ($m) × 1,000,000 ÷ residents. |
| 8 | Nebraska | $102,386 | Midwest · BEA SAGDP1 (2025): $206,616.2m GDP; Census July 2025: 2,018,006 residents; calculated_value = GDP ($m) × 1,000,000 ÷ residents. |
| 9 | Alaska | $99,875 | West · BEA SAGDP1 (2025): $73,634.8m GDP; Census July 2025: 737,270 residents; calculated_value = GDP ($m) × 1,000,000 ÷ residents. |
| 10 | Illinois | $97,568 | Midwest · BEA SAGDP1 (2025): $1,240,982.7m GDP; Census July 2025: 12,719,141 residents; calculated_value = GDP ($m) × 1,000,000 ÷ residents. |
| 11 | Colorado | $95,610 | West · BEA SAGDP1 (2025): $574,863.9m GDP; Census July 2025: 6,012,561 residents; calculated_value = GDP ($m) × 1,000,000 ÷ residents. |
| 12 | New Jersey | $92,980 | Northeast · BEA SAGDP1 (2025): $887,793.1m GDP; Census July 2025: 9,548,215 residents; calculated_value = GDP ($m) × 1,000,000 ÷ residents. |
| 13 | Texas | $92,474 | South · BEA SAGDP1 (2025): $2,932,343.6m GDP; Census July 2025: 31,709,821 residents; calculated_value = GDP ($m) × 1,000,000 ÷ residents. |
| 14 | Virginia | $90,981 | South · BEA SAGDP1 (2025): $807,925.0m GDP; Census July 2025: 8,880,107 residents; calculated_value = GDP ($m) × 1,000,000 ÷ residents. |
| 15 | New Hampshire | $90,634 | Northeast · BEA SAGDP1 (2025): $128,278.6m GDP; Census July 2025: 1,415,342 residents; calculated_value = GDP ($m) × 1,000,000 ÷ residents. |
| 16 | Maryland | $90,501 | South · BEA SAGDP1 (2025): $567,018.5m GDP; Census July 2025: 6,265,347 residents; calculated_value = GDP ($m) × 1,000,000 ÷ residents. |
| 17 | Utah | $90,191 | West · BEA SAGDP1 (2025): $319,178.6m GDP; Census July 2025: 3,538,904 residents; calculated_value = GDP ($m) × 1,000,000 ÷ residents. |
| 18 | Wyoming | $89,157 | West · BEA SAGDP1 (2025): $52,491.2m GDP; Census July 2025: 588,753 residents; calculated_value = GDP ($m) × 1,000,000 ÷ residents. |
| 19 | Minnesota | $88,350 | Midwest · BEA SAGDP1 (2025): $515,116.4m GDP; Census July 2025: 5,830,405 residents; calculated_value = GDP ($m) × 1,000,000 ÷ residents. |
| 20 | South Dakota | $87,694 | Midwest · BEA SAGDP1 (2025): $82,001.9m GDP; Census July 2025: 935,094 residents; calculated_value = GDP ($m) × 1,000,000 ÷ residents. |
| 21 | Hawaii | $85,959 | West · BEA SAGDP1 (2025): $123,163.8m GDP; Census July 2025: 1,432,820 residents; calculated_value = GDP ($m) × 1,000,000 ÷ residents. |
| 22 | Nevada | $85,728 | West · BEA SAGDP1 (2025): $281,376.7m GDP; Census July 2025: 3,282,188 residents; calculated_value = GDP ($m) × 1,000,000 ÷ residents. |
| 23 | Iowa | $83,973 | Midwest · BEA SAGDP1 (2025): $271,937.2m GDP; Census July 2025: 3,238,387 residents; calculated_value = GDP ($m) × 1,000,000 ÷ residents. |
| 24 | Georgia | $82,819 | South · BEA SAGDP1 (2025): $936,086.7m GDP; Census July 2025: 11,302,748 residents; calculated_value = GDP ($m) × 1,000,000 ÷ residents. |
| 25 | Ohio | $82,087 | Midwest · BEA SAGDP1 (2025): $976,871.7m GDP; Census July 2025: 11,900,510 residents; calculated_value = GDP ($m) × 1,000,000 ÷ residents. |
| 26 | Pennsylvania | $80,898 | Northeast · BEA SAGDP1 (2025): $1,056,488.2m GDP; Census July 2025: 13,059,432 residents; calculated_value = GDP ($m) × 1,000,000 ÷ residents. |
| 27 | Oregon | $80,317 | West · BEA SAGDP1 (2025): $343,240.2m GDP; Census July 2025: 4,273,586 residents; calculated_value = GDP ($m) × 1,000,000 ÷ residents. |
| 28 | Wisconsin | $80,160 | Midwest · BEA SAGDP1 (2025): $478,781.2m GDP; Census July 2025: 5,972,787 residents; calculated_value = GDP ($m) × 1,000,000 ÷ residents. |
| 29 | Tennessee | $80,137 | South · BEA SAGDP1 (2025): $586,210.1m GDP; Census July 2025: 7,315,076 residents; calculated_value = GDP ($m) × 1,000,000 ÷ residents. |
| 30 | North Carolina | $80,007 | South · BEA SAGDP1 (2025): $895,919.2m GDP; Census July 2025: 11,197,968 residents; calculated_value = GDP ($m) × 1,000,000 ÷ residents. |
| 31 | Rhode Island | $79,174 | Northeast · BEA SAGDP1 (2025): $88,240.6m GDP; Census July 2025: 1,114,521 residents; calculated_value = GDP ($m) × 1,000,000 ÷ residents. |
| 32 | Kansas | $77,961 | Midwest · BEA SAGDP1 (2025): $232,106.7m GDP; Census July 2025: 2,977,220 residents; calculated_value = GDP ($m) × 1,000,000 ÷ residents. |
| 33 | Indiana | $77,790 | Midwest · BEA SAGDP1 (2025): $542,457.6m GDP; Census July 2025: 6,973,333 residents; calculated_value = GDP ($m) × 1,000,000 ÷ residents. |
| 34 | Arizona | $77,665 | West · BEA SAGDP1 (2025): $592,103.0m GDP; Census July 2025: 7,623,818 residents; calculated_value = GDP ($m) × 1,000,000 ÷ residents. |
| 35 | Vermont | $77,029 | Northeast · BEA SAGDP1 (2025): $49,657.5m GDP; Census July 2025: 644,663 residents; calculated_value = GDP ($m) × 1,000,000 ÷ residents. |
| 36 | Florida | $76,958 | South · BEA SAGDP1 (2025): $1,805,620.2m GDP; Census July 2025: 23,462,518 residents; calculated_value = GDP ($m) × 1,000,000 ÷ residents. |
| 37 | Missouri | $75,811 | Midwest · BEA SAGDP1 (2025): $475,377.3m GDP; Census July 2025: 6,270,541 residents; calculated_value = GDP ($m) × 1,000,000 ÷ residents. |
| 38 | Louisiana | $74,125 | South · BEA SAGDP1 (2025): $342,321.2m GDP; Census July 2025: 4,618,189 residents; calculated_value = GDP ($m) × 1,000,000 ÷ residents. |
| 39 | Michigan | $72,462 | Midwest · BEA SAGDP1 (2025): $733,887.1m GDP; Census July 2025: 10,127,884 residents; calculated_value = GDP ($m) × 1,000,000 ÷ residents. |
| 40 | Maine | $71,898 | Northeast · BEA SAGDP1 (2025): $101,726.2m GDP; Census July 2025: 1,414,874 residents; calculated_value = GDP ($m) × 1,000,000 ÷ residents. |
| 41 | New Mexico | $71,569 | West · BEA SAGDP1 (2025): $152,120.0m GDP; Census July 2025: 2,125,498 residents; calculated_value = GDP ($m) × 1,000,000 ÷ residents. |
| 42 | Montana | $70,713 | West · BEA SAGDP1 (2025): $80,945.2m GDP; Census July 2025: 1,144,694 residents; calculated_value = GDP ($m) × 1,000,000 ÷ residents. |
| 43 | Kentucky | $68,065 | South · BEA SAGDP1 (2025): $313,566.3m GDP; Census July 2025: 4,606,864 residents; calculated_value = GDP ($m) × 1,000,000 ÷ residents. |
| 44 | South Carolina | $67,929 | South · BEA SAGDP1 (2025): $378,383.0m GDP; Census July 2025: 5,570,274 residents; calculated_value = GDP ($m) × 1,000,000 ÷ residents. |
| 45 | Idaho | $67,695 | West · BEA SAGDP1 (2025): $137,401.9m GDP; Census July 2025: 2,029,733 residents; calculated_value = GDP ($m) × 1,000,000 ÷ residents. |
| 46 | Oklahoma | $66,523 | South · BEA SAGDP1 (2025): $274,292.2m GDP; Census July 2025: 4,123,288 residents; calculated_value = GDP ($m) × 1,000,000 ÷ residents. |
| 47 | Alabama | $65,286 | South · BEA SAGDP1 (2025): $339,035.1m GDP; Census July 2025: 5,193,088 residents; calculated_value = GDP ($m) × 1,000,000 ÷ residents. |
| 48 | West Virginia | $63,020 | South · BEA SAGDP1 (2025): $111,302.3m GDP; Census July 2025: 1,766,147 residents; calculated_value = GDP ($m) × 1,000,000 ÷ residents. |
| 49 | Arkansas | $62,922 | South · BEA SAGDP1 (2025): $195,988.2m GDP; Census July 2025: 3,114,791 residents; calculated_value = GDP ($m) × 1,000,000 ÷ residents. |
| 50 | Mississippi | $55,117 | South · BEA SAGDP1 (2025): $162,824.8m GDP; Census July 2025: 2,954,160 residents; calculated_value = GDP ($m) × 1,000,000 ÷ residents. |
No states match these filters.
All 50 entries: target year 2025; calculated_value; BEA SAGDP1 line 3 and U.S. Census Bureau NST-EST2025-ALLDATA. GDP is in millions of nominal dollars; population is July 1 residents. Ranks use exact calculated ratios; values shown above are rounded. Sources and complete methodology appear on this page.
What the 2025 state GDP per capita data reveals
Key Insight
New York (#1) has $123,273 in GDP per resident against Mississippi's (#50) $55,117. That is a 2.24× ratio and a $68,156 difference between displayed values.
Notable Pattern
The unweighted median is $81,493, below the $89,429 aggregate GDP per resident obtained from all 50 state GDP and population totals. Only 17 of 50 states exceed the aggregate figure; 33 fall below.
Regional/Source Concentration
Among the top 20 states, the West contributes 6, Northeast 5, Midwest 5 and South 4. These are Census-region counts, not shares of national GDP.
Outlier
Delaware is #2 by GDP per capita ($115,043) but #41 by total nominal GDP ($121,940.0 million): a 39-position difference. A small GDP total does not necessarily imply low output per resident.
What the ranking means — and what it cannot tell you
Use this ranking to compare 2025 nominal economic production per resident, not average living standards. The result combines a workplace-based GDP numerator with a resident-population denominator. A state with commuters entering from neighboring states or a capital-intensive economy can have a high ratio without a comparable advantage in household pay.
Total GDP answers a different question: how large is a state economy, regardless of population? See StatRanker's ranking of states by total nominal GDP for that comparison. The linked article uses 2024 data, whereas this ranking uses 2025. Do not interpret differences between those two pages as same-year rank changes or economic growth.
For decisions about jobs, household finances or affordability, examine additional measures such as median household income, per-capita personal income, regional price parities and employment data. BEA revises historical series; date and source vintage matter when comparing a new ranking with an older article.
FAQ: GDP per capita by state in 2025
Which state had the highest GDP per capita in 2025?
New York ranks first among the 50 states at $123,273 per resident, calculated from $2,465,749.3 million in 2025 nominal GDP and 20,002,427 residents on July 1, 2025.
Is this an official BEA per-capita ranking?
No. BEA publishes nominal state GDP and Census publishes resident population. StatRanker divides the matching observed 2025 values and sorts the resulting 50 ratios. Every GDP-per-capita row is labeled calculated_value, not official_value.
Are the values 2025 data or 2026 forecasts?
They are calculations using 2025 annual GDP observations, revised by BEA on September 30, 2026, and July 1, 2025 Census population estimates published in January 2026. No 2026 projection, extrapolation or imputation is used.
Why is Washington, D.C. not ranked as a state?
D.C. is a federal district, so it is excluded from the 50-state universe. For reference only, its observed 2025 GDP of $192,975.4 million divided by 693,645 residents is approximately $278,205 per person; that value is not assigned a state rank.
Why can Delaware rank second with a small total GDP?
Delaware has $121,940.0 million in nominal GDP, 41st by state total, and 1,059,952 residents, yielding $115,043 per resident and second place. Per-capita and absolute-size rankings measure different things; the table does not identify a cause.
Does $123,273 mean that New York residents earn that much?
No. GDP measures production inside the state, not earnings paid to each resident. It includes economic activity attributable to capital, businesses and workers, including those who may commute from other states. Median wages and personal income are separate measures.
Is the ranking adjusted for inflation or state cost of living?
No. The numerator is current-dollar GDP and the denominator is a population count, giving nominal dollars per resident. It does not use a state price-parity adjustment or real chained-dollar GDP. A nominal comparison should not be interpreted as a purchasing-power or real-growth ranking.
What is the median, and how was it calculated?
The middle two state observations are Ohio (#25) and Pennsylvania (#26). The mean of their unrounded GDP-per-capita ratios is $81,492.51, displayed as a 50-state median of $81,493. This is different from dividing combined state GDP by combined population ($89,429).
Could a later BEA release change these numbers?
Yes. BEA revises estimates. For the same 2025 observation, Delaware GDP changed from $117,218.0 million in the April 9, 2026 release to $121,940.0 million in the September 30, 2026 release. The ranking uses the later vintage consistently.
Sources and roles
The two numeric publishers are independent federal agencies. Validation mirrors and methodology references are not counted as additional independent publishers for the ratio.
U.S. Bureau of Economic Analysis — SAGDP annual data
Official 2025 state GDP numerator, SAGDP1 line 3, millions of current U.S. dollars; revised September 30, 2026.
https://apps.bea.gov/regional/zip/SAGDP.zipU.S. Census Bureau — Vintage 2025 state estimates
Official July 1, 2025 state resident population denominator, NST-EST2025-ALLDATA, released January 27, 2026.
https://www2.census.gov/programs-surveys/popest/datasets/2020-2025/state/totals/NST-EST2025-ALLDATA.csvBEA — Gross Domestic Product by State: Concepts and Methods
Definition, scope and economic interpretation of state production; not a third numeric input.
https://www.bea.gov/resources/methodologies/gdp-by-stateBEA — GDP by State release page
Confirms regional GDP release date, publication process and the September 30, 2026 annual update.
https://www.bea.gov/data/gdp/gdp-stateFederal Reserve Bank of St. Louis — FRED NYNGSP table data
BEA data redistributed by FRED. The September 30, 2026 revision lists New York's 2025 GDP as $2,465,749.3 million; older cached pages may show the April release. This is not a third numeric publisher.
https://fred.stlouisfed.org/data/NYNGSPALFRED — State GDP release archived September 30, 2026
Dated archive of the BEA revision used here. Allows readers to distinguish the September 2026 data vintage from the earlier April 2026 estimates; ALFRED and FRED are the same Federal Reserve data publisher.
https://alfred.stlouisfed.org/release?rd=2026-09-30&rid=140US Economic Data — regional release revisions
Secondary preservation and comparison of April versus September 2026 BEA GDP vintages used for conflict checks; not treated as an original government observation.
https://useconomicdata.com/research/release-changes/U.S. Census Bureau — Vintage 2025 release documentation
Population methodology and data-vintage context, including publication date and coverage.
https://www.census.gov/newsroom/press-kits/2026/national-state-population-estimates.htmlU.S. Census Bureau — Census regions and divisions
Confirms the four-region grouping used to analyze the ranking: Northeast, Midwest, South and West. Regions are distinct from nine Census divisions.
https://www.census.gov/data/data-tools/survey-explorer/geo.htmlDownload the GDP per Capita by U.S. State: 2025 Ranking dataset
GDP per Capita by U.S. State: 2025 Ranking
50 ranked entries · Excel + CSV + methodology + sources + chart · Snapshot: 2025 state GDP and July 1 resident population; 2026-10-24 article snapshot · Version 1.0
The archive includes machine-readable data, methodology and source documentation. Quick human verification is required before the ZIP is delivered. Full Data Pack downloads require a free account. Free accounts can download 1 different Data Pack every 30 days; re-downloading the same pack does not use another slot. Annual Data Access provides unlimited manual downloads while annual access is active.
Download Excel + CSV Data Pack