

Wheat Production by Country 2026: Official FAOSTAT 2024 Ranking
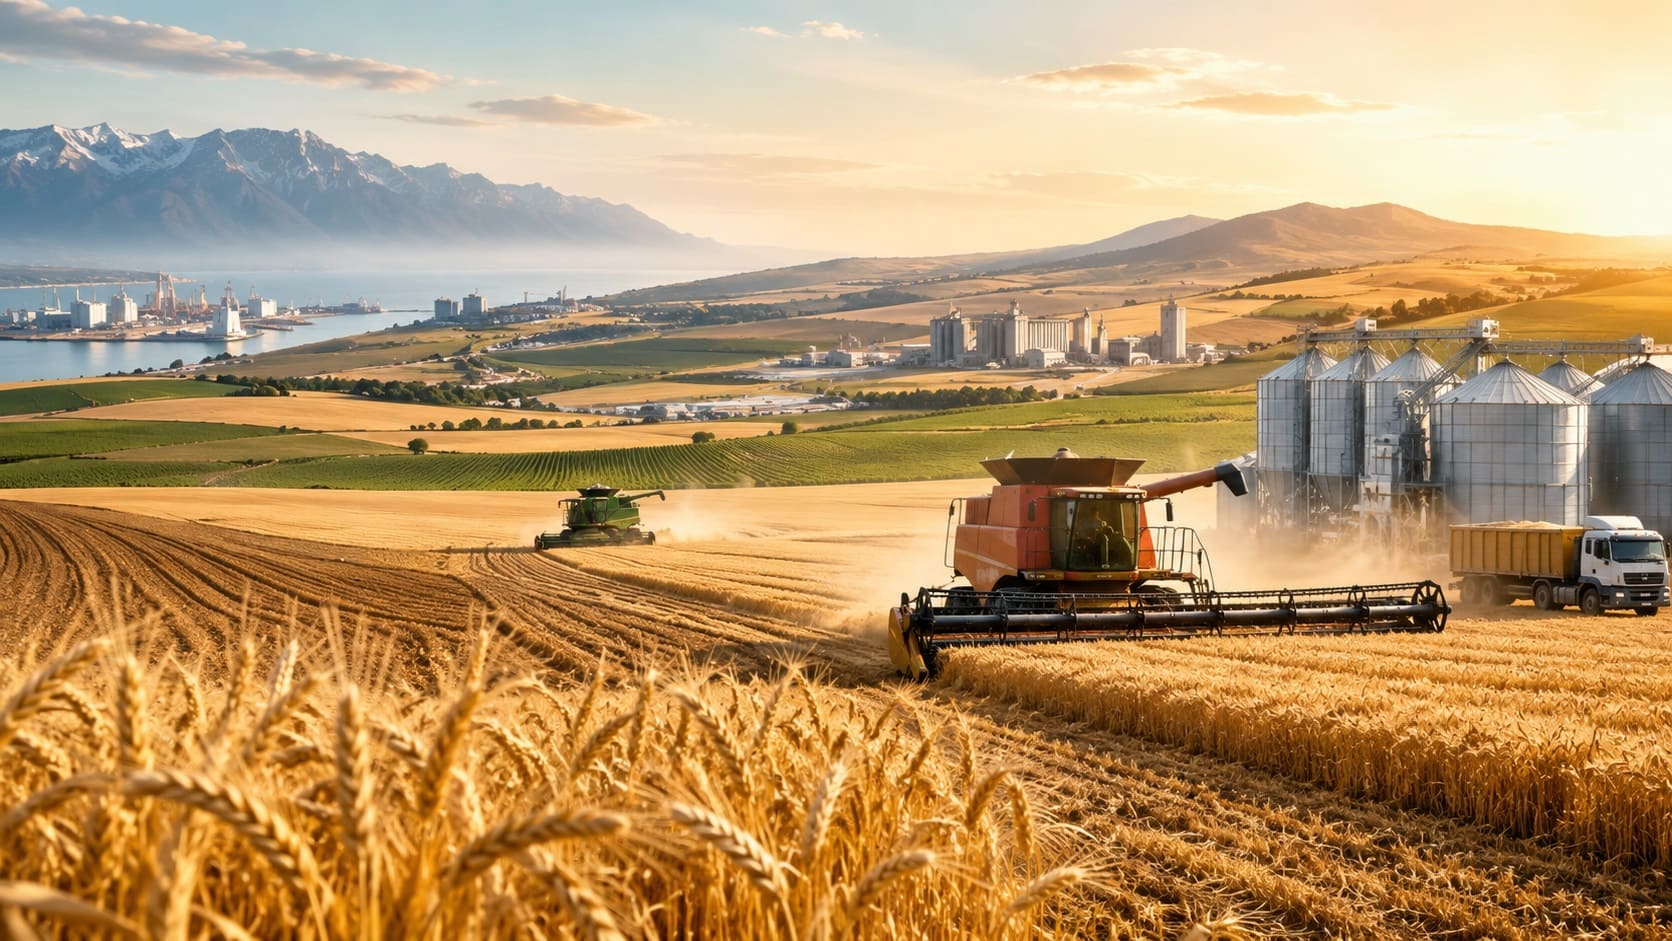
Global Wheat Production Leaders in the Latest FAOSTAT Dataset
China produced more wheat than any other country in 2024, followed by India and the Russian Federation. The ranking compares the physical quantity of wheat produced within each country using FAOSTAT’s Crops and livestock products dataset.
This 2026 ranking uses the latest available FAOSTAT data for 2024. Values are measured in tonnes and ranked from highest to lowest. The ranking covers 50 countries and compares wheat production volume only. Exports, harvested area and yield are separate indicators.
The ranking contains no forecasts or projected values.
Continue exploring
More StatRanker pages connected by topic, category or ranking theme.
China produced 140.1 million tonnes of wheat in 2024, India produced 113.3 million tonnes, and the Russian Federation produced 82.6 million tonnes.
140,100,000 tonnes in 2024.
113,292,370 tonnes in 2024.
FAOSTAT’s global wheat production total for 2024.
China, India and the Russian Federation produced 335.98 million tonnes combined.
The listed countries produced approximately 784.07 million tonnes.
All entries use FAOSTAT data for 2024.
What Wheat Production Volume Measures
Wheat production volume records the quantity of wheat harvested as grain within a country during the reference year. FAOSTAT reports the measure in tonnes. It describes agricultural output rather than the amount exported, consumed, stored or traded internationally.
This is an absolute-size ranking. A country can rank highly because it cultivates a large wheat area, achieves strong yields or combines both. Population size, domestic consumption and export dependence do not determine the rank.
Harvested area, yield and trade use different measures and answer different questions. Keeping them separate makes the country comparison consistent.
Countries Producing the Most Wheat in 2024
China and India formed the leading production tier. The Russian Federation ranked third, followed by the United States, Canada, Australia and Pakistan.
Top 10 countries by 2024 wheat production
| Rank | Country | Production | Region |
|---|---|---|---|
| 1 | China | 140,100,000 tonnes | East Asia & Pacific |
| 2 | India | 113,292,370 tonnes | South Asia |
| 3 | Russian Federation | 82,588,000 tonnes | Europe & Central Asia |
| 4 | United States | 53,650,020 tonnes | North America |
| 5 | Canada | 35,938,840 tonnes | North America |
| 6 | Australia | 34,110,000 tonnes | East Asia & Pacific |
| 7 | Pakistan | 31,814,444 tonnes | South Asia |
| 8 | France | 26,606,940 tonnes | Europe & Central Asia |
| 9 | Ukraine | 22,441,110 tonnes | Europe & Central Asia |
| 10 | Türkiye | 20,800,000 tonnes | Europe & Central Asia |
All values are from FAOSTAT for 2024 and are measured in tonnes. Countries are ranked by the full production value before display formatting.
Top 20 Wheat Producers Compared
Each bar uses the same 2024 production value as the ranking table. China is set to 100%, and the remaining bars are scaled against its 140.1 million tonnes.
Methodology and Data Limits
Metric and unit
The ranking measures wheat production in tonnes. Larger production volumes rank higher.
Reference year
Every country value refers to 2024. The 2026 label identifies the publication snapshot rather than a forecast year.
Data source
All ranking values come from FAOSTAT’s Crops and livestock products dataset.
Country coverage
The ranking includes the 50 countries with the highest published 2024 production volumes. Regional and global aggregates are excluded.
Separate indicators
Harvested area, yield, exports, imports, stocks and consumption are excluded because they measure different aspects of the wheat market.
Missing values
Countries without a published 2024 wheat production value were not included.
FAOSTAT flags
FAOSTAT may flag individual observations as reported, estimated or provisional. Countries are ranked by the value published in the dataset.
Rounding
The table retains the published tonne values. Chart labels are shown in million tonnes and rounded for readability.
Regional labels are included for navigation and comparison. They do not affect the country values or ranks.
Production volume does not measure yield efficiency, profitability, grain quality, environmental impact, export availability or food security. Annual output can change because of weather, planted area, input availability and later statistical revisions.
Full Ranking: Top 50 Wheat-Producing Countries
Search for a country, filter the ranking by region, change the sort order, or display the Top 10, Top 20 or full Top 50.
Top 50 countries by wheat production, FAOSTAT 2024
| Rank | Country | Production | Region |
|---|---|---|---|
| 1 | China | 140,100,000 tonnes | East Asia & Pacific |
| 2 | India | 113,292,370 tonnes | South Asia |
| 3 | Russian Federation | 82,588,000 tonnes | Europe & Central Asia |
| 4 | United States | 53,650,020 tonnes | North America |
| 5 | Canada | 35,938,840 tonnes | North America |
| 6 | Australia | 34,110,000 tonnes | East Asia & Pacific |
| 7 | Pakistan | 31,814,444 tonnes | South Asia |
| 8 | France | 26,606,940 tonnes | Europe & Central Asia |
| 9 | Ukraine | 22,441,110 tonnes | Europe & Central Asia |
| 10 | Türkiye | 20,800,000 tonnes | Europe & Central Asia |
| 11 | Kazakhstan | 18,576,694 tonnes | Europe & Central Asia |
| 12 | Germany | 18,526,700 tonnes | Europe & Central Asia |
| 13 | Argentina | 18,510,280 tonnes | Latin America & Caribbean |
| 14 | Iran | 16,750,000 tonnes | Middle East & North Africa |
| 15 | Poland | 12,183,620 tonnes | Europe & Central Asia |
| 16 | United Kingdom | 11,146,000 tonnes | Europe & Central Asia |
| 17 | Egypt | 9,400,000 tonnes | Middle East & North Africa |
| 18 | Romania | 9,290,880 tonnes | Europe & Central Asia |
| 19 | Brazil | 7,633,178 tonnes | Latin America & Caribbean |
| 20 | Spain | 7,147,930 tonnes | Europe & Central Asia |
| 21 | Bulgaria | 7,085,140 tonnes | Europe & Central Asia |
| 22 | Uzbekistan | 6,729,357.5 tonnes | Europe & Central Asia |
| 23 | Italy | 6,213,210 tonnes | Europe & Central Asia |
| 24 | Ethiopia | 6,185,341.5 tonnes | Sub-Saharan Africa |
| 25 | Hungary | 5,272,960 tonnes | Europe & Central Asia |
| 26 | Iraq | 5,234,171 tonnes | Middle East & North Africa |
| 27 | Afghanistan | 5,200,000 tonnes | South Asia |
| 28 | Czechia | 4,625,370 tonnes | Europe & Central Asia |
| 29 | Lithuania | 4,219,300 tonnes | Europe & Central Asia |
| 30 | Denmark | 3,348,010 tonnes | Europe & Central Asia |
| 31 | Algeria | 3,000,000 tonnes | Middle East & North Africa |
| 32 | Sweden | 2,930,600 tonnes | Europe & Central Asia |
| 33 | Serbia | 2,900,536 tonnes | Europe & Central Asia |
| 34 | Belarus | 2,750,000 tonnes | Europe & Central Asia |
| 35 | Mexico | 2,648,377.8 tonnes | Latin America & Caribbean |
| 36 | Latvia | 2,465,900 tonnes | Europe & Central Asia |
| 37 | Morocco | 2,441,670.5 tonnes | Middle East & North Africa |
| 38 | Syrian Arab Republic | 2,431,225 tonnes | Middle East & North Africa |
| 39 | Nepal | 2,035,559 tonnes | South Asia |
| 40 | South Africa | 1,924,890 tonnes | Sub-Saharan Africa |
| 41 | Slovakia | 1,907,940 tonnes | Europe & Central Asia |
| 42 | Azerbaijan | 1,901,046.1 tonnes | Europe & Central Asia |
| 43 | Austria | 1,576,010 tonnes | Europe & Central Asia |
| 44 | Turkmenistan | 1,330,000 tonnes | Europe & Central Asia |
| 45 | Uruguay | 1,295,414.6 tonnes | Latin America & Caribbean |
| 46 | Greece | 1,209,310 tonnes | Europe & Central Asia |
| 47 | Moldova | 1,194,779 tonnes | Europe & Central Asia |
| 48 | Chile | 1,188,784.9 tonnes | Latin America & Caribbean |
| 49 | Bangladesh | 1,172,242 tonnes | South Asia |
| 50 | Tunisia | 1,150,000 tonnes | Middle East & North Africa |
The ranking uses FAOSTAT’s wheat production series for 2024, measured in tonnes. Regional aggregates are excluded.
Insights from the Ranking
Key insight
China and India produced 253.39 million tonnes combined, equivalent to approximately 31.7% of the 2024 world total.
Notable pattern
The top three producers accounted for approximately 42.1% of global output, although no single country produced more than one fifth of the total.
Regional concentration
Europe and Central Asia supplied 10 of the first 20 ranked countries, including the Russian Federation, France, Ukraine, Türkiye, Kazakhstan and Germany.
Closest cluster
Kazakhstan, Germany and Argentina were separated by only 66,414 tonnes across ranks 11–13.
How to Interpret the Results
The ranking shows where the largest physical volumes of wheat were produced in 2024. It is useful for comparing national production scale and identifying the countries that contribute most to global supply.
The 2026 label refers to the publication snapshot; every ranked value refers to 2024.
A high production rank does not necessarily indicate a high yield, a large export surplus or strong food security. Countries differ in domestic consumption, imports, stocks, processing demand and the share of their harvest available for export.
Frequently Asked Questions
Which country produced the most wheat in 2024?
China ranked first with 140,100,000 tonnes, followed by India with 113,292,370 tonnes and the Russian Federation with 82,588,000 tonnes.
Are these wheat production figures for 2026?
No. The ranking was published as a 2026 snapshot, but all country values refer to 2024.
What does wheat production measure?
It measures the physical quantity of wheat produced within a country during the reference year, expressed in tonnes.
Does this ranking include wheat exports?
No. Exports measure cross-border trade, while this table measures domestic agricultural production.
Are harvested area and yield included?
No. Harvested area is measured in hectares, while yield measures output per unit of area. FAOSTAT reports both separately.
Why can production and export rankings differ?
Countries differ in domestic consumption, imports, stocks, processing demand and trade policy. A major producer may export only part of its harvest.
Sources
FAOSTAT — Crops and livestock products
Primary source for the wheat production values used in the ranking.
FAOSTAT bulk dataset catalog
Official catalog for the dataset description, coverage, update information and downloadable files.
FAOSTAT normalized data download
Machine-readable download containing country, item, element, year, unit, value and observation fields.
https://bulks-faostat.fao.org/production/Production_Crops_Livestock_E_All_Data_(Normalized).zip
FAOSTAT data portal
Official FAO portal for international food and agriculture statistics.
Related rankings
More StatRanker pages connected by topic, category or ranking theme.
Sugarcane Production by Country 2026: Official FAOSTAT 2024 Ranking
Open rankingPotato Production by Country 2026: FAOSTAT 2024 Ranking
Open rankingBanana Production by Country 2026: Official FAOSTAT 2024 Ranking
Open rankingBlueberry Production by Country 2026: Official FAOSTAT 2024 Ranking
Open ranking
StatRanker (Website)
administrator
