

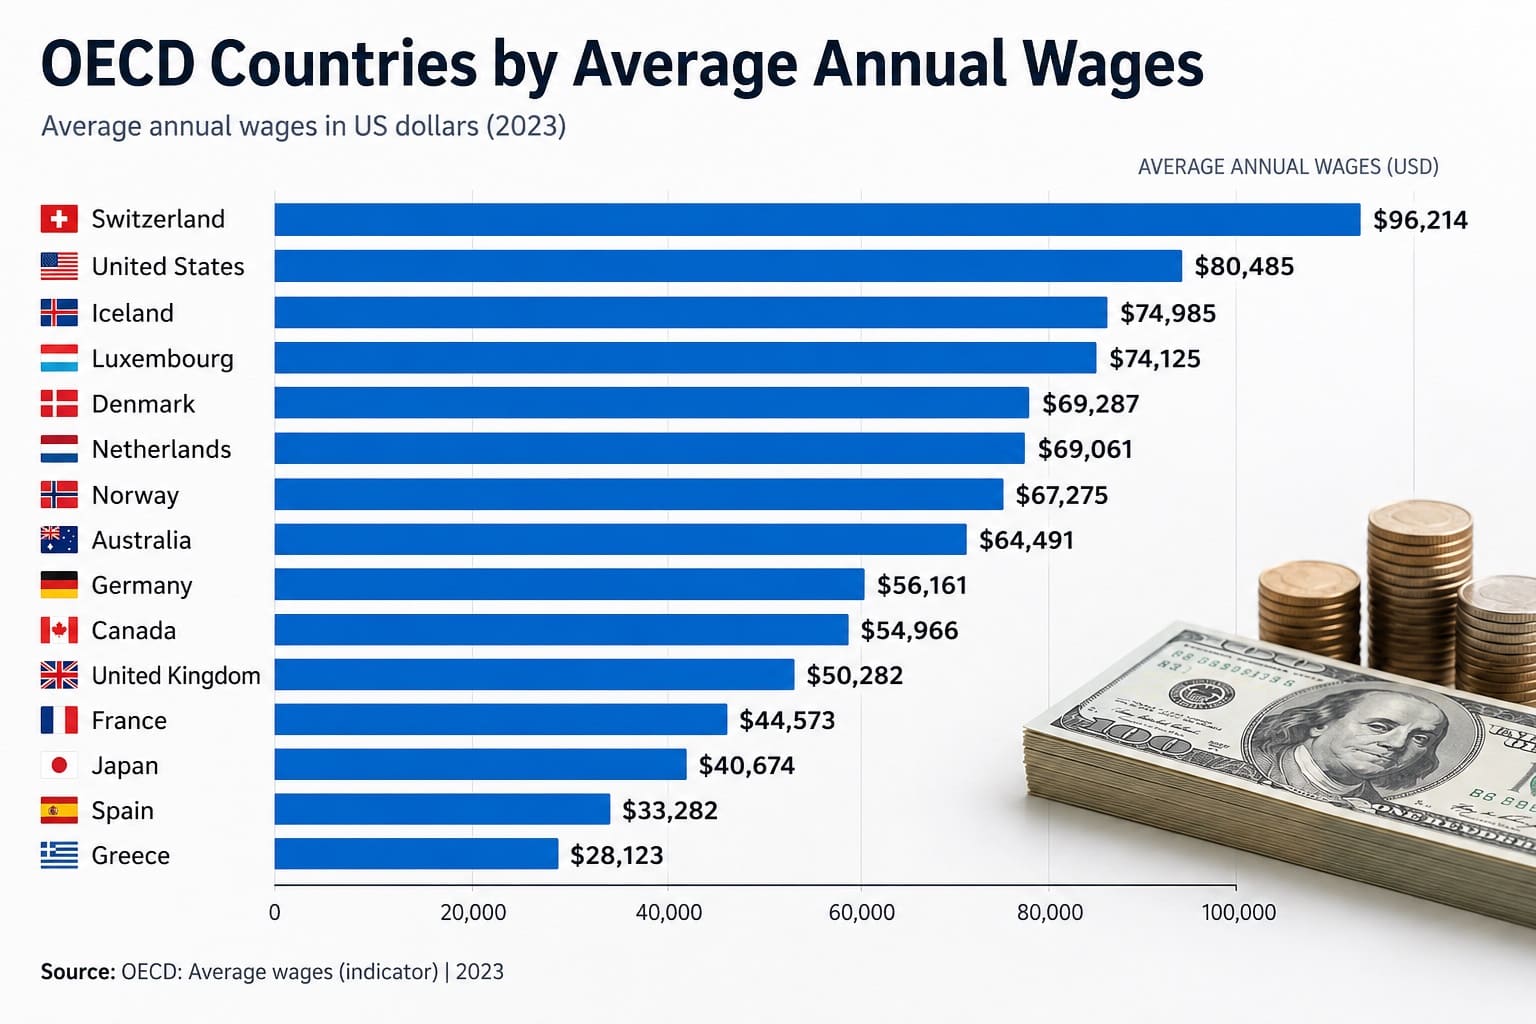
Top OECD Countries by Average Annual Wages, 2026 Snapshot
Global Export Leaders by Country and Economy
China leads this export ranking with $3.753 trillion in goods and services exports, followed by the United States and Germany. The comparison uses total export value in current U.S. dollars and ranks the latest available country-level World Bank WDI values from highest to lowest.
This is a 2026 research snapshot, not a synthetic 2026 forecast. Most rows use 2024 WDI values. The United Arab Emirates and Kuwait use 2023 values, while Qatar uses 2022 because those are the latest available WDI entries in this data pack.
The table covers 50 confirmed countries and economies. World Bank aggregates, regional totals and income groups are excluded so the ranking stays at country/economy level only. All included rows are official values; there are no official forecasts or modeled projections.
Key findings
- Top exporter: China, with $3.753 trillion in total exports.
- Next largest: the United States at $3.194 trillion and Germany at $1.941 trillion.
- Measure used: goods and services exports, reported in current U.S. dollars.
- Source base: World Bank WDI indicator NE.EXP.GNFS.CD, latest available values.
- Coverage: 50 country and economy rows; no regional or income-group aggregates.
- Reading limit: the table shows nominal export value, not trade surplus, real volume or exports as a share of GDP.
China ranks first by total goods and services exports.
The three largest entries sit well above the rest of the table by nominal value.
Only country and economy rows with confirmed WDI values are included.
Official values / official forecasts / modeled projections. No synthetic 2026 estimates are used.
Overview: what export value shows
Export value shows how much goods and market services an economy sells to the rest of the world. In this dataset, the measure includes merchandise trade and services such as travel, transport, freight, insurance, financial services, business services, communications, construction and royalties.
Because the ranking uses total current-dollar value, it favors economies with large production bases, major service sectors, commodity exports or strong trade-hub roles. That is why large economies such as China, the United States and Germany appear at the top, while smaller hubs such as Singapore, the Netherlands, Hong Kong SAR and Ireland also rank highly.
The figures should be read as nominal export scale, not as a complete measure of trade strength. A high position does not automatically mean a trade surplus, strong domestic value added, broad export diversification or high exports relative to population or GDP.
To keep the comparison consistent, each included row has a confirmed WDI value, source year, unit and country/economy identifier. Regional totals, income groups and other aggregate categories are not part of the table.
Top 10 exporters by goods and services value
The first ten places show how concentrated global export value is. China and the United States are in a separate tier, Germany follows as the largest European exporter, and the rest of the group is split between major European economies and Asian trade or production hubs.
Top 10 exporters by latest available World Bank WDI value
| Rank | Entity | Value | Region / note |
|---|---|---|---|
| 1 | China | $3.753T | East Asia & Pacific; WDI 2024; current US$. |
| 2 | United States | $3.194T | North America; WDI 2024; current US$. |
| 3 | Germany | $1.941T | Europe & Central Asia; WDI 2024; current US$. |
| 4 | United Kingdom | $1.142T | Europe & Central Asia; WDI 2024; current US$. |
| 5 | France | $1.071T | Europe & Central Asia; WDI 2024; current US$. |
| 6 | Netherlands | $1.001T | Europe & Central Asia; WDI 2024; current US$. |
| 7 | Singapore | $978.6B | East Asia & Pacific; WDI 2024; current US$. |
| 8 | Japan | $917.0B | East Asia & Pacific; WDI 2024; current US$. |
| 9 | Ireland | $877.1B | Europe & Central Asia; WDI 2024; current US$. |
| 10 | Korea, Rep. | $831.9B | East Asia & Pacific; WDI 2024; current US$. |
Display values are rounded. Ranking uses the underlying current-dollar WDI value in descending order.
Chart: Top 20 export economies by nominal value
The chart makes the gap at the top easier to see. China and the United States are far ahead of the rest of the Top 20, while Germany is the only other economy above $1.9 trillion in this snapshot.
Methodology: how the ranking was built
The ranking uses World Bank WDI indicator NE.EXP.GNFS.CD, which reports exports of goods and services in current U.S. dollars. Rows are sorted by the raw numeric value, not by the rounded display label shown in the table.
Value and unit
The source unit is current U.S. dollars. Values on this page are converted to billions or trillions only for readability.
Ranking order
Higher nominal export value ranks higher. The table is sorted descending from the largest confirmed value to the smallest included value.
Mixed-year handling
Most rows use 2024 values. UAE and Kuwait use 2023, and Qatar uses 2022 because newer WDI values are not included for those rows in this pack.
Included rows
The table includes country and economy entries only. Aggregates, regional totals and income groups are excluded before ranking.
Display conversion: the source value is divided by 1,000,000,000 to show U.S. dollar billions, with trillion labels used for values above one trillion. The conversion changes only the label, not the rank.
Important limits: current-dollar export values can move because of exchange rates, commodity prices, inflation and services-reporting practices. The metric does not measure trade balance, domestic value added, export complexity, export diversification, export dependence, exports per person or export share of GDP.
Main ranking: Top 50 countries and economies by exports
Use the controls to search the table, filter by World Bank region or value status, change the sort order, or switch between Top 10, Top 20 and all 50 confirmed entries.
Top 50 exporters by goods and services, latest available official WDI value
| Rank | Entity | Value | Region / note |
|---|---|---|---|
| 1 | China | $3.753T | East Asia & Pacific; WDI 2024; current US$. |
| 2 | United States | $3.194T | North America; WDI 2024; current US$. |
| 3 | Germany | $1.941T | Europe & Central Asia; WDI 2024; current US$. |
| 4 | United Kingdom | $1.142T | Europe & Central Asia; WDI 2024; current US$. |
| 5 | France | $1.071T | Europe & Central Asia; WDI 2024; current US$. |
| 6 | Netherlands | $1.001T | Europe & Central Asia; WDI 2024; current US$. |
| 7 | Singapore | $978.6B | East Asia & Pacific; WDI 2024; current US$. |
| 8 | Japan | $917.0B | East Asia & Pacific; WDI 2024; current US$. |
| 9 | Ireland | $877.1B | Europe & Central Asia; WDI 2024; current US$. |
| 10 | Korea, Rep. | $831.9B | East Asia & Pacific; WDI 2024; current US$. |
| 11 | India | $827.4B | South Asia; WDI 2024; current US$. |
| 12 | Italy | $773.9B | Europe & Central Asia; WDI 2024; current US$. |
| 13 | Hong Kong SAR, China | $739.6B | East Asia & Pacific; WDI 2024; current US$. |
| 14 | Canada | $727.9B | North America; WDI 2024; current US$. |
| 15 | Mexico | $681.3B | Latin America & Caribbean; WDI 2024; current US$. |
| 16 | Switzerland | $675.8B | Europe & Central Asia; WDI 2024; current US$. |
| 17 | Spain | $639.5B | Europe & Central Asia; WDI 2024; current US$. |
| 18 | United Arab Emirates | $558.4B | Middle East & North Africa; WDI 2023; current US$. mixed-year row |
| 19 | Belgium | $532.2B | Europe & Central Asia; WDI 2024; current US$. |
| 20 | Poland | $478.9B | Europe & Central Asia; WDI 2024; current US$. |
| 21 | Russian Federation | $476.4B | Europe & Central Asia; WDI 2024; current US$. |
| 22 | Australia | $432.6B | East Asia & Pacific; WDI 2024; current US$. |
| 23 | Viet Nam | $429.5B | East Asia & Pacific; WDI 2024; current US$. |
| 24 | Brazil | $392.1B | Latin America & Caribbean; WDI 2024; current US$. |
| 25 | Turkiye | $374.7B | Europe & Central Asia; WDI 2024; current US$. |
| 26 | Thailand | $368.8B | East Asia & Pacific; WDI 2024; current US$. |
| 27 | Saudi Arabia | $360.9B | Middle East & North Africa; WDI 2024; current US$. |
| 28 | Sweden | $327.9B | Europe & Central Asia; WDI 2024; current US$. |
| 29 | Indonesia | $309.7B | East Asia & Pacific; WDI 2024; current US$. |
| 30 | Denmark | $301.4B | Europe & Central Asia; WDI 2024; current US$. |
| 31 | Malaysia | $301.2B | East Asia & Pacific; WDI 2024; current US$. |
| 32 | Austria | $297.8B | Europe & Central Asia; WDI 2024; current US$. |
| 33 | Czechia | $239.0B | Europe & Central Asia; WDI 2024; current US$. |
| 34 | Norway | $229.7B | Europe & Central Asia; WDI 2024; current US$. |
| 35 | Luxembourg | $178.7B | Europe & Central Asia; WDI 2024; current US$. |
| 36 | Hungary | $167.9B | Europe & Central Asia; WDI 2024; current US$. |
| 37 | Qatar | $161.7B | Middle East & North Africa; WDI 2022; current US$. mixed-year row |
| 38 | Israel | $153.7B | Middle East & North Africa; WDI 2024; current US$. |
| 39 | Portugal | $143.4B | Europe & Central Asia; WDI 2024; current US$. |
| 40 | Romania | $136.2B | Europe & Central Asia; WDI 2024; current US$. |
| 41 | South Africa | $127.5B | Sub-Saharan Africa; WDI 2024; current US$. |
| 42 | Finland | $125.2B | Europe & Central Asia; WDI 2024; current US$. |
| 43 | Slovak Republic | $120.5B | Europe & Central Asia; WDI 2024; current US$. |
| 44 | Philippines | $119.0B | East Asia & Pacific; WDI 2024; current US$. |
| 45 | Iran, Islamic Rep. | $111.9B | Middle East & North Africa; WDI 2024; current US$. |
| 46 | Chile | $111.4B | Latin America & Caribbean; WDI 2024; current US$. |
| 47 | Greece | $107.9B | Europe & Central Asia; WDI 2024; current US$. |
| 48 | Iraq | $104.9B | Middle East & North Africa; WDI 2024; current US$. |
| 49 | Argentina | $97.3B | Latin America & Caribbean; WDI 2024; current US$. |
| 50 | Kuwait | $95.5B | Middle East & North Africa; WDI 2023; current US$. mixed-year row |
Rows use official WDI values. UAE and Kuwait are marked as 2023 rows; Qatar is marked as a 2022 row. All other included entries use 2024 values.
Insights from the Top 50 export ranking
Top-heavy distribution
The largest three exporters are far ahead of the rest of the table. China and the United States each exceed $3 trillion, while Germany is the only other entry above $1.9 trillion.
Europe’s dense presence
Europe has many entries because the region combines large industrial exporters, high-value services, intra-European supply chains and several smaller open economies.
Asian trade hubs
East Asia & Pacific appears strongly near the top through China, Singapore, Japan, Korea, Hong Kong SAR, Australia and Viet Nam.
Small economy, large flow
Singapore ranks far above what population size would suggest, reflecting its role in logistics, services, re-exports and regional trade intermediation.
What this ranking means
The table is useful for comparing the scale of outward trade flows. It shows where the largest reported exports originate, which can help readers understand production scale, services strength, commodity exposure and trade-hub activity.
It should not be read as a simple league table of economic strength. A high export value can come from a large domestic economy, a specialized services sector, oil and gas exports, re-export flows or multinational-company structures.
The main risk is confusing nominal export value with real trade volume. Exchange-rate changes, inflation and commodity-price movements can shift current-dollar values even when the underlying physical quantity changes less dramatically.
FAQ
Which country exports the most goods and services?
China ranks first in this Top 50 table, with about $3.753 trillion in goods and services exports in the latest available WDI value.
Are these 2026 export numbers?
No. This is a 2026 snapshot built from the latest available official WDI values. Most rows are 2024, while UAE and Kuwait use 2023 and Qatar uses 2022.
Does the metric include services?
Yes. The indicator covers goods and market services, including transport, travel, insurance, financial services, business services, communications, construction and royalties.
Is this the same as merchandise exports?
No. Merchandise exports count goods only. This table uses a broader measure that includes both goods and services.
Does a high export value mean a trade surplus?
No. Export value measures outward sales. A country can export a large amount and still import even more.
Why do some smaller economies rank so high?
Economies such as Singapore, the Netherlands, Hong Kong SAR and Ireland can report large export values because of logistics, services, re-export flows and multinational activity.
What does this table not measure?
It does not measure exports per person, export share of GDP, trade balance, domestic value added, export complexity, export diversification or real export volume.
Sources
World Bank Data — Exports of goods and services (current US$)
Primary source for the numeric values, source years and indicator definition used in the ranking.
World Bank World Development Indicators
Official World Bank database used for internationally comparable national accounts and development indicators.
https://datatopics.worldbank.org/world-development-indicators/
World Bank API documentation
Reference for checking World Bank indicator-query structure and economy-year availability.
https://datahelpdesk.worldbank.org/knowledgebase/articles/898599-indicator-api-queries
World Integrated Trade Solution
Supporting context for trade-statistics terminology and World Bank trade-data tools. It is not used to replace WDI row values.
Related rankings
Closely related StatRanker pages selected by topic. If no strong match exists, fewer links are shown instead of unrelated recommendations.
