

Top 100 Countries by Mortality Attributable to Air Pollution per 100,000 People: 2026 Snapshot
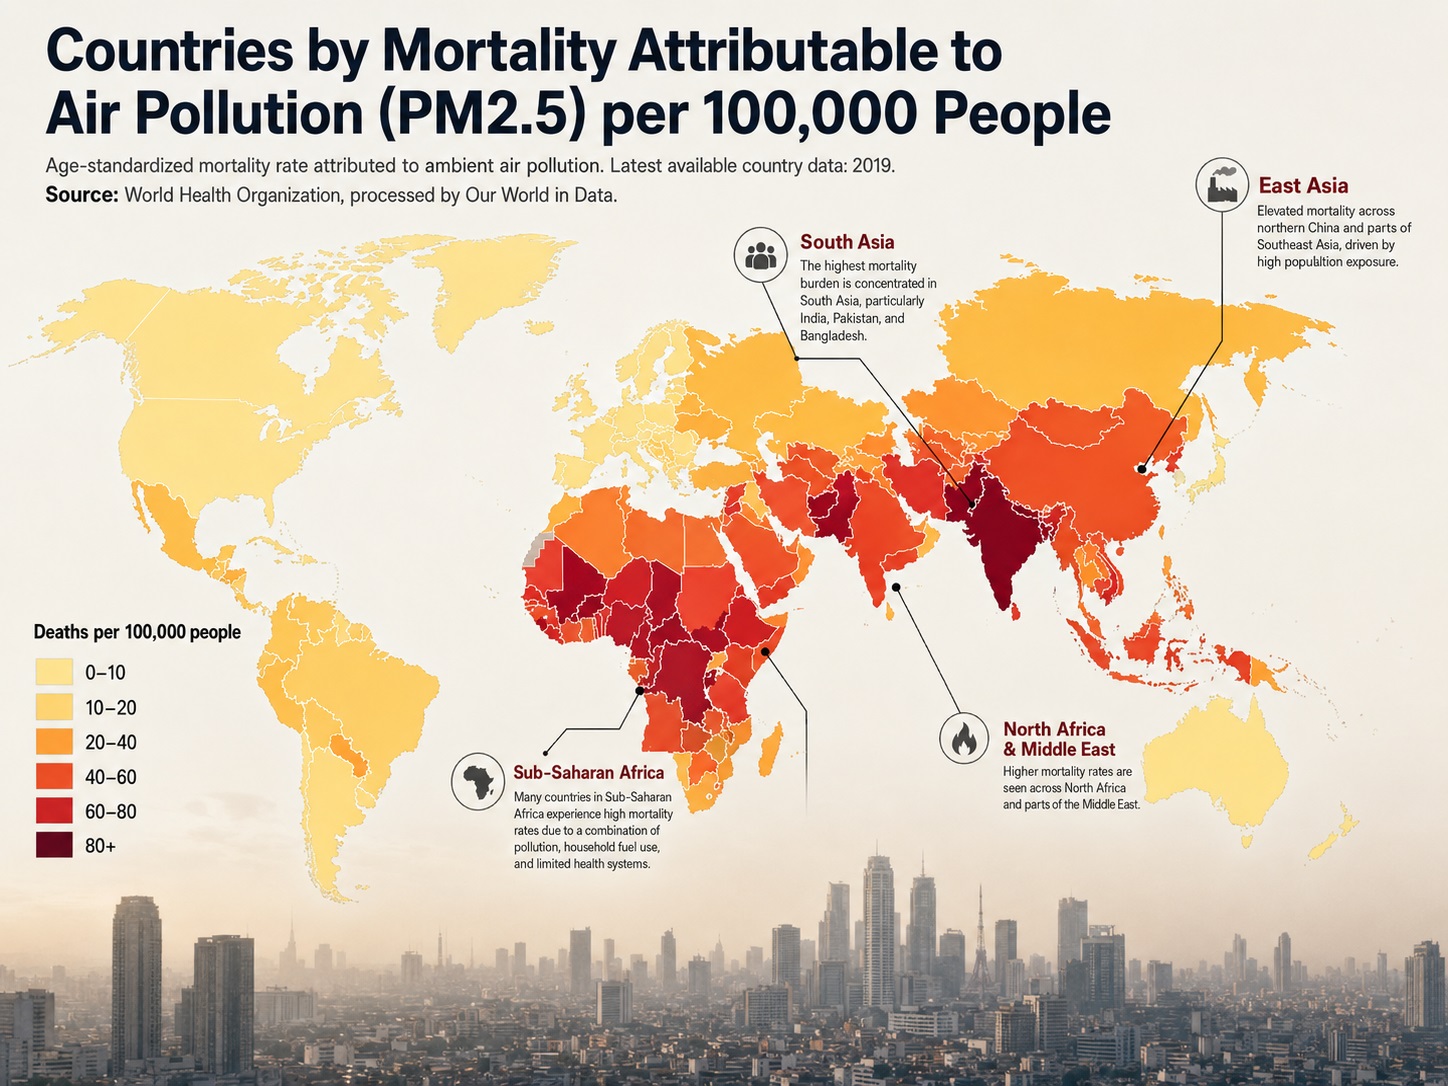
Air-pollution-attributable mortality by country: 2026 snapshot based on latest official 2019 WHO/World Bank data
This ranking compares countries by the age-standardized mortality rate attributed to household and ambient air pollution. The unit is deaths per 100,000 population, and the direction is descending: higher values mean a larger estimated mortality burden.
The numeric source is World Bank WDI indicator SH.STA.AIRP.P5, sourced from the WHO Global Health Observatory. The latest comparable country values in this series are 2019 estimates, so this is a 2026 snapshot based on latest official 2019 WHO/World Bank data, not an observed 2026 mortality release.
All 100 rows are official estimates. No official forecast rows and no modeled projection rows are included.
Central African Republic ranks first, measured as deaths per 100,000 population.
United Arab Emirates is the cutoff row in this Top 100 table.
Exactly 100 country rows are listed and ranked from highest to lowest.
All values use official 2019 WHO/World Bank estimates; no forecasts or projections are used.
Overview
The ranking measures a health burden, not air pollution concentration alone. A country’s rate can be high when pollution exposure, household energy conditions, background cardiovascular and respiratory disease burden, and health-system vulnerability combine into a large estimated mortality impact.
The upper part of the table is concentrated in Sub-Saharan Africa and several Pacific island states, with South Asia and parts of Central Asia also visible. This makes the table most useful as a public-health signal rather than a simple air-quality league table.
How to read this metric
A rate of 200 means an estimated 200 age-standardized deaths per 100,000 population are attributable to household and ambient air pollution under WHO methodology. Higher values indicate a larger mortality burden, not better performance.
What the rate means
The value is an estimated death rate per 100,000 people linked to air-pollution risk pathways, adjusted for age structure.
What it is not
It is not a PM2.5 concentration table, not a total death count, and not a direct count of deaths observed in 2026.
Why age-standardization matters
Age-standardization reduces distortion from different population age profiles, making country comparisons more meaningful.
Why countries differ
Exposure, household fuel use, disease patterns, baseline mortality and national data availability all affect the estimated burden.
Top 10 countries by air-pollution-attributable mortality rate
The Top 10 ranges from 305.1 to 237.9 deaths per 100,000 population. The group includes high-burden African countries, fragile settings and Pacific island states where exposure and health vulnerability produce very high attributable mortality rates.
Top 10, official 2019 estimates used as a 2026 snapshot
| Rank | Country | Rate | Note |
|---|---|---|---|
| 1 | Central African Republic | 305.1 | 2019 WHO/World Bank estimate; region note: Africa. |
| 2 | Lesotho | 288.3 | 2019 WHO/World Bank estimate; region note: Africa. |
| 3 | Solomon Islands | 281.2 | 2019 WHO/World Bank estimate; region note: Asia-Pacific. |
| 4 | Afghanistan | 265.7 | 2019 WHO/World Bank estimate; region note: South Asia. |
| 5 | Vanuatu | 259.9 | 2019 WHO/World Bank estimate; region note: Asia-Pacific. |
| 6 | Micronesia, Fed. Sts. | 254.0 | 2019 WHO/World Bank estimate; region note: Asia-Pacific. |
| 7 | Kiribati | 246.6 | 2019 WHO/World Bank estimate; region note: Asia-Pacific. |
| 8 | Sierra Leone | 239.0 | 2019 WHO/World Bank estimate; region note: Africa. |
| 9 | Guinea | 238.0 | 2019 WHO/World Bank estimate; region note: Africa. |
| 10 | Somalia, Fed. Rep. | 237.9 | 2019 WHO/World Bank estimate; region note: Africa. |
Unit: deaths per 100,000 population, age-standardized.
Chart: Top 20 by air-pollution-attributable mortality rate
The Top 20 shows a broad high-burden cluster rather than one isolated outlier. The first-ranked country is above 300 per 100,000, while the 20th-ranked country remains above 210 per 100,000.
Methodology
The metric is the age-standardized mortality rate attributed to household and ambient air pollution, expressed as deaths per 100,000 population. Ranking direction is descending: higher values indicate a larger estimated mortality burden. The numeric source is World Bank WDI indicator SH.STA.AIRP.P5, sourced from the WHO Global Health Observatory.
Metric and unit
Deaths attributable to household and ambient air pollution per 100,000 population, age-standardized.
Snapshot year
The page is a 2026 snapshot based on latest official 2019 WHO/World Bank country estimates. It is not an observed 2026 mortality release.
Ranking and ties
Countries are ranked from highest to lowest value. Where displayed one-decimal values are equal, the source order from the verified table is kept.
Included rows
The table includes the highest 100 country values available in the verified WDI/WHO series used for this page.
WHO estimates the burden through comparative risk assessment. The method links exposure to disease-specific relative risks, estimates the population-attributable fraction, and applies it to background disease burden. The disease outcomes described in WHO metadata include lower respiratory infections, stroke, ischemic heart disease, chronic obstructive pulmonary disease, and trachea, bronchus and lung cancers.
Values are displayed to one decimal place. The metric does not measure annual PM2.5 concentration, air-quality monitoring coverage, household fuel use alone, total deaths, or current 2026 conditions. It is an official modeled burden estimate, not a direct death-certificate count.
Full Top 100 ranking: 2026 snapshot based on latest official 2019 WHO/World Bank data
The table lists 100 countries by the age-standardized mortality rate attributed to household and ambient air pollution. Search and filters only change which confirmed rows are visible.
Top 100, official 2019 estimates used as a 2026 snapshot
| Rank | Country | Rate | Note |
|---|---|---|---|
| 1 | Central African Republic | 305.1 | 2019 WHO/World Bank estimate; region note: Africa. |
| 2 | Lesotho | 288.3 | 2019 WHO/World Bank estimate; region note: Africa. |
| 3 | Solomon Islands | 281.2 | 2019 WHO/World Bank estimate; region note: Asia-Pacific. |
| 4 | Afghanistan | 265.7 | 2019 WHO/World Bank estimate; region note: South Asia. |
| 5 | Vanuatu | 259.9 | 2019 WHO/World Bank estimate; region note: Asia-Pacific. |
| 6 | Micronesia, Fed. Sts. | 254.0 | 2019 WHO/World Bank estimate; region note: Asia-Pacific. |
| 7 | Kiribati | 246.6 | 2019 WHO/World Bank estimate; region note: Asia-Pacific. |
| 8 | Sierra Leone | 239.0 | 2019 WHO/World Bank estimate; region note: Africa. |
| 9 | Guinea | 238.0 | 2019 WHO/World Bank estimate; region note: Africa. |
| 10 | Somalia, Fed. Rep. | 237.9 | 2019 WHO/World Bank estimate; region note: Africa. |
| 11 | Eritrea | 237.4 | 2019 WHO/World Bank estimate; region note: Africa. |
| 12 | Guinea-Bissau | 228.8 | 2019 WHO/World Bank estimate; region note: Africa. |
| 13 | Mozambique | 228.4 | 2019 WHO/World Bank estimate; region note: Africa. |
| 14 | Chad | 227.4 | 2019 WHO/World Bank estimate; region note: Africa. |
| 15 | Sao Tome and Principe | 225.4 | 2019 WHO/World Bank estimate; region note: Africa. |
| 16 | Togo | 223.1 | 2019 WHO/World Bank estimate; region note: Africa. |
| 17 | Gambia, The | 220.5 | 2019 WHO/World Bank estimate; region note: Africa. |
| 18 | Mongolia | 214.7 | 2019 WHO/World Bank estimate; region note: Asia-Pacific. |
| 19 | Niger | 213.3 | 2019 WHO/World Bank estimate; region note: Africa. |
| 20 | Korea, Dem. People's Rep. | 212.8 | 2019 WHO/World Bank estimate; region note: Asia-Pacific. |
| 21 | Congo, Dem. Rep. | 209.8 | 2019 WHO/World Bank estimate; region note: Africa. |
| 22 | Madagascar | 208.0 | 2019 WHO/World Bank estimate; region note: Africa. |
| 23 | Cameroon | 206.7 | 2019 WHO/World Bank estimate; region note: Africa. |
| 24 | Haiti | 206.4 | 2019 WHO/World Bank estimate; region note: Americas. |
| 25 | Burundi | 205.9 | 2019 WHO/World Bank estimate; region note: Africa. |
| 26 | Tajikistan | 203.8 | 2019 WHO/World Bank estimate; region note: Europe & Central Asia. |
| 27 | Philippines | 202.8 | 2019 WHO/World Bank estimate; region note: Asia-Pacific. |
| 28 | Benin | 201.8 | 2019 WHO/World Bank estimate; region note: Africa. |
| 29 | Burkina Faso | 201.3 | 2019 WHO/World Bank estimate; region note: Africa. |
| 30 | Lao PDR | 195.3 | 2019 WHO/World Bank estimate; region note: Asia-Pacific. |
| 31 | Ghana | 193.6 | 2019 WHO/World Bank estimate; region note: Africa. |
| 32 | Pakistan | 192.1 | 2019 WHO/World Bank estimate; region note: South Asia. |
| 33 | Papua New Guinea | 189.6 | 2019 WHO/World Bank estimate; region note: Asia-Pacific. |
| 34 | Zimbabwe | 189.6 | 2019 WHO/World Bank estimate; region note: Africa. |
| 35 | Cote d'Ivoire | 186.5 | 2019 WHO/World Bank estimate; region note: Africa. |
| 36 | Yemen, Rep. | 186.3 | 2019 WHO/World Bank estimate; region note: Middle East & North Africa. |
| 37 | Timor-Leste | 185.6 | 2019 WHO/World Bank estimate; region note: Asia-Pacific. |
| 38 | Myanmar | 184.1 | 2019 WHO/World Bank estimate; region note: Asia-Pacific. |
| 39 | Djibouti | 177.9 | 2019 WHO/World Bank estimate; region note: Middle East & North Africa. |
| 40 | Nepal | 177.9 | 2019 WHO/World Bank estimate; region note: South Asia. |
| 41 | Zambia | 174.0 | 2019 WHO/World Bank estimate; region note: Africa. |
| 42 | Eswatini | 173.7 | 2019 WHO/World Bank estimate; region note: Africa. |
| 43 | Congo, Rep. | 170.4 | 2019 WHO/World Bank estimate; region note: Africa. |
| 44 | Mali | 167.1 | 2019 WHO/World Bank estimate; region note: Africa. |
| 45 | Rwanda | 165.8 | 2019 WHO/World Bank estimate; region note: Africa. |
| 46 | Equatorial Guinea | 165.7 | 2019 WHO/World Bank estimate; region note: Africa. |
| 47 | Nigeria | 165.2 | 2019 WHO/World Bank estimate; region note: Africa. |
| 48 | Comoros | 164.6 | 2019 WHO/World Bank estimate; region note: Africa. |
| 49 | Cambodia | 163.3 | 2019 WHO/World Bank estimate; region note: Asia-Pacific. |
| 50 | Uganda | 163.0 | 2019 WHO/World Bank estimate; region note: Africa. |
| 51 | Liberia | 152.7 | 2019 WHO/World Bank estimate; region note: Africa. |
| 52 | Uzbekistan | 151.7 | 2019 WHO/World Bank estimate; region note: Europe & Central Asia. |
| 53 | Malawi | 148.5 | 2019 WHO/World Bank estimate; region note: Africa. |
| 54 | Senegal | 146.4 | 2019 WHO/World Bank estimate; region note: Africa. |
| 55 | Samoa | 145.5 | 2019 WHO/World Bank estimate; region note: Asia-Pacific. |
| 56 | Sudan | 145.3 | 2019 WHO/World Bank estimate; region note: Africa. |
| 57 | Bangladesh | 143.9 | 2019 WHO/World Bank estimate; region note: South Asia. |
| 58 | Angola | 142.8 | 2019 WHO/World Bank estimate; region note: Africa. |
| 59 | Ethiopia | 142.5 | 2019 WHO/World Bank estimate; region note: Africa. |
| 60 | Namibia | 142.5 | 2019 WHO/World Bank estimate; region note: Africa. |
| 61 | Botswana | 140.7 | 2019 WHO/World Bank estimate; region note: Africa. |
| 62 | India | 139.3 | 2019 WHO/World Bank estimate; region note: South Asia. |
| 63 | South Sudan | 134.5 | 2019 WHO/World Bank estimate; region note: Africa. |
| 64 | Kenya | 131.9 | 2019 WHO/World Bank estimate; region note: Africa. |
| 65 | Mauritania | 128.4 | 2019 WHO/World Bank estimate; region note: Africa. |
| 66 | Tanzania | 128.3 | 2019 WHO/World Bank estimate; region note: Africa. |
| 67 | Azerbaijan | 125.2 | 2019 WHO/World Bank estimate; region note: Europe & Central Asia. |
| 68 | Kyrgyz Republic | 124.9 | 2019 WHO/World Bank estimate; region note: Europe & Central Asia. |
| 69 | Fiji | 118.7 | 2019 WHO/World Bank estimate; region note: Asia-Pacific. |
| 70 | Montenegro | 115.2 | 2019 WHO/World Bank estimate; region note: Europe & Central Asia. |
| 71 | Bosnia and Herzegovina | 113.9 | 2019 WHO/World Bank estimate; region note: Europe & Central Asia. |
| 72 | Honduras | 112.5 | 2019 WHO/World Bank estimate; region note: Americas. |
| 73 | Egypt, Arab Rep. | 105.6 | 2019 WHO/World Bank estimate; region note: Middle East & North Africa. |
| 74 | Oman | 104.0 | 2019 WHO/World Bank estimate; region note: Middle East & North Africa. |
| 75 | Viet Nam | 102.8 | 2019 WHO/World Bank estimate; region note: Asia-Pacific. |
| 76 | Indonesia | 96.1 | 2019 WHO/World Bank estimate; region note: Asia-Pacific. |
| 77 | Guyana | 95.7 | 2019 WHO/World Bank estimate; region note: Americas. |
| 78 | North Macedonia | 95.6 | 2019 WHO/World Bank estimate; region note: Europe & Central Asia. |
| 79 | China | 95.3 | 2019 WHO/World Bank estimate; region note: Asia-Pacific. |
| 80 | Syrian Arab Republic | 94.5 | 2019 WHO/World Bank estimate; region note: Middle East & North Africa. |
| 81 | Bhutan | 94.3 | 2019 WHO/World Bank estimate; region note: South Asia. |
| 82 | Georgia | 92.8 | 2019 WHO/World Bank estimate; region note: Europe & Central Asia. |
| 83 | Albania | 92.5 | 2019 WHO/World Bank estimate; region note: Europe & Central Asia. |
| 84 | Sri Lanka | 91.6 | 2019 WHO/World Bank estimate; region note: South Asia. |
| 85 | Cabo Verde | 91.2 | 2019 WHO/World Bank estimate; region note: Africa. |
| 86 | Saudi Arabia | 91.1 | 2019 WHO/World Bank estimate; region note: Middle East & North Africa. |
| 87 | Guatemala | 91.0 | 2019 WHO/World Bank estimate; region note: Americas. |
| 88 | Qatar | 90.8 | 2019 WHO/World Bank estimate; region note: Middle East & North Africa. |
| 89 | Iraq | 89.7 | 2019 WHO/World Bank estimate; region note: Middle East & North Africa. |
| 90 | Turkmenistan | 87.9 | 2019 WHO/World Bank estimate; region note: Europe & Central Asia. |
| 91 | Nicaragua | 84.4 | 2019 WHO/World Bank estimate; region note: Americas. |
| 92 | Kazakhstan | 83.4 | 2019 WHO/World Bank estimate; region note: Europe & Central Asia. |
| 93 | Ukraine | 78.9 | 2019 WHO/World Bank estimate; region note: Europe & Central Asia. |
| 94 | Gabon | 78.3 | 2019 WHO/World Bank estimate; region note: Africa. |
| 95 | Bolivia | 77.1 | 2019 WHO/World Bank estimate; region note: Americas. |
| 96 | Malaysia | 76.5 | 2019 WHO/World Bank estimate; region note: Asia-Pacific. |
| 97 | South Africa | 74.9 | 2019 WHO/World Bank estimate; region note: Africa. |
| 98 | Armenia | 74.5 | 2019 WHO/World Bank estimate; region note: Europe & Central Asia. |
| 99 | Serbia | 71.5 | 2019 WHO/World Bank estimate; region note: Europe & Central Asia. |
| 100 | United Arab Emirates | 70.0 | 2019 WHO/World Bank estimate; region note: Middle East & North Africa. |
Source note: World Bank WDI indicator SH.STA.AIRP.P5, sourced from WHO Global Health Observatory. Values are official 2019 estimates and are used here as a 2026 snapshot because no later comparable official country series is available in this WDI indicator.
Insights
Key insight
The highest value is 305.1 per 100,000, while the 100th row is still 70.0. The Top 100 therefore captures a broad high-burden group, not only a few extreme outliers.
Notable pattern
Africa is heavily represented in the upper half of the table. This reflects the combined role of exposure, household energy conditions, background disease burden and health-system vulnerability.
Regional concentration
Pacific island countries appear high in the ranking despite small populations. Rate-based burden metrics can be severe where exposure and disease risks are elevated, even where absolute death counts are smaller.
Outlier
Mongolia ranks 18th at 214.7 per 100,000, standing out in the Asia-Pacific group because winter heating, urban air episodes and cardiovascular mortality risks can combine into a high estimated burden.
What it means
A high rank should be read as a public-health risk signal, not as a simple measurement of dirty air alone. The rate combines air-pollution exposure with the health profile of the population and background mortality from diseases linked to air pollution.
For policy interpretation, this ranking sits at the intersection of air quality and health systems. It points to areas where cleaner household energy, industrial and transport emissions control, cardiovascular prevention, respiratory care and better air-quality monitoring can reinforce each other. PM2.5 concentration describes how polluted the air is, while attributable mortality estimates how much death burden is linked to exposure and related risk pathways.
Download the Top 100 Countries by Mortality Attributable to Air Pollution per 100,000 People: 2026 Snapshot dataset
Top 100 Countries by Mortality Attributable to Air Pollution per 100,000 People: 2026 Snapshot
100 ranked entries · Excel + CSV + methodology + sources + chart · Snapshot: 2019 WHO estimate / 2026 snapshot · Version 1.0
The archive includes machine-readable data, methodology and source documentation. Quick human verification is required before the ZIP is delivered. Full Data Pack downloads require a free account. Free accounts can download 1 different Data Pack every 30 days; re-downloading the same pack does not use another slot. Annual Data Access provides unlimited manual downloads while annual access is active.
Download Excel + CSV Data PackFAQ
Which country has the highest air-pollution-attributable mortality rate in this table?
Central African Republic ranks first, with an estimated 305.1 deaths per 100,000 population attributable to household and ambient air pollution in the official 2019 WHO/World Bank series.
Why does a 2026 snapshot use 2019 data?
The page is dated as a 2026 snapshot, but the latest comparable official country values in World Bank WDI indicator SH.STA.AIRP.P5 are 2019 estimates sourced from WHO GHO. The table does not claim observed 2026 mortality values.
Does this rate measure PM2.5 concentration?
No. The rate measures estimated mortality burden per 100,000 population. PM2.5 exposure is part of the air-pollution risk assessment, but the final value is an estimated death rate, not micrograms per cubic meter.
Why are age-standardized rates used?
Age-standardization reduces distortion from different population age structures. Without it, older countries could look worse simply because older populations have higher baseline risk of cardiovascular and respiratory death.
Why can a country with lower pollution still rank high?
The estimate depends on exposure, disease-specific relative risk, background mortality and population health conditions. A country can have a high attributable death rate if vulnerable diseases are common or health systems are weak.
Why are household and ambient air pollution combined?
The WDI indicator used here covers mortality attributed to household and ambient air pollution. WHO estimates the joint burden carefully because household pollution can also contribute to ambient exposure.
Can this table be used to compare air-quality policy performance?
It can support broad comparison, but it should not be the only measure. Policy performance should also be checked with PM2.5 concentration, clean household energy access, monitoring coverage, emissions trends and cause-specific health outcomes.
What are the main limitations?
The values are official modeled estimates, not direct death counts. They depend on exposure modeling, epidemiological risk functions, background mortality data, disease definitions and national data availability. They also do not show post-2019 changes.
Sources
World Bank WDI: SH.STA.AIRP.P5
Primary numeric source for the country values used in the ranking. The series is listed as mortality rate attributed to household and ambient air pollution, age-standardized, per 100,000 population.
WHO Global Health Observatory
Underlying official source for the air-pollution burden indicator and metadata on definition, estimation, age-standardization and included disease outcomes.
WHO metadata: household and ambient air pollution
Used to verify the metric definition, age-standardized rate interpretation and limitations for the joint household and ambient air-pollution burden indicator.
WHO metadata: ambient air pollution and PM2.5 exposure
Used for method context explaining how air-pollution disease burden combines relative-risk evidence with population exposure, including annual mean PM2.5 concentration for ambient air pollution.
Related rankings
Closely related StatRanker ranking and data pages selected by topic, entity scope and category. Fewer links are shown when strong matches are limited.
