

Top 100 Countries by Adult Obesity Rate: 2026 Snapshot Based on Latest WHO/NCD-RisC Data
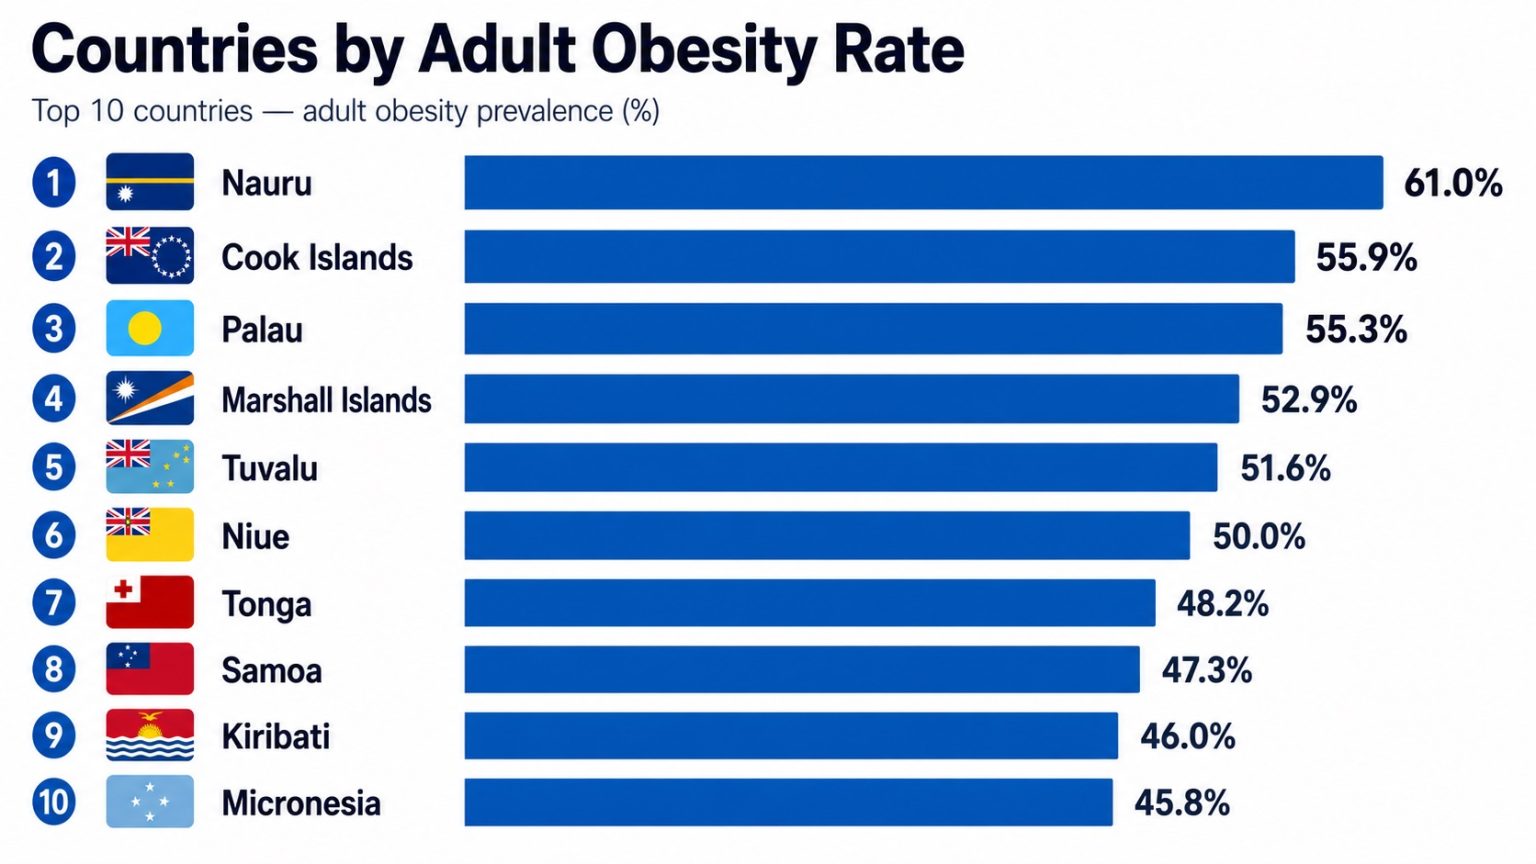
Adult Obesity Prevalence Ranking: 2026 Snapshot Based on 2022 NCD-RisC Estimates
This ranking compares countries and territories by adult obesity prevalence, defined as the age-standardized share of adults with a body mass index of at least 30 kg/m². The numeric values are 2022 estimates reproduced by the World Obesity Federation from NCD Risk Factor Collaboration data.
The table is a compiled research dataset based on 5 sources, with row-level source and method notes shown in the ranking table. The 2026 label is a page snapshot, not a 2026 measurement year. No 2026 country-level obesity prevalence values, official forecasts or modeled projections are mixed into the ranking.
Higher values rank higher because the metric measures prevalence burden. Lower adult obesity prevalence is generally preferable for public-health outcomes, but this ranking is not a policy-performance score and does not measure total adults living with obesity.
American Samoa is the highest confirmed entry in the combined adult obesity ranking.
Solomon Islands is the 100th row in the confirmed Top 100 subset.
2026 is the article snapshot; 2022 is the row-level estimate year.
100 official_value estimate rows, 0 official_forecast rows, 0 modeled_projection rows.
What the metric means
Adult obesity prevalence estimates the percentage of adults whose BMI is at least 30 kg/m². The indicator is age-standardized so that countries with different age structures can be compared more consistently. It is useful for understanding population-level prevalence, but it is not a direct measure of obesity-related disease burden or healthcare performance.
How to read the rank
A higher rank means a higher adult obesity prevalence estimate. The ranking is ordered by the 2022 value from highest to lowest.
Why there is a 2026 column
The 2026 column clarifies the snapshot status. It does not show a fabricated 2026 percentage because no verified 2026 country-level values are used.
What the metric excludes
BMI-based prevalence does not measure body composition, metabolic health, obesity severity, treatment access, diet quality or policy effectiveness.
Why values differ
Differences can reflect food systems, income transitions, urban form, physical activity environments, import dependence, inequality and measurement uncertainty.
- Metric: adult obesity prevalence, BMI ≥ 30 kg/m², combined-sex estimate.
- Unit: percent of adults.
- Numeric year: 2022 in every row of the ranking table.
- Snapshot label: 2026 publication snapshot using confirmed 2022 estimates.
- Direction: descending; higher values indicate a larger prevalence burden.
- Projection rule: no 2026 modeled values are included.
Top 10 countries and territories by adult obesity prevalence
The upper end of the ranking is strongly concentrated in Pacific island countries and territories. The Top 10 range from 75.92% in American Samoa to 48.19% in the Federated States of Micronesia, and the first eight entries are all above 60%.
Top 10 confirmed entries by adult obesity prevalence, 2026 snapshot using 2022 combined-adult estimates
| Rank | Entity | 2022 estimate | 2026 status | Source / Method Note |
|---|---|---|---|---|
| 1 | American Samoa | 75.92% | Uses 2022 estimate | official_value; WOF/NCD-RisC; high income. |
| 2 | Tonga | 72.35% | Uses 2022 estimate | official_value; WOF/NCD-RisC; upper-middle income. |
| 3 | Nauru | 71.06% | Uses 2022 estimate | official_value; WOF/NCD-RisC; high income. |
| 4 | Tokelau | 71.02% | Uses 2022 estimate | official_value; WOF/NCD-RisC; income group not shown. |
| 5 | Cook Islands | 69.58% | Uses 2022 estimate | official_value; WOF/NCD-RisC; income group not shown. |
| 6 | Niue | 67.27% | Uses 2022 estimate | official_value; WOF/NCD-RisC; income group not shown. |
| 7 | Tuvalu | 65.25% | Uses 2022 estimate | official_value; WOF/NCD-RisC; upper-middle income. |
| 8 | Samoa | 63.67% | Uses 2022 estimate | official_value; WOF/NCD-RisC; upper-middle income. |
| 9 | French Polynesia | 49.00% | Uses 2022 estimate | official_value; WOF/NCD-RisC; high income. |
| 10 | Federated States of Micronesia | 48.19% | Uses 2022 estimate | official_value; WOF/NCD-RisC; lower-middle income. |
Table note: the 2026 column is an interpretation column. The percentage itself is the 2022 estimate, not a 2026 measurement or projection.
Chart: Top 20 confirmed 2022 adult obesity prevalence estimates
The Top 20 chart shows the steep upper tail of the ranking. Eight entries are above 60%, while the 20th entry, Saudi Arabia, is 42.45%. The chart uses the same 2022 values as the ranking table.
Methodology
The ranking metric is adult obesity prevalence: the age-standardized percentage of adults with BMI ≥ 30 kg/m². The numeric values come from the World Obesity Federation ranking table for adult obesity by country and territory, which reproduces NCD Risk Factor Collaboration estimates for combined adults in 2022.
Metric, unit and direction
Metric: adult obesity prevalence. Unit: percent of adults. Direction: descending, so higher prevalence ranks higher.
Numeric year and snapshot year
Every numeric value is a 2022 estimate. The 2026 label identifies the page snapshot, not a separate 2026 measurement.
Source hierarchy
Primary numeric source: World Obesity Federation table based on NCD-RisC. Context sources: NCD-RisC downloads, Lancet article, WHO metadata and WOF ranking pages.
Status definitions
official_value means a published international-source estimate. It does not mean a separate national government statistic for every row.
Forecast handling
No 2025 or 2026 country-level forecast rows are included. No modeled_projection rows are calculated from trend assumptions.
Rounding and ties
Values are shown to two decimals. Equal or near-equal values remain separate rows and the source order is preserved unless the table controls are used.
Inclusion is limited to the highest 100 confirmed rows in the 200-entry source table. Missing income group labels are shown as “income group not shown” instead of being filled from another source. The table does not mix adult and child obesity, male and female subtables, projected 2030 values, national survey years, absolute counts or disease-burden measures.
The metric is useful for comparing population prevalence, but it does not measure total population burden, body composition, obesity severity, diabetes prevalence, cardiovascular risk, healthcare quality, treatment access, food prices, physical activity or policy effectiveness.
Full ranking: Top 100 adult obesity prevalence estimates
The table lists the highest 100 confirmed entries from the 200-entry World Obesity Federation table. The “2022 estimate” column contains the numeric value used for rank. The “2026 status” column prevents confusion: each row is part of a 2026 page snapshot, but the percentage remains a 2022 estimate.
Top 100 confirmed entries by adult obesity prevalence, 2026 snapshot using 2022 combined-adult estimates
| Rank | Entity | 2022 estimate | 2026 status | Source / Method Note |
|---|---|---|---|---|
| 1 | American Samoa | 75.92% | Uses 2022 estimate | official_value; WOF/NCD-RisC; high income. |
| 2 | Tonga | 72.35% | Uses 2022 estimate | official_value; WOF/NCD-RisC; upper-middle income. |
| 3 | Nauru | 71.06% | Uses 2022 estimate | official_value; WOF/NCD-RisC; high income. |
| 4 | Tokelau | 71.02% | Uses 2022 estimate | official_value; WOF/NCD-RisC; income group not shown. |
| 5 | Cook Islands | 69.58% | Uses 2022 estimate | official_value; WOF/NCD-RisC; income group not shown. |
| 6 | Niue | 67.27% | Uses 2022 estimate | official_value; WOF/NCD-RisC; income group not shown. |
| 7 | Tuvalu | 65.25% | Uses 2022 estimate | official_value; WOF/NCD-RisC; upper-middle income. |
| 8 | Samoa | 63.67% | Uses 2022 estimate | official_value; WOF/NCD-RisC; upper-middle income. |
| 9 | French Polynesia | 49.00% | Uses 2022 estimate | official_value; WOF/NCD-RisC; high income. |
| 10 | Federated States of Micronesia | 48.19% | Uses 2022 estimate | official_value; WOF/NCD-RisC; lower-middle income. |
| 11 | Bahamas | 48.15% | Uses 2022 estimate | official_value; WOF/NCD-RisC; high income. |
| 12 | Marshall Islands | 47.11% | Uses 2022 estimate | official_value; WOF/NCD-RisC; upper-middle income. |
| 13 | Kiribati | 46.89% | Uses 2022 estimate | official_value; WOF/NCD-RisC; lower-middle income. |
| 14 | Saint Kitts and Nevis | 46.65% | Uses 2022 estimate | official_value; WOF/NCD-RisC; high income. |
| 15 | Egypt | 45.59% | Uses 2022 estimate | official_value; WOF/NCD-RisC; lower-middle income. |
| 16 | Kuwait | 44.43% | Uses 2022 estimate | official_value; WOF/NCD-RisC; high income. |
| 17 | Qatar | 44.00% | Uses 2022 estimate | official_value; WOF/NCD-RisC; high income. |
| 18 | Belize | 43.29% | Uses 2022 estimate | official_value; WOF/NCD-RisC; upper-middle income. |
| 19 | United States | 42.74% | Uses 2022 estimate | official_value; WOF/NCD-RisC; high income. |
| 20 | Saudi Arabia | 42.45% | Uses 2022 estimate | official_value; WOF/NCD-RisC; high income. |
| 21 | Palau | 42.08% | Uses 2022 estimate | official_value; WOF/NCD-RisC; high income. |
| 22 | Puerto Rico | 42.05% | Uses 2022 estimate | official_value; WOF/NCD-RisC; high income. |
| 23 | Iraq | 41.41% | Uses 2022 estimate | official_value; WOF/NCD-RisC; upper-middle income. |
| 24 | Jordan | 39.93% | Uses 2022 estimate | official_value; WOF/NCD-RisC; lower-middle income. |
| 25 | Chile | 39.67% | Uses 2022 estimate | official_value; WOF/NCD-RisC; high income. |
| 26 | Barbados | 38.90% | Uses 2022 estimate | official_value; WOF/NCD-RisC; high income. |
| 27 | Palestine | 38.52% | Uses 2022 estimate | official_value; WOF/NCD-RisC; lower-middle income. |
| 28 | Libya | 37.91% | Uses 2022 estimate | official_value; WOF/NCD-RisC; upper-middle income. |
| 29 | Bahrain | 37.25% | Uses 2022 estimate | official_value; WOF/NCD-RisC; high income. |
| 30 | Panama | 37.06% | Uses 2022 estimate | official_value; WOF/NCD-RisC; high income. |
| 31 | Mexico | 36.86% | Uses 2022 estimate | official_value; WOF/NCD-RisC; upper-middle income. |
| 32 | Argentina | 36.39% | Uses 2022 estimate | official_value; WOF/NCD-RisC; upper-middle income. |
| 33 | Georgia | 35.47% | Uses 2022 estimate | official_value; WOF/NCD-RisC; upper-middle income. |
| 34 | Romania | 35.04% | Uses 2022 estimate | official_value; WOF/NCD-RisC; high income. |
| 35 | Fiji | 34.90% | Uses 2022 estimate | official_value; WOF/NCD-RisC; upper-middle income. |
| 36 | Syrian Arab Republic | 34.70% | Uses 2022 estimate | official_value; WOF/NCD-RisC; low income. |
| 37 | Jamaica | 34.54% | Uses 2022 estimate | official_value; WOF/NCD-RisC; upper-middle income. |
| 38 | Nicaragua | 34.54% | Uses 2022 estimate | official_value; WOF/NCD-RisC; lower-middle income. |
| 39 | Turkey | 34.40% | Uses 2022 estimate | official_value; WOF/NCD-RisC; upper-middle income. |
| 40 | New Zealand | 34.28% | Uses 2022 estimate | official_value; WOF/NCD-RisC; high income. |
| 41 | Uruguay | 34.23% | Uses 2022 estimate | official_value; WOF/NCD-RisC; high income. |
| 42 | Saint Lucia | 34.15% | Uses 2022 estimate | official_value; WOF/NCD-RisC; upper-middle income. |
| 43 | Saint Vincent and the Grenadines | 34.11% | Uses 2022 estimate | official_value; WOF/NCD-RisC; upper-middle income. |
| 44 | Antigua and Barbuda | 34.02% | Uses 2022 estimate | official_value; WOF/NCD-RisC; high income. |
| 45 | Bermuda | 33.96% | Uses 2022 estimate | official_value; WOF/NCD-RisC; high income. |
| 46 | Paraguay | 33.95% | Uses 2022 estimate | official_value; WOF/NCD-RisC; upper-middle income. |
| 47 | Malta | 32.84% | Uses 2022 estimate | official_value; WOF/NCD-RisC; high income. |
| 48 | United Arab Emirates | 32.63% | Uses 2022 estimate | official_value; WOF/NCD-RisC; high income. |
| 49 | Hungary | 32.53% | Uses 2022 estimate | official_value; WOF/NCD-RisC; high income. |
| 50 | Oman | 32.44% | Uses 2022 estimate | official_value; WOF/NCD-RisC; high income. |
| 51 | Costa Rica | 32.29% | Uses 2022 estimate | official_value; WOF/NCD-RisC; high income. |
| 52 | Dominica | 32.15% | Uses 2022 estimate | official_value; WOF/NCD-RisC; upper-middle income. |
| 53 | Brunei Darussalam | 32.09% | Uses 2022 estimate | official_value; WOF/NCD-RisC; high income. |
| 54 | Croatia | 31.44% | Uses 2022 estimate | official_value; WOF/NCD-RisC; high income. |
| 55 | South Africa | 31.35% | Uses 2022 estimate | official_value; WOF/NCD-RisC; upper-middle income. |
| 56 | El Salvador | 31.31% | Uses 2022 estimate | official_value; WOF/NCD-RisC; upper-middle income. |
| 57 | Grenada | 31.12% | Uses 2022 estimate | official_value; WOF/NCD-RisC; upper-middle income. |
| 58 | Australia | 31.02% | Uses 2022 estimate | official_value; WOF/NCD-RisC; high income. |
| 59 | Uzbekistan | 31.02% | Uses 2022 estimate | official_value; WOF/NCD-RisC; lower-middle income. |
| 60 | Lebanon | 30.72% | Uses 2022 estimate | official_value; WOF/NCD-RisC; lower-middle income. |
| 61 | Eswatini | 30.64% | Uses 2022 estimate | official_value; WOF/NCD-RisC; lower-middle income. |
| 62 | Honduras | 30.31% | Uses 2022 estimate | official_value; WOF/NCD-RisC; lower-middle income. |
| 63 | Dominican Republic | 30.25% | Uses 2022 estimate | official_value; WOF/NCD-RisC; upper-middle income. |
| 64 | Seychelles | 30.19% | Uses 2022 estimate | official_value; WOF/NCD-RisC; high income. |
| 65 | Suriname | 29.81% | Uses 2022 estimate | official_value; WOF/NCD-RisC; upper-middle income. |
| 66 | Bolivia | 29.48% | Uses 2022 estimate | official_value; WOF/NCD-RisC; lower-middle income. |
| 67 | Ireland | 29.27% | Uses 2022 estimate | official_value; WOF/NCD-RisC; high income. |
| 68 | Guyana | 28.96% | Uses 2022 estimate | official_value; WOF/NCD-RisC; high income. |
| 69 | Trinidad and Tobago | 28.90% | Uses 2022 estimate | official_value; WOF/NCD-RisC; high income. |
| 70 | Brazil | 28.89% | Uses 2022 estimate | official_value; WOF/NCD-RisC; upper-middle income. |
| 71 | Greece | 28.85% | Uses 2022 estimate | official_value; WOF/NCD-RisC; high income. |
| 72 | North Macedonia | 28.41% | Uses 2022 estimate | official_value; WOF/NCD-RisC; upper-middle income. |
| 73 | Ecuador | 28.28% | Uses 2022 estimate | official_value; WOF/NCD-RisC; upper-middle income. |
| 74 | Poland | 28.28% | Uses 2022 estimate | official_value; WOF/NCD-RisC; high income. |
| 75 | Peru | 28.12% | Uses 2022 estimate | official_value; WOF/NCD-RisC; upper-middle income. |
| 76 | Tunisia | 27.71% | Uses 2022 estimate | official_value; WOF/NCD-RisC; lower-middle income. |
| 77 | United Kingdom | 27.63% | Uses 2022 estimate | official_value; WOF/NCD-RisC; high income. |
| 78 | Greenland | 27.58% | Uses 2022 estimate | official_value; WOF/NCD-RisC; high income. |
| 79 | Guatemala | 27.57% | Uses 2022 estimate | official_value; WOF/NCD-RisC; upper-middle income. |
| 80 | Slovakia | 27.57% | Uses 2022 estimate | official_value; WOF/NCD-RisC; high income. |
| 81 | Azerbaijan | 27.33% | Uses 2022 estimate | official_value; WOF/NCD-RisC; upper-middle income. |
| 82 | Czechia | 26.85% | Uses 2022 estimate | official_value; WOF/NCD-RisC; high income. |
| 83 | Kyrgyzstan | 26.83% | Uses 2022 estimate | official_value; WOF/NCD-RisC; lower-middle income. |
| 84 | Canada | 26.73% | Uses 2022 estimate | official_value; WOF/NCD-RisC; high income. |
| 85 | Lithuania | 26.02% | Uses 2022 estimate | official_value; WOF/NCD-RisC; high income. |
| 86 | Iran | 25.08% | Uses 2022 estimate | official_value; WOF/NCD-RisC; upper-middle income. |
| 87 | Armenia | 25.06% | Uses 2022 estimate | official_value; WOF/NCD-RisC; upper-middle income. |
| 88 | Latvia | 24.85% | Uses 2022 estimate | official_value; WOF/NCD-RisC; high income. |
| 89 | Mongolia | 24.82% | Uses 2022 estimate | official_value; WOF/NCD-RisC; upper-middle income. |
| 90 | Russian Federation | 24.77% | Uses 2022 estimate | official_value; WOF/NCD-RisC; high income. |
| 91 | Tajikistan | 24.64% | Uses 2022 estimate | official_value; WOF/NCD-RisC; lower-middle income. |
| 92 | Algeria | 24.56% | Uses 2022 estimate | official_value; WOF/NCD-RisC; upper-middle income. |
| 93 | Ukraine | 24.41% | Uses 2022 estimate | official_value; WOF/NCD-RisC; upper-middle income. |
| 94 | Colombia | 24.33% | Uses 2022 estimate | official_value; WOF/NCD-RisC; upper-middle income. |
| 95 | Albania | 24.31% | Uses 2022 estimate | official_value; WOF/NCD-RisC; upper-middle income. |
| 96 | Pakistan | 23.69% | Uses 2022 estimate | official_value; WOF/NCD-RisC; lower-middle income. |
| 97 | Moldova | 23.68% | Uses 2022 estimate | official_value; WOF/NCD-RisC; upper-middle income. |
| 98 | Cyprus | 23.55% | Uses 2022 estimate | official_value; WOF/NCD-RisC; high income. |
| 99 | Venezuela | 23.33% | Uses 2022 estimate | official_value; WOF/NCD-RisC; income group not shown. |
| 100 | Solomon Islands | 23.29% | Uses 2022 estimate | official_value; WOF/NCD-RisC; lower-middle income. |
Source snapshot: World Obesity Federation adult ranking table based on NCD-RisC estimates. The underlying estimates are for 2022. The 2026 column identifies how the row is used in this page snapshot.
Insights from the Top 100
Key insight
The highest prevalence estimates are concentrated in small island states and territories, especially in the Pacific, where the first eight rows are all above 60%.
Notable pattern
The ranking then shifts toward the Gulf, the Caribbean, parts of the Americas, North Africa and selected European countries rather than one single region.
Source concentration
All numeric values come from the same international estimate series, which keeps the ranking comparable and avoids mixing survey years or national definitions.
Outlier
The United States ranks 19th with 42.74%, making it the highest large high-income economy in the published Top 20 subset.
The gap between rank 8 and rank 9 is especially large: Samoa is listed at 63.67%, while French Polynesia is listed at 49.00%. That break shows a very steep upper tail rather than a smooth decline across the first ten rows.
What this ranking means
This ranking is best read as a prevalence-burden comparison. It shows where the share of adults living with obesity is highest, not where the total number of adults with obesity is largest. A small territory can rank very high by percentage while having far fewer affected people than a large country with a lower percentage.
The difference between the 2022 estimate and the 2026 snapshot matters for interpretation. The table is useful for a 2026 article because it uses confirmed public row-level estimates, but it should not be quoted as a measured 2026 obesity rate.
Public-health readers should combine this metric with diabetes prevalence, cardiovascular risk, income, food prices, urban design, physical activity, healthcare access and demographic structure before drawing policy conclusions.
Download the Top 100 Countries by Adult Obesity Rate: 2026 Snapshot Based on Latest WHO/NCD-RisC Data dataset
Top 100 Countries by Adult Obesity Rate: 2026 Snapshot Based on Latest WHO/NCD-RisC Data
100 ranked entries · Excel + CSV + methodology + sources + chart · Snapshot: 2026 snapshot; 2022 estimate year · Version 1.0
The archive includes machine-readable data, methodology and source documentation. Quick human verification is required before the ZIP is delivered. Full Data Pack downloads require a free account. Free accounts can download 1 different Data Pack every 30 days; re-downloading the same pack does not use another slot. Annual Data Access provides unlimited manual downloads while annual access is active.
Download Excel + CSV Data PackFAQ
Is this a 2022 ranking or a 2026 ranking?
It is a 2026 snapshot page using 2022 numeric estimates. The rank is calculated from the 2022 prevalence values, and the 2026 column explains that the row is carried into the snapshot without a new 2026 value.
Why not add a numeric 2026 obesity column?
A numeric 2026 country column would require verified 2026 values or a documented projection model with base year, formula, growth assumptions and sources. This table does not use such a model, so no 2026 percentages are invented.
Which country or territory ranks first?
American Samoa ranks first in the confirmed Top 100 subset with a 2022 adult obesity prevalence estimate of 75.92%.
Does a higher rank mean worse public health?
A higher rank means a higher obesity prevalence burden. It is a warning indicator, but it is not a complete public-health score because it does not measure treatment access, metabolic outcomes, diet quality or policy performance.
Does this measure total adults living with obesity?
No. The table ranks percentages, not absolute counts. Large countries can have far more adults living with obesity even if their prevalence rate is lower.
Are men, women and children mixed in the same table?
No. The ranking table uses combined adult estimates only. It does not mix the male table, female table, children’s obesity estimates or projection tables.
Why do some rows say “income group not shown”?
The source table does not display an income group for those entries. The value is left as not shown instead of being filled from a separate source.
Sources
World Obesity Federation — Ranking by country, adults
Primary row-level numeric source for country and territory adult obesity prevalence estimates.
https://data.worldobesity.org/tables/ranking-obesity-by-country-adults-1.pdf
World Obesity Federation — Global Obesity Observatory rankings
Source environment for the public ranking table and related obesity data views.
NCD Risk Factor Collaboration — Adiposity data downloads
Underlying international research data source for the adult obesity estimates reproduced in the ranking.
The Lancet — Worldwide trends in underweight and obesity, 1990 to 2022
Scientific and methodological context for the NCD-RisC estimates.
World Health Organization — Obesity and overweight
General definition context for BMI thresholds and obesity as a public-health indicator.
https://www.who.int/news-room/fact-sheets/detail/obesity-and-overweight
Related rankings
Closely related StatRanker ranking and data pages selected by topic, entity scope and category. Fewer links are shown when strong matches are limited.
