


US States by EV Chargers per 100,000 People
Where Public EV Charging Is Most Available per Resident
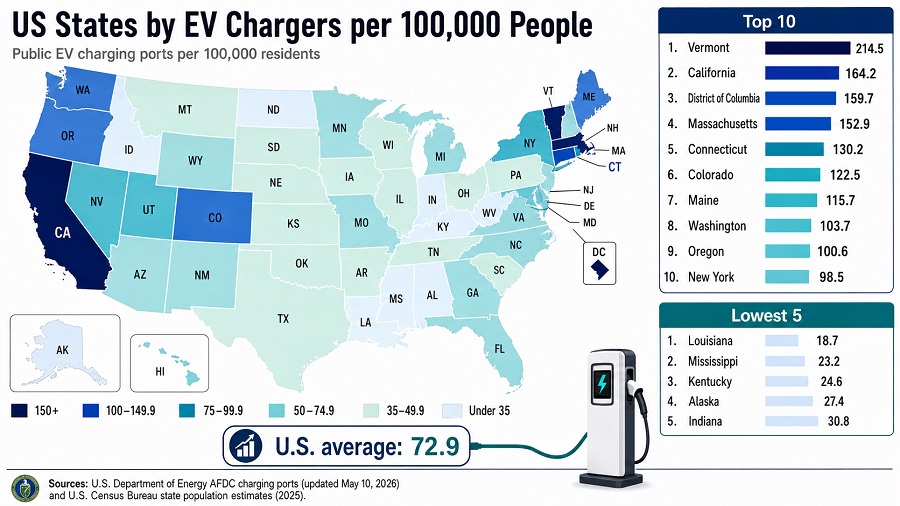
Public charging access varies sharply across the United States. This ranking compares 50 states and the District of Columbia by the number of public EV charging ports available for every 100,000 residents.
Thank you for reading this post, don't forget to subscribe!Vermont leads the list with 215.9 public ports per 100,000 residents. California ranks second by density and first by scale, with 64,673 public ports. Louisiana has the lowest density in this dataset at 18.5 ports per 100,000 residents.
The ranking uses public charging ports, not station locations. A single station can contain several ports, so port count is closer to actual charging capacity.
Continue exploring
More StatRanker pages connected by topic, category or ranking theme.
Vehicle Theft Rate by Country (per 100,000 People): Global Comparison, 2025 Edition
Open rankingTop 100 Countries by Passenger Car Ownership per 1,000 People, 2025
Open rankingKey figures
Vermont has the densest public charging network relative to population.
California accounts for 26.10% of all public EV charging ports in this dataset.
The national weighted average is about 72.5 public ports per 100,000 residents.
Louisiana is last by this measure, with fewer than 20 public ports per 100,000 residents.
Overview
The top of the ranking is not defined by one pattern. Vermont, Massachusetts, Connecticut and Maine benefit from smaller populations and compact networks. California is different: it combines very large scale with high per-resident availability. The District of Columbia also ranks near the top because a dense urban network serves a small jurisdiction.
The West Coast performs strongly. California, Washington and Oregon all appear in the top 10, showing that public charging density is not limited to small northeastern states.
Large Sun Belt states show the gap between total infrastructure and per-capita density. Florida, Texas, Georgia, North Carolina and Arizona all have substantial public networks, but their large populations lower their rank on a resident-adjusted basis.
Top 10 jurisdictions by public EV charging density
The highest-density jurisdictions are ranked by public charging ports per 100,000 residents.
| Rank | State or jurisdiction | Ports per 100,000 residents | Public ports |
|---|---|---|---|
| 1 | Vermont | 215.9 | 1,392 |
| 2 | California | 164.3 | 64,673 |
| 3 | District of Columbia | 162.8 | 1,129 |
| 4 | Massachusetts | 152.3 | 10,899 |
| 5 | Connecticut | 129.9 | 4,791 |
| 6 | Colorado | 123.4 | 7,418 |
| 7 | Maine | 115.3 | 1,631 |
| 8 | Washington | 105.3 | 8,428 |
| 9 | Oregon | 100.4 | 4,289 |
| 10 | New York | 97.9 | 19,587 |
Table based on DOE AFDC public charging-port counts updated May 7, 2026 and Census resident population estimates for July 1, 2025.
Chart: Top 10 by charging ports per resident
Vermont has a clear lead, while California and the District of Columbia form a second high-density tier above 160 public ports per 100,000 residents.
Full ranking of 50 states and DC
Use the controls to search, filter by region, change the visible range, or switch the value column from density to share of all US public ports.
| Rank | State or jurisdiction | Ports per 100,000 residents | Public charging ports |
|---|---|---|---|
| 1 | VermontNortheast | 215.90.56% | 1,392 |
| 2 | CaliforniaWest | 164.326.10% | 64,673 |
| 3 | District of ColumbiaSouth | 162.80.46% | 1,129 |
| 4 | MassachusettsNortheast | 152.34.40% | 10,899 |
| 5 | ConnecticutNortheast | 129.91.93% | 4,791 |
| 6 | ColoradoWest | 123.42.99% | 7,418 |
| 7 | MaineNortheast | 115.30.66% | 1,631 |
| 8 | WashingtonWest | 105.33.40% | 8,428 |
| 9 | OregonWest | 100.41.73% | 4,289 |
| 10 | New YorkNortheast | 97.97.91% | 19,587 |
| 11 | MarylandSouth | 87.32.21% | 5,472 |
| 12 | UtahWest | 84.61.21% | 2,994 |
| 13 | NevadaWest | 81.91.08% | 2,688 |
| 14 | Rhode IslandNortheast | 75.20.34% | 838 |
| 15 | DelawareSouth | 69.40.30% | 736 |
| 16 | HawaiiWest | 69.00.40% | 989 |
| 17 | GeorgiaSouth | 66.23.02% | 7,488 |
| 18 | New JerseyNortheast | 63.62.45% | 6,074 |
| 19 | FloridaSouth | 62.75.94% | 14,718 |
| 20 | VirginiaSouth | 61.52.20% | 5,462 |
| 21 | ArizonaWest | 60.61.86% | 4,618 |
| 22 | WyomingWest | 57.10.14% | 336 |
| 23 | New HampshireNortheast | 56.50.32% | 799 |
| 24 | New MexicoWest | 55.80.48% | 1,185 |
| 25 | MinnesotaMidwest | 54.91.29% | 3,201 |
| 26 | MichiganMidwest | 53.92.20% | 5,455 |
| 27 | MissouriMidwest | 52.41.33% | 3,287 |
| 28 | North CarolinaSouth | 51.62.33% | 5,773 |
| 29 | KansasMidwest | 45.00.54% | 1,339 |
| 30 | OhioMidwest | 44.32.13% | 5,270 |
| 31 | IllinoisMidwest | 44.22.27% | 5,618 |
| 32 | PennsylvaniaNortheast | 43.82.31% | 5,720 |
| 33 | MontanaWest | 41.80.19% | 478 |
| 34 | TennesseeSouth | 41.71.23% | 3,053 |
| 35 | OklahomaSouth | 39.80.66% | 1,642 |
| 36 | IowaMidwest | 39.70.52% | 1,285 |
| 37 | WisconsinMidwest | 38.70.93% | 2,313 |
| 38 | TexasSouth | 38.54.92% | 12,199 |
| 39 | South CarolinaSouth | 37.80.85% | 2,105 |
| 40 | South DakotaMidwest | 36.80.14% | 344 |
| 41 | NebraskaMidwest | 36.20.29% | 730 |
| 42 | ArkansasSouth | 35.30.44% | 1,099 |
| 43 | North DakotaMidwest | 34.80.11% | 278 |
| 44 | IdahoWest | 33.20.27% | 674 |
| 45 | AlabamaSouth | 33.10.69% | 1,721 |
| 46 | West VirginiaSouth | 31.80.23% | 562 |
| 47 | IndianaMidwest | 30.50.86% | 2,124 |
| 48 | AlaskaWest | 27.00.08% | 199 |
| 49 | KentuckySouth | 24.30.45% | 1,118 |
| 50 | MississippiSouth | 23.10.28% | 683 |
| 51 | LouisianaSouth | 18.50.35% | 856 |
Calculation: public EV charging ports divided by resident population, multiplied by 100,000. Share is based on 247,760 total public ports in the AFDC May 7, 2026 inventory.
Methodology
The ranking is calculated as public EV charging ports divided by resident population and multiplied by 100,000. This creates a resident-adjusted density measure that can be compared across states of different sizes.
Charging-port counts come from the US Department of Energy Alternative Fuels Data Center public access station table, updated May 7, 2026. Population values come from the US Census Bureau Vintage 2025 resident population estimates for July 1, 2025.
Values are rounded to one decimal place for density and two decimal places for share of total US public ports. The data is an infrastructure inventory paired with official population estimates. It is not a forecast and should not be read as a final annual 2026 statistic.
The measure does not show charger speed, uptime, connector type, price, queueing, site quality, neighborhood distribution, home charging, workplace charging or fleet-only infrastructure. It is best used as a first view of public charging capacity relative to population.
Insights
- Small states can lead on density. Vermont does not have the largest network, but its 1,392 ports serve a relatively small population.
- California is the large-state exception. It has the country’s largest public network and still ranks second on a per-resident basis.
- The Northeast is strongly represented. Several compact northeastern states sit in the upper half of the ranking.
- The West Coast performs well as a region. California, Washington and Oregon all place in the top 10.
- Population size changes the story. Texas has more than 12,000 public ports, yet ranks 38th because of its large resident base.
- Low density does not explain every driver experience. Rural travel patterns, home charging, corridor coverage and local EV adoption can change how charging access feels on the ground.
What it means for readers
For EV owners, public port density gives a quick sense of how much visible charging infrastructure exists around a state’s population. It is not a guarantee of fast or reliable charging, but it helps compare basic public availability.
For buyers, the ranking can support a broader check before switching to an EV. A high-density state usually offers more public backup options, while a lower-density state may require more reliance on home charging or careful route planning.
For planners and investors, the table separates network size from network density. States with many ports can still need additional deployment if population-adjusted coverage remains below the national average.
FAQ
What is a charging port?
A charging port is one connector where an EV can plug in. One charging station can have several ports, so port count better reflects usable charging capacity.
Why does Vermont rank ahead of California?
The ranking is adjusted for population. Vermont has far fewer ports than California, but it also has far fewer residents, so its public port density is higher.
Does this include private home chargers?
No. The ranking covers public charging ports only. Home chargers, private workplace chargers and fleet-only chargers are not included.
Is a higher rank always better for drivers?
A higher rank is a useful signal, but real charging convenience also depends on speed, uptime, location, pricing and connector availability.
Why use population instead of registered EVs?
Population shows how dense the public network is for residents overall. Chargers per registered EV is a different metric and answers a different question about current EV demand.
Is this final 2026 data?
No. It is a May 7, 2026 AFDC inventory release paired with July 1, 2025 Census population estimates.
Sources
-
US Department of Energy, Alternative Fuels Data Center
Public EV charging-port counts by state. Inventory updated May 7, 2026.
https://afdc.energy.gov/stations/states -
US Census Bureau, Population Estimates Program
Vintage 2025 resident population estimates for states and the District of Columbia.
https://www.census.gov/data/tables/time-series/demo/popest/2020s-state-total.html -
Joint Office of Energy and Transportation
Federal context on EV charging infrastructure and station planning.
https://driveelectric.gov/stations
Related rankings
More StatRanker pages connected by topic, category or ranking theme.
Vehicle Theft Rate by Country (per 100,000 People): Global Comparison, 2025 Edition
Open rankingTop 100 Countries by Passenger Car Ownership per 1,000 People, 2025
Open rankingStatRanker (Website)
administrator
